Hope Mills, North Carolina Submit your own pictures of this town and show them to the world
OSM Map
General Map
Google Map
MSN Map
OSM Map
General Map
Google Map
MSN Map
OSM Map
General Map
Google Map
MSN Map
OSM Map
General Map
Google Map
MSN Map
Please wait while loading the map...
Population in 2022: 17,824 (100% urban, 0% rural). Population change since 2000: +58.6%Males: 8,500 Females: 9,324
March 2022 cost of living index in Hope Mills: 88.6 (less than average, U.S. average is 100) Percentage of residents living in poverty in 2022: 16.2%for White Non-Hispanic residents , 13.9% for Black residents , 17.4% for Hispanic or Latino residents , 23.3% for American Indian residents , 20.1% for other race residents , 20.9% for two or more races residents )
Profiles of local businesses
Business Search - 14 Million verified businesses
Data:
Median household income ($)
Median household income (% change since 2000)
Household income diversity
Ratio of average income to average house value (%)
Ratio of average income to average rent
Median household income ($) - White
Median household income ($) - Black or African American
Median household income ($) - Asian
Median household income ($) - Hispanic or Latino
Median household income ($) - American Indian and Alaska Native
Median household income ($) - Multirace
Median household income ($) - Other Race
Median household income for houses/condos with a mortgage ($)
Median household income for apartments without a mortgage ($)
Races - White alone (%)
Races - White alone (% change since 2000)
Races - Black alone (%)
Races - Black alone (% change since 2000)
Races - American Indian alone (%)
Races - American Indian alone (% change since 2000)
Races - Asian alone (%)
Races - Asian alone (% change since 2000)
Races - Hispanic (%)
Races - Hispanic (% change since 2000)
Races - Native Hawaiian and Other Pacific Islander alone (%)
Races - Native Hawaiian and Other Pacific Islander alone (% change since 2000)
Races - Two or more races (%)
Races - Two or more races (% change since 2000)
Races - Other race alone (%)
Races - Other race alone (% change since 2000)
Racial diversity
Unemployment (%)
Unemployment (% change since 2000)
Unemployment (%) - White
Unemployment (%) - Black or African American
Unemployment (%) - Asian
Unemployment (%) - Hispanic or Latino
Unemployment (%) - American Indian and Alaska Native
Unemployment (%) - Multirace
Unemployment (%) - Other Race
Population density (people per square mile)
Population - Males (%)
Population - Females (%)
Population - Males (%) - White
Population - Males (%) - Black or African American
Population - Males (%) - Asian
Population - Males (%) - Hispanic or Latino
Population - Males (%) - American Indian and Alaska Native
Population - Males (%) - Multirace
Population - Males (%) - Other Race
Population - Females (%) - White
Population - Females (%) - Black or African American
Population - Females (%) - Asian
Population - Females (%) - Hispanic or Latino
Population - Females (%) - American Indian and Alaska Native
Population - Females (%) - Multirace
Population - Females (%) - Other Race
Coronavirus confirmed cases (May 23, 2024)
Deaths caused by coronavirus (May 23, 2024)
Coronavirus confirmed cases (per 100k population) (May 23, 2024)
Deaths caused by coronavirus (per 100k population) (May 23, 2024)
Daily increase in number of cases (May 23, 2024)
Weekly increase in number of cases (May 23, 2024)
Cases doubled (in days) (May 23, 2024)
Hospitalized patients (Apr 18, 2022)
Negative test results (Apr 18, 2022)
Total test results (Apr 18, 2022)
COVID Vaccine doses distributed (per 100k population) (Sep 19, 2023)
COVID Vaccine doses administered (per 100k population) (Sep 19, 2023)
COVID Vaccine doses distributed (Sep 19, 2023)
COVID Vaccine doses administered (Sep 19, 2023)
Likely homosexual households (%)
Likely homosexual households (% change since 2000)
Likely homosexual households - Lesbian couples (%)
Likely homosexual households - Lesbian couples (% change since 2000)
Likely homosexual households - Gay men (%)
Likely homosexual households - Gay men (% change since 2000)
Cost of living index
Median gross rent ($)
Median contract rent ($)
Median monthly housing costs ($)
Median house or condo value ($)
Median house or condo value ($ change since 2000)
Mean house or condo value by units in structure - 1, detached ($)
Mean house or condo value by units in structure - 1, attached ($)
Mean house or condo value by units in structure - 2 ($)
Mean house or condo value by units in structure by units in structure - 3 or 4 ($)
Mean house or condo value by units in structure - 5 or more ($)
Mean house or condo value by units in structure - Boat, RV, van, etc. ($)
Mean house or condo value by units in structure - Mobile home ($)
Median house or condo value ($) - White
Median house or condo value ($) - Black or African American
Median house or condo value ($) - Asian
Median house or condo value ($) - Hispanic or Latino
Median house or condo value ($) - American Indian and Alaska Native
Median house or condo value ($) - Multirace
Median house or condo value ($) - Other Race
Median resident age
Resident age diversity
Median resident age - Males
Median resident age - Females
Median resident age - White
Median resident age - Black or African American
Median resident age - Asian
Median resident age - Hispanic or Latino
Median resident age - American Indian and Alaska Native
Median resident age - Multirace
Median resident age - Other Race
Median resident age - Males - White
Median resident age - Males - Black or African American
Median resident age - Males - Asian
Median resident age - Males - Hispanic or Latino
Median resident age - Males - American Indian and Alaska Native
Median resident age - Males - Multirace
Median resident age - Males - Other Race
Median resident age - Females - White
Median resident age - Females - Black or African American
Median resident age - Females - Asian
Median resident age - Females - Hispanic or Latino
Median resident age - Females - American Indian and Alaska Native
Median resident age - Females - Multirace
Median resident age - Females - Other Race
Commute - mean travel time to work (minutes)
Travel time to work - Less than 5 minutes (%)
Travel time to work - Less than 5 minutes (% change since 2000)
Travel time to work - 5 to 9 minutes (%)
Travel time to work - 5 to 9 minutes (% change since 2000)
Travel time to work - 10 to 19 minutes (%)
Travel time to work - 10 to 19 minutes (% change since 2000)
Travel time to work - 20 to 29 minutes (%)
Travel time to work - 20 to 29 minutes (% change since 2000)
Travel time to work - 30 to 39 minutes (%)
Travel time to work - 30 to 39 minutes (% change since 2000)
Travel time to work - 40 to 59 minutes (%)
Travel time to work - 40 to 59 minutes (% change since 2000)
Travel time to work - 60 to 89 minutes (%)
Travel time to work - 60 to 89 minutes (% change since 2000)
Travel time to work - 90 or more minutes (%)
Travel time to work - 90 or more minutes (% change since 2000)
Marital status - Never married (%)
Marital status - Now married (%)
Marital status - Separated (%)
Marital status - Widowed (%)
Marital status - Divorced (%)
Median family income ($)
Median family income (% change since 2000)
Median non-family income ($)
Median non-family income (% change since 2000)
Median per capita income ($)
Median per capita income (% change since 2000)
Median family income ($) - White
Median family income ($) - Black or African American
Median family income ($) - Asian
Median family income ($) - Hispanic or Latino
Median family income ($) - American Indian and Alaska Native
Median family income ($) - Multirace
Median family income ($) - Other Race
Median year house/condo built
Median year apartment built
Year house built - Built 2005 or later (%)
Year house built - Built 2000 to 2004 (%)
Year house built - Built 1990 to 1999 (%)
Year house built - Built 1980 to 1989 (%)
Year house built - Built 1970 to 1979 (%)
Year house built - Built 1960 to 1969 (%)
Year house built - Built 1950 to 1959 (%)
Year house built - Built 1940 to 1949 (%)
Year house built - Built 1939 or earlier (%)
Average household size
Household density (households per square mile)
Average household size - White
Average household size - Black or African American
Average household size - Asian
Average household size - Hispanic or Latino
Average household size - American Indian and Alaska Native
Average household size - Multirace
Average household size - Other Race
Occupied housing units (%)
Vacant housing units (%)
Owner occupied housing units (%)
Renter occupied housing units (%)
Vacancy status - For rent (%)
Vacancy status - For sale only (%)
Vacancy status - Rented or sold, not occupied (%)
Vacancy status - For seasonal, recreational, or occasional use (%)
Vacancy status - For migrant workers (%)
Vacancy status - Other vacant (%)
Residents with income below the poverty level (%)
Residents with income below 50% of the poverty level (%)
Children below poverty level (%)
Poor families by family type - Married-couple family (%)
Poor families by family type - Male, no wife present (%)
Poor families by family type - Female, no husband present (%)
Poverty status for native-born residents (%)
Poverty status for foreign-born residents (%)
Poverty among high school graduates not in families (%)
Poverty among people who did not graduate high school not in families (%)
Residents with income below the poverty level (%) - White
Residents with income below the poverty level (%) - Black or African American
Residents with income below the poverty level (%) - Asian
Residents with income below the poverty level (%) - Hispanic or Latino
Residents with income below the poverty level (%) - American Indian and Alaska Native
Residents with income below the poverty level (%) - Multirace
Residents with income below the poverty level (%) - Other Race
Air pollution - Air Quality Index (AQI)
Air pollution - CO
Air pollution - NO2
Air pollution - SO2
Air pollution - Ozone
Air pollution - PM10
Air pollution - PM25
Air pollution - Pb
Crime - Murders per 100,000 population
Crime - Rapes per 100,000 population
Crime - Robberies per 100,000 population
Crime - Assaults per 100,000 population
Crime - Burglaries per 100,000 population
Crime - Thefts per 100,000 population
Crime - Auto thefts per 100,000 population
Crime - Arson per 100,000 population
Crime - City-data.com crime index
Crime - Violent crime index
Crime - Property crime index
Crime - Murders per 100,000 population (5 year average)
Crime - Rapes per 100,000 population (5 year average)
Crime - Robberies per 100,000 population (5 year average)
Crime - Assaults per 100,000 population (5 year average)
Crime - Burglaries per 100,000 population (5 year average)
Crime - Thefts per 100,000 population (5 year average)
Crime - Auto thefts per 100,000 population (5 year average)
Crime - Arson per 100,000 population (5 year average)
Crime - City-data.com crime index (5 year average)
Crime - Violent crime index (5 year average)
Crime - Property crime index (5 year average)
1996 Presidential Elections Results (%) - Democratic Party (Clinton)
1996 Presidential Elections Results (%) - Republican Party (Dole)
1996 Presidential Elections Results (%) - Other
2000 Presidential Elections Results (%) - Democratic Party (Gore)
2000 Presidential Elections Results (%) - Republican Party (Bush)
2000 Presidential Elections Results (%) - Other
2004 Presidential Elections Results (%) - Democratic Party (Kerry)
2004 Presidential Elections Results (%) - Republican Party (Bush)
2004 Presidential Elections Results (%) - Other
2008 Presidential Elections Results (%) - Democratic Party (Obama)
2008 Presidential Elections Results (%) - Republican Party (McCain)
2008 Presidential Elections Results (%) - Other
2012 Presidential Elections Results (%) - Democratic Party (Obama)
2012 Presidential Elections Results (%) - Republican Party (Romney)
2012 Presidential Elections Results (%) - Other
2016 Presidential Elections Results (%) - Democratic Party (Clinton)
2016 Presidential Elections Results (%) - Republican Party (Trump)
2016 Presidential Elections Results (%) - Other
2020 Presidential Elections Results (%) - Democratic Party (Biden)
2020 Presidential Elections Results (%) - Republican Party (Trump)
2020 Presidential Elections Results (%) - Other
Ancestries Reported - Arab (%)
Ancestries Reported - Czech (%)
Ancestries Reported - Danish (%)
Ancestries Reported - Dutch (%)
Ancestries Reported - English (%)
Ancestries Reported - French (%)
Ancestries Reported - French Canadian (%)
Ancestries Reported - German (%)
Ancestries Reported - Greek (%)
Ancestries Reported - Hungarian (%)
Ancestries Reported - Irish (%)
Ancestries Reported - Italian (%)
Ancestries Reported - Lithuanian (%)
Ancestries Reported - Norwegian (%)
Ancestries Reported - Polish (%)
Ancestries Reported - Portuguese (%)
Ancestries Reported - Russian (%)
Ancestries Reported - Scotch-Irish (%)
Ancestries Reported - Scottish (%)
Ancestries Reported - Slovak (%)
Ancestries Reported - Subsaharan African (%)
Ancestries Reported - Swedish (%)
Ancestries Reported - Swiss (%)
Ancestries Reported - Ukrainian (%)
Ancestries Reported - United States (%)
Ancestries Reported - Welsh (%)
Ancestries Reported - West Indian (%)
Ancestries Reported - Other (%)
Educational Attainment - No schooling completed (%)
Educational Attainment - Less than high school (%)
Educational Attainment - High school or equivalent (%)
Educational Attainment - Less than 1 year of college (%)
Educational Attainment - 1 or more years of college (%)
Educational Attainment - Associate degree (%)
Educational Attainment - Bachelor's degree (%)
Educational Attainment - Master's degree (%)
Educational Attainment - Professional school degree (%)
Educational Attainment - Doctorate degree (%)
School Enrollment - Nursery, preschool (%)
School Enrollment - Kindergarten (%)
School Enrollment - Grade 1 to 4 (%)
School Enrollment - Grade 5 to 8 (%)
School Enrollment - Grade 9 to 12 (%)
School Enrollment - College undergrad (%)
School Enrollment - Graduate or professional (%)
School Enrollment - Not enrolled in school (%)
School enrollment - Public schools (%)
School enrollment - Private schools (%)
School enrollment - Not enrolled (%)
Median number of rooms in houses and condos
Median number of rooms in apartments
Housing units lacking complete plumbing facilities (%)
Housing units lacking complete kitchen facilities (%)
Density of houses
Urban houses (%)
Rural houses (%)
Households with people 60 years and over (%)
Households with people 65 years and over (%)
Households with people 75 years and over (%)
Households with one or more nonrelatives (%)
Households with no nonrelatives (%)
Population in households (%)
Family households (%)
Nonfamily households (%)
Population in families (%)
Family households with own children (%)
Median number of bedrooms in owner occupied houses
Mean number of bedrooms in owner occupied houses
Median number of bedrooms in renter occupied houses
Mean number of bedrooms in renter occupied houses
Median number of vehichles in owner occupied houses
Mean number of vehichles in owner occupied houses
Median number of vehichles in renter occupied houses
Mean number of vehichles in renter occupied houses
Mortgage status - with mortgage (%)
Mortgage status - with second mortgage (%)
Mortgage status - with home equity loan (%)
Mortgage status - with both second mortgage and home equity loan (%)
Mortgage status - without a mortgage (%)
Average family size
Average family size - White
Average family size - Black or African American
Average family size - Asian
Average family size - Hispanic or Latino
Average family size - American Indian and Alaska Native
Average family size - Multirace
Average family size - Other Race
Geographical mobility - Same house 1 year ago (%)
Geographical mobility - Moved within same county (%)
Geographical mobility - Moved from different county within same state (%)
Geographical mobility - Moved from different state (%)
Geographical mobility - Moved from abroad (%)
Place of birth - Born in state of residence (%)
Place of birth - Born in other state (%)
Place of birth - Native, outside of US (%)
Place of birth - Foreign born (%)
Housing units in structures - 1, detached (%)
Housing units in structures - 1, attached (%)
Housing units in structures - 2 (%)
Housing units in structures - 3 or 4 (%)
Housing units in structures - 5 to 9 (%)
Housing units in structures - 10 to 19 (%)
Housing units in structures - 20 to 49 (%)
Housing units in structures - 50 or more (%)
Housing units in structures - Mobile home (%)
Housing units in structures - Boat, RV, van, etc. (%)
House/condo owner moved in on average (years ago)
Renter moved in on average (years ago)
Year householder moved into unit - Moved in 1999 to March 2000 (%)
Year householder moved into unit - Moved in 1995 to 1998 (%)
Year householder moved into unit - Moved in 1990 to 1994 (%)
Year householder moved into unit - Moved in 1980 to 1989 (%)
Year householder moved into unit - Moved in 1970 to 1979 (%)
Year householder moved into unit - Moved in 1969 or earlier (%)
Means of transportation to work - Drove car alone (%)
Means of transportation to work - Carpooled (%)
Means of transportation to work - Public transportation (%)
Means of transportation to work - Bus or trolley bus (%)
Means of transportation to work - Streetcar or trolley car (%)
Means of transportation to work - Subway or elevated (%)
Means of transportation to work - Railroad (%)
Means of transportation to work - Ferryboat (%)
Means of transportation to work - Taxicab (%)
Means of transportation to work - Motorcycle (%)
Means of transportation to work - Bicycle (%)
Means of transportation to work - Walked (%)
Means of transportation to work - Other means (%)
Working at home (%)
Industry diversity
Most Common Industries - Agriculture, forestry, fishing and hunting, and mining (%)
Most Common Industries - Agriculture, forestry, fishing and hunting (%)
Most Common Industries - Mining, quarrying, and oil and gas extraction (%)
Most Common Industries - Construction (%)
Most Common Industries - Manufacturing (%)
Most Common Industries - Wholesale trade (%)
Most Common Industries - Retail trade (%)
Most Common Industries - Transportation and warehousing, and utilities (%)
Most Common Industries - Transportation and warehousing (%)
Most Common Industries - Utilities (%)
Most Common Industries - Information (%)
Most Common Industries - Finance and insurance, and real estate and rental and leasing (%)
Most Common Industries - Finance and insurance (%)
Most Common Industries - Real estate and rental and leasing (%)
Most Common Industries - Professional, scientific, and management, and administrative and waste management services (%)
Most Common Industries - Professional, scientific, and technical services (%)
Most Common Industries - Management of companies and enterprises (%)
Most Common Industries - Administrative and support and waste management services (%)
Most Common Industries - Educational services, and health care and social assistance (%)
Most Common Industries - Educational services (%)
Most Common Industries - Health care and social assistance (%)
Most Common Industries - Arts, entertainment, and recreation, and accommodation and food services (%)
Most Common Industries - Arts, entertainment, and recreation (%)
Most Common Industries - Accommodation and food services (%)
Most Common Industries - Other services, except public administration (%)
Most Common Industries - Public administration (%)
Occupation diversity
Most Common Occupations - Management, business, science, and arts occupations (%)
Most Common Occupations - Management, business, and financial occupations (%)
Most Common Occupations - Management occupations (%)
Most Common Occupations - Business and financial operations occupations (%)
Most Common Occupations - Computer, engineering, and science occupations (%)
Most Common Occupations - Computer and mathematical occupations (%)
Most Common Occupations - Architecture and engineering occupations (%)
Most Common Occupations - Life, physical, and social science occupations (%)
Most Common Occupations - Education, legal, community service, arts, and media occupations (%)
Most Common Occupations - Community and social service occupations (%)
Most Common Occupations - Legal occupations (%)
Most Common Occupations - Education, training, and library occupations (%)
Most Common Occupations - Arts, design, entertainment, sports, and media occupations (%)
Most Common Occupations - Healthcare practitioners and technical occupations (%)
Most Common Occupations - Health diagnosing and treating practitioners and other technical occupations (%)
Most Common Occupations - Health technologists and technicians (%)
Most Common Occupations - Service occupations (%)
Most Common Occupations - Healthcare support occupations (%)
Most Common Occupations - Protective service occupations (%)
Most Common Occupations - Fire fighting and prevention, and other protective service workers including supervisors (%)
Most Common Occupations - Law enforcement workers including supervisors (%)
Most Common Occupations - Food preparation and serving related occupations (%)
Most Common Occupations - Building and grounds cleaning and maintenance occupations (%)
Most Common Occupations - Personal care and service occupations (%)
Most Common Occupations - Sales and office occupations (%)
Most Common Occupations - Sales and related occupations (%)
Most Common Occupations - Office and administrative support occupations (%)
Most Common Occupations - Natural resources, construction, and maintenance occupations (%)
Most Common Occupations - Farming, fishing, and forestry occupations (%)
Most Common Occupations - Construction and extraction occupations (%)
Most Common Occupations - Installation, maintenance, and repair occupations (%)
Most Common Occupations - Production, transportation, and material moving occupations (%)
Most Common Occupations - Production occupations (%)
Most Common Occupations - Transportation occupations (%)
Most Common Occupations - Material moving occupations (%)
People in Group quarters - Institutionalized population (%)
People in Group quarters - Correctional institutions (%)
People in Group quarters - Federal prisons and detention centers (%)
People in Group quarters - Halfway houses (%)
People in Group quarters - Local jails and other confinement facilities (including police lockups) (%)
People in Group quarters - Military disciplinary barracks (%)
People in Group quarters - State prisons (%)
People in Group quarters - Other types of correctional institutions (%)
People in Group quarters - Nursing homes (%)
People in Group quarters - Hospitals/wards, hospices, and schools for the handicapped (%)
People in Group quarters - Hospitals/wards and hospices for chronically ill (%)
People in Group quarters - Hospices or homes for chronically ill (%)
People in Group quarters - Military hospitals or wards for chronically ill (%)
People in Group quarters - Other hospitals or wards for chronically ill (%)
People in Group quarters - Hospitals or wards for drug/alcohol abuse (%)
People in Group quarters - Mental (Psychiatric) hospitals or wards (%)
People in Group quarters - Schools, hospitals, or wards for the mentally retarded (%)
People in Group quarters - Schools, hospitals, or wards for the physically handicapped (%)
People in Group quarters - Institutions for the deaf (%)
People in Group quarters - Institutions for the blind (%)
People in Group quarters - Orthopedic wards and institutions for the physically handicapped (%)
People in Group quarters - Wards in general hospitals for patients who have no usual home elsewhere (%)
People in Group quarters - Wards in military hospitals for patients who have no usual home elsewhere (%)
People in Group quarters - Juvenile institutions (%)
People in Group quarters - Long-term care (%)
People in Group quarters - Homes for abused, dependent, and neglected children (%)
People in Group quarters - Residential treatment centers for emotionally disturbed children (%)
People in Group quarters - Training schools for juvenile delinquents (%)
People in Group quarters - Short-term care, detention or diagnostic centers for delinquent children (%)
People in Group quarters - Type of juvenile institution unknown (%)
People in Group quarters - Noninstitutionalized population (%)
People in Group quarters - College dormitories (includes college quarters off campus) (%)
People in Group quarters - Military quarters (%)
People in Group quarters - On base (%)
People in Group quarters - Barracks, unaccompanied personnel housing (UPH), (Enlisted/Officer), ;and similar group living quarters for military personnel (%)
People in Group quarters - Transient quarters for temporary residents (%)
People in Group quarters - Military ships (%)
People in Group quarters - Group homes (%)
People in Group quarters - Homes or halfway houses for drug/alcohol abuse (%)
People in Group quarters - Homes for the mentally ill (%)
People in Group quarters - Homes for the mentally retarded (%)
People in Group quarters - Homes for the physically handicapped (%)
People in Group quarters - Other group homes (%)
People in Group quarters - Religious group quarters (%)
People in Group quarters - Dormitories (%)
People in Group quarters - Agriculture workers' dormitories on farms (%)
People in Group quarters - Job Corps and vocational training facilities (%)
People in Group quarters - Other workers' dormitories (%)
People in Group quarters - Crews of maritime vessels (%)
People in Group quarters - Other nonhousehold living situations (%)
People in Group quarters - Other noninstitutional group quarters (%)
Residents speaking English at home (%)
Residents speaking English at home - Born in the United States (%)
Residents speaking English at home - Native, born elsewhere (%)
Residents speaking English at home - Foreign born (%)
Residents speaking Spanish at home (%)
Residents speaking Spanish at home - Born in the United States (%)
Residents speaking Spanish at home - Native, born elsewhere (%)
Residents speaking Spanish at home - Foreign born (%)
Residents speaking other language at home (%)
Residents speaking other language at home - Born in the United States (%)
Residents speaking other language at home - Native, born elsewhere (%)
Residents speaking other language at home - Foreign born (%)
Class of Workers - Employee of private company (%)
Class of Workers - Self-employed in own incorporated business (%)
Class of Workers - Private not-for-profit wage and salary workers (%)
Class of Workers - Local government workers (%)
Class of Workers - State government workers (%)
Class of Workers - Federal government workers (%)
Class of Workers - Self-employed workers in own not incorporated business and Unpaid family workers (%)
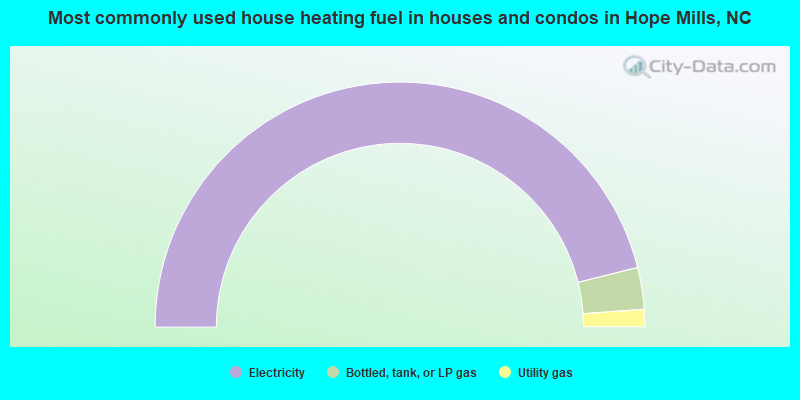
House heating fuel used in houses and condos - Utility gas (%)
House heating fuel used in houses and condos - Bottled, tank, or LP gas (%)
House heating fuel used in houses and condos - Electricity (%)
House heating fuel used in houses and condos - Fuel oil, kerosene, etc. (%)
House heating fuel used in houses and condos - Coal or coke (%)
House heating fuel used in houses and condos - Wood (%)
House heating fuel used in houses and condos - Solar energy (%)
House heating fuel used in houses and condos - Other fuel (%)
House heating fuel used in houses and condos - No fuel used (%)
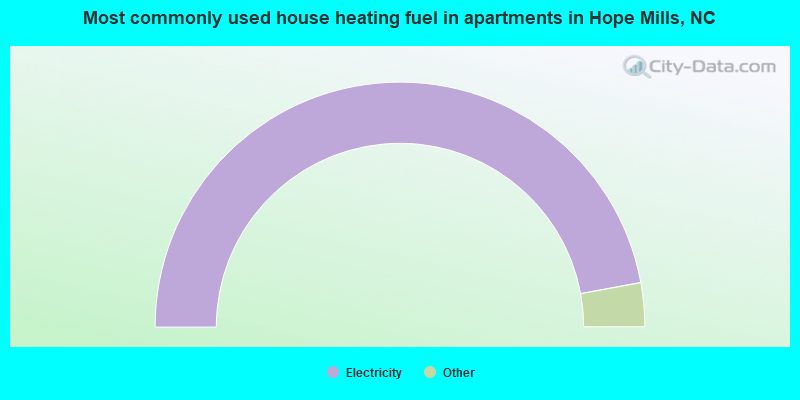
House heating fuel used in apartments - Utility gas (%)
House heating fuel used in apartments - Bottled, tank, or LP gas (%)
House heating fuel used in apartments - Electricity (%)
House heating fuel used in apartments - Fuel oil, kerosene, etc. (%)
House heating fuel used in apartments - Coal or coke (%)
House heating fuel used in apartments - Wood (%)
House heating fuel used in apartments - Solar energy (%)
House heating fuel used in apartments - Other fuel (%)
House heating fuel used in apartments - No fuel used (%)
Armed forces status - In Armed Forces (%)
Armed forces status - Civilian (%)
Armed forces status - Civilian - Veteran (%)
Armed forces status - Civilian - Nonveteran (%)
Fatal accidents locations in years 2005-2021
Fatal accidents locations in 2005
Fatal accidents locations in 2006
Fatal accidents locations in 2007
Fatal accidents locations in 2008
Fatal accidents locations in 2009
Fatal accidents locations in 2010
Fatal accidents locations in 2011
Fatal accidents locations in 2012
Fatal accidents locations in 2013
Fatal accidents locations in 2014
Fatal accidents locations in 2015
Fatal accidents locations in 2016
Fatal accidents locations in 2017
Fatal accidents locations in 2018
Fatal accidents locations in 2019
Fatal accidents locations in 2020
Fatal accidents locations in 2021
Alcohol use - People drinking some alcohol every month (%)
Alcohol use - People not drinking at all (%)
Alcohol use - Average days/month drinking alcohol
Alcohol use - Average drinks/week
Alcohol use - Average days/year people drink much
Audiometry - Average condition of hearing (%)
Audiometry - People that can hear a whisper from across a quiet room (%)
Audiometry - People that can hear normal voice from across a quiet room (%)
Audiometry - Ears ringing, roaring, buzzing (%)
Audiometry - Had a job exposure to loud noise (%)
Audiometry - Had off-work exposure to loud noise (%)
Blood Pressure & Cholesterol - Has high blood pressure (%)
Blood Pressure & Cholesterol - Checking blood pressure at home (%)
Blood Pressure & Cholesterol - Frequently checking blood cholesterol (%)
Blood Pressure & Cholesterol - Has high cholesterol level (%)
Consumer Behavior - Money monthly spent on food at supermarket/grocery store
Consumer Behavior - Money monthly spent on food at other stores
Consumer Behavior - Money monthly spent on eating out
Consumer Behavior - Money monthly spent on carryout/delivered foods
Consumer Behavior - Income spent on food at supermarket/grocery store (%)
Consumer Behavior - Income spent on food at other stores (%)
Consumer Behavior - Income spent on eating out (%)
Consumer Behavior - Income spent on carryout/delivered foods (%)
Current Health Status - General health condition (%)
Current Health Status - Blood donors (%)
Current Health Status - Has blood ever tested for HIV virus (%)
Current Health Status - Left-handed people (%)
Dermatology - People using sunscreen (%)
Diabetes - Diabetics (%)
Diabetes - Had a blood test for high blood sugar (%)
Diabetes - People taking insulin (%)
Diet Behavior & Nutrition - Diet health (%)
Diet Behavior & Nutrition - Milk product consumption (# of products/month)
Diet Behavior & Nutrition - Meals not home prepared (#/week)
Diet Behavior & Nutrition - Meals from fast food or pizza place (#/week)
Diet Behavior & Nutrition - Ready-to-eat foods (#/month)
Diet Behavior & Nutrition - Frozen meals/pizza (#/month)
Drug Use - People that ever used marijuana or hashish (%)
Drug Use - Ever used hard drugs (%)
Drug Use - Ever used any form of cocaine (%)
Drug Use - Ever used heroin (%)
Drug Use - Ever used methamphetamine (%)
Health Insurance - People covered by health insurance (%)
Kidney Conditions-Urology - Avg. # of times urinating at night
Medical Conditions - People with asthma (%)
Medical Conditions - People with anemia (%)
Medical Conditions - People with psoriasis (%)
Medical Conditions - People with overweight (%)
Medical Conditions - Elderly people having difficulties in thinking or remembering (%)
Medical Conditions - People who ever received blood transfusion (%)
Medical Conditions - People having trouble seeing even with glass/contacts (%)
Medical Conditions - People with arthritis (%)
Medical Conditions - People with gout (%)
Medical Conditions - People with congestive heart failure (%)
Medical Conditions - People with coronary heart disease (%)
Medical Conditions - People with angina pectoris (%)
Medical Conditions - People who ever had heart attack (%)
Medical Conditions - People who ever had stroke (%)
Medical Conditions - People with emphysema (%)
Medical Conditions - People with thyroid problem (%)
Medical Conditions - People with chronic bronchitis (%)
Medical Conditions - People with any liver condition (%)
Medical Conditions - People who ever had cancer or malignancy (%)
Mental Health - People who have little interest in doing things (%)
Mental Health - People feeling down, depressed, or hopeless (%)
Mental Health - People who have trouble sleeping or sleeping too much (%)
Mental Health - People feeling tired or having little energy (%)
Mental Health - People with poor appetite or overeating (%)
Mental Health - People feeling bad about themself (%)
Mental Health - People who have trouble concentrating on things (%)
Mental Health - People moving or speaking slowly or too fast (%)
Mental Health - People having thoughts they would be better off dead (%)
Oral Health - Average years since last visit a dentist
Oral Health - People embarrassed because of mouth (%)
Oral Health - People with gum disease (%)
Oral Health - General health of teeth and gums (%)
Oral Health - Average days a week using dental floss/device
Oral Health - Average days a week using mouthwash for dental problem
Oral Health - Average number of teeth
Pesticide Use - Households using pesticides to control insects (%)
Pesticide Use - Households using pesticides to kill weeds (%)
Physical Activity - People doing vigorous-intensity work activities (%)
Physical Activity - People doing moderate-intensity work activities (%)
Physical Activity - People walking or bicycling (%)
Physical Activity - People doing vigorous-intensity recreational activities (%)
Physical Activity - People doing moderate-intensity recreational activities (%)
Physical Activity - Average hours a day doing sedentary activities
Physical Activity - Average hours a day watching TV or videos
Physical Activity - Average hours a day using computer
Physical Functioning - People having limitations keeping them from working (%)
Physical Functioning - People limited in amount of work they can do (%)
Physical Functioning - People that need special equipment to walk (%)
Physical Functioning - People experiencing confusion/memory problems (%)
Physical Functioning - People requiring special healthcare equipment (%)
Prescription Medications - Average number of prescription medicines taking
Preventive Aspirin Use - Adults 40+ taking low-dose aspirin (%)
Reproductive Health - Vaginal deliveries (%)
Reproductive Health - Cesarean deliveries (%)
Reproductive Health - Deliveries resulted in a live birth (%)
Reproductive Health - Pregnancies resulted in a delivery (%)
Reproductive Health - Women breastfeeding newborns (%)
Reproductive Health - Women that had a hysterectomy (%)
Reproductive Health - Women that had both ovaries removed (%)
Reproductive Health - Women that have ever taken birth control pills (%)
Reproductive Health - Women taking birth control pills (%)
Reproductive Health - Women that have ever used Depo-Provera or injectables (%)
Reproductive Health - Women that have ever used female hormones (%)
Sexual Behavior - People 18+ that ever had sex (vaginal, anal, or oral) (%)
Sexual Behavior - Males 18+ that ever had vaginal sex with a woman (%)
Sexual Behavior - Males 18+ that ever performed oral sex on a woman (%)
Sexual Behavior - Males 18+ that ever had anal sex with a woman (%)
Sexual Behavior - Males 18+ that ever had any sex with a man (%)
Sexual Behavior - Females 18+ that ever had vaginal sex with a man (%)
Sexual Behavior - Females 18+ that ever performed oral sex on a man (%)
Sexual Behavior - Females 18+ that ever had anal sex with a man (%)
Sexual Behavior - Females 18+ that ever had any kind of sex with a woman (%)
Sexual Behavior - Average age people first had sex
Sexual Behavior - Average number of female sex partners in lifetime (males 18+)
Sexual Behavior - Average number of female vaginal sex partners in lifetime (males 18+)
Sexual Behavior - Average age people first performed oral sex on a woman (18+)
Sexual Behavior - Average number of woman performed oral sex on in lifetime (18+)
Sexual Behavior - Average number of male sex partners in lifetime (males 18+)
Sexual Behavior - Average number of male anal sex partners in lifetime (males 18+)
Sexual Behavior - Average age people first performed oral sex on a man (18+)
Sexual Behavior - Average number of male oral sex partners in lifetime (18+)
Sexual Behavior - People using protection when performing oral sex (%)
Sexual Behavior - Average number of times people have vaginal or anal sex a year
Sexual Behavior - People having sex without condom (%)
Sexual Behavior - Average number of male sex partners in lifetime (females 18+)
Sexual Behavior - Average number of male vaginal sex partners in lifetime (females 18+)
Sexual Behavior - Average number of female sex partners in lifetime (females 18+)
Sexual Behavior - Circumcised males 18+ (%)
Sleep Disorders - Average hours sleeping at night
Sleep Disorders - People that has trouble sleeping (%)
Smoking-Cigarette Use - People smoking cigarettes (%)
Taste & Smell - People 40+ having problems with smell (%)
Taste & Smell - People 40+ having problems with taste (%)
Taste & Smell - People 40+ that ever had wisdom teeth removed (%)
Taste & Smell - People 40+ that ever had tonsils teeth removed (%)
Taste & Smell - People 40+ that ever had a loss of consciousness because of a head injury (%)
Taste & Smell - People 40+ that ever had a broken nose or other serious injury to face or skull (%)
Taste & Smell - People 40+ that ever had two or more sinus infections (%)
Weight - Average height (inches)
Weight - Average weight (pounds)
Weight - Average BMI
Weight - People that are obese (%)
Weight - People that ever were obese (%)
Weight - People trying to lose weight (%)
Officers per 1,000 residents here:
2.07North Carolina average:
2.27
Latest news from Hope Mills, NC collected exclusively by city-data.com from local newspapers, TV, and radio stations
Ancestries: American (11.9%), English (5.5%), European (3.9%), Irish (3.0%), German (2.7%), Scotch-Irish (1.6%).
Current Local Time:
Land area: 6.09 square miles.
Population density: 2,926 people per square mile (average).
1,266 residents are foreign born (3.9% Latin America , 2.3% Asia ).
This town:
7.1%North Carolina:
8.3%
Median real estate property taxes paid for housing units with mortgages in 2022: $1,921 (1.0%)Median real estate property taxes paid for housing units with no mortgage in 2022: $1,724 (1.0%)
Nearest city with pop. 50,000+: Fayetteville, NC
Nearest city with pop. 200,000+: Raleigh, NC
Nearest city with pop. 1,000,000+: Philadelphia, PA
Nearest cities:
Lumber Bridge, NC (2.9 miles),
Rex, NC (3.1 miles),
Latitude: 34.97 N, Longitude: 78.96 W
Daytime population change due to commuting: -2,736 (-15.4%)Workers who live and work in this town: 1,225 (16.1%)
Area code commonly used in this area: 910
Property values in Hope Mills, NC
Single-family new house construction building permits:
2022: 99 buildings , average cost: $241,2002021: 37 buildings , average cost: $291,6002020: 29 buildings , average cost: $270,8002016: 3 buildings , average cost: $312,4002015: 12 buildings , average cost: $312,4002014: 18 buildings , average cost: $303,9002013: 29 buildings , average cost: $307,6002012: 20 buildings , average cost: $295,3002011: 42 buildings , average cost: $292,4002010: 116 buildings , average cost: $250,6002009: 214 buildings , average cost: $239,1002008: 59 buildings , average cost: $152,5002007: 84 buildings , average cost: $118,8002006: 147 buildings , average cost: $128,9002005: 133 buildings , average cost: $135,4002004: 181 buildings , average cost: $145,6002003: 201 buildings , average cost: $157,6002002: 126 buildings , average cost: $143,5002001: 77 buildings , average cost: $105,2002000: 70 buildings , average cost: $85,2001999: 81 buildings , average cost: $82,7001998: 142 buildings , average cost: $78,6001997: 187 buildings , average cost: $71,200Unemployment in December 2023: Here:
4.4%North Carolina:
3.2%
Population change in the 1990s: +3,051 (+37.3%).
Most common occupations in Hope Mills, NC (%)
Both Males Females
Preschool, kindergarten, elementary, and middle school teachers (5.4%)
Driver/sales workers and truck drivers (4.8%)
Material recording, scheduling, dispatching, and distributing workers (4.1%)
Retail sales workers, except cashiers (3.9%)
Other production occupations, including supervisors (3.6%)
Other sales and related occupations, including supervisors (3.4%)
Cashiers (3.2%)
Driver/sales workers and truck drivers (8.9%)
Material recording, scheduling, dispatching, and distributing workers (6.3%)
Electrical equipment mechanics and other installation, maintenance, and repair workers, including supervisors (5.2%)
Law enforcement workers, including supervisors (5.0%)
Laborers and material movers, hand (3.5%)
Vehicle and mobile equipment mechanics, installers, and repairers (3.4%)
Other sales and related occupations, including supervisors (3.4%)
Preschool, kindergarten, elementary, and middle school teachers (7.8%)
Cashiers (5.4%)
Retail sales workers, except cashiers (5.2%)
Other teachers, instructors, education, training, and library occupations (5.0%)
Secretaries and administrative assistants (4.8%)
Other production occupations, including supervisors (3.8%)
Bookkeeping, accounting, and auditing clerks (3.6%)
Tornado activity:
Hope Mills-area historical tornado activity is slightly above North Carolina state average. It is 14% greater than the overall U.S. average.
On 3/28/1984, a category F4 (max. wind speeds 207-260 mph) tornado 5.2 miles away from the Hope Mills town center killed 4 people and injured 395 people and caused between $5,000,000 and $50,000,000 in damages.
On 4/8/1957, a category F4 tornado 24.4 miles away from the town center injured 21 people and caused between $50,000 and $500,000 in damages.
Earthquake activity:
Hope Mills-area historical earthquake activity is significantly above North Carolina state average. It is 51% smaller than the overall U.S. average. On 8/23/2011 at 17:51:04, a magnitude 5.8 (5.8 MW, Depth: 3.7 mi, Class: Moderate, Intensity: VI - VII) earthquake occurred 211.1 miles away from the city center On 8/9/2020 at 12:07:37, a magnitude 5.1 (5.1 MW, Depth: 4.7 mi) earthquake occurred 158.8 miles away from the city center On 11/22/1974 at 05:25:55, a magnitude 4.7 (4.7 MB, Class: Light, Intensity: IV - V) earthquake occurred 158.6 miles away from Hope Mills center On 8/2/1974 at 08:52:09, a magnitude 4.9 (4.3 MB, 4.9 LG) earthquake occurred 215.3 miles away from Hope Mills center On 8/21/1992 at 16:31:55, a magnitude 4.4 (4.1 MB, 4.1 LG, 4.4 LG, Depth: 6.2 mi) earthquake occurred 148.5 miles away from the city center On 12/9/2003 at 20:59:14, a magnitude 4.5 (4.5 MB, 4.5 LG) earthquake occurred 190.3 miles away from the city center Magnitude types: regional Lg-wave magnitude (LG), body-wave magnitude (MB), moment magnitude (MW) Natural disasters: The number of natural disasters in Cumberland County (15) is near the US average (15).Major Disasters (Presidential) Declared: 8Emergencies Declared: 4Hurricanes: 10, Storms: 2, Tornadoes: 2, Fire: 1, Flood: 1, Tropical Storm: 1, Other: 1 (Note: some incidents may be assigned to more than one category). Hospitals and medical centers near Hope Mills: CAROLINA REHAB CENTER OF CUMBERLAND (Nursing Home, about 3 miles away; FAYETTEVILLE, NC)
CUMBERLAND NURSING AND REHABILITATION CENTER (Nursing Home, about 5 miles away; FAYETTEVILLE, NC)
CAPE FEAR VALLEY HH AND HOSPIC (Hospital, about 5 miles away; FAYETTEVILLE, NC)
LIBERTY HOME CARE (Home Health Center, about 5 miles away; FAYETTEVILLE, NC)
CUMBERLAND HOSPITAL (Hospital, about 5 miles away; FAYETTEVILLE, NC)
CAPE FEAR VALLEY MEDICAL CENTER (about 5 miles away; FAYETTEVILLE, NC)
FAYETTEVILLE KIDNEY CENTER (Dialysis Facility, about 5 miles away; FAYETTEVILLE, NC)
Amtrak station near Hope Mills: 8 miles: FAYETTEVILLE (472 HAY ST.) Services: ticket office, partially wheelchair accessible, enclosed waiting area, public restrooms, public payphones, free short-term parking, call for taxi service.
Colleges/universities with over 2000 students nearest to Hope Mills:
Fayetteville Technical Community College (about 7 miles; Fayetteville, NC ; Full-time enrollment: 10,114)
Fayetteville State University (about 8 miles; Fayetteville, NC ; FT enrollment: 5,297)
Methodist University (about 13 miles; Fayetteville, NC ; FT enrollment: 2,313)
University of North Carolina at Pembroke (about 25 miles; Pembroke, NC ; FT enrollment: 5,548)
Robeson Community College (about 25 miles; Lumberton, NC ; FT enrollment: 2,322)
Sandhills Community College (about 32 miles; Pinehurst, NC ; FT enrollment: 3,434)
Campbell University (about 33 miles; Buies Creek, NC ; FT enrollment: 5,127)
Public high schools in Hope Mills:
Public elementary/middle schools in Hope Mills:
See full list of schools located in Hope Mills Birthplace of: Richard Holmes (Canadian football) - Football player.
Cumberland County has a predicted average indoor radon screening level less than 2 pCi/L (pico curies per liter) - Low Potential Drinking water stations with addresses in Hope Mills and their reported violations in the past:
FANTASY LAKE (Address: FANTASY LAKE WATER PARK Population served: 150, Groundwater):
Past monitoring violations:
2 routine major monitoring violations
Population served: 125, Groundwater):
Past monitoring violations:
2 routine major monitoring violations
Population served: 100, Groundwater):
Past monitoring violations:
2 routine major monitoring violations
Population served: 100, Groundwater):
Past health violations:
MCL, Monthly (TCR) - In AUG-2013, Contaminant: Coliform. Follow-up actions: St Public Notif requested (SEP-04-2013), St Formal NOV issued (SEP-04-2013), St AO (w/o penalty) issued (SEP-04-2013), St Compliance achieved (SEP-30-2013), St Public Notif received (JUL-08-2014)
MCL, Monthly (TCR) - Between JUL-2013 and SEP-2013, Contaminant: Coliform. Follow-up actions: St Public Notif requested (AUG-05-2013), St Formal NOV issued (AUG-05-2013), St AO (w/o penalty) issued (AUG-05-2013), St Compliance achieved (SEP-30-2013), St Public Notif received (JUL-08-2014)
Past monitoring violations:
Monitoring, Repeat Major (TCR) - In JUL-2013, Contaminant: Coliform (TCR). Follow-up actions: St Compliance achieved (AUG-30-2013), St Public Notif requested (NOV-06-2013), St Formal NOV issued (NOV-06-2013), St AO (w/o penalty) issued (NOV-06-2013), St AO (w/penalty) issued (DEC-03-2013), St Case dropped (DEC-12-2013), St Public Notif received (JUL-08-2014)
14 routine major monitoring violations
2 regular monitoring violations
Population served: 75, Groundwater):
Past health violations:
MCL, Monthly (TCR) - Between JUL-2012 and SEP-2012, Contaminant: Coliform. Follow-up actions: St Public Notif requested (JUL-30-2012), St Formal NOV issued (JUL-30-2012), St AO (w/o penalty) issued (JUL-30-2012), St Compliance achieved (AUG-31-2012), St Public Notif received (JAN-25-2013)
Past monitoring violations:
2 routine major monitoring violations
2 regular monitoring violations
Population served: 50, Groundwater):
Past monitoring violations:
Monitoring, Repeat Major (TCR) - Between OCT-2009 and DEC-2009, Contaminant: Coliform (TCR). Follow-up actions: St Public Notif requested (MAR-30-2010), St Formal NOV issued (MAR-30-2010), St AO (w/penalty) issued (JUN-24-2010), St Compliance achieved (DEC-31-2010)
Monitoring, Repeat Major (TCR) - Between JUL-2008 and SEP-2008, Contaminant: Coliform (TCR). Follow-up actions: St Public Notif requested (FEB-10-2009), St Formal NOV issued (FEB-10-2009), St Compliance achieved (SEP-01-2010)
14 routine major monitoring violations
Population served: 50, Groundwater):
Past monitoring violations:
One routine major monitoring violation
Population served: 50, Groundwater):
Past health violations:
MCL, Monthly (TCR) - Between JUL-2012 and SEP-2012, Contaminant: Coliform. Follow-up actions: St Public Notif requested (AUG-03-2012), St Formal NOV issued (AUG-03-2012), St AO (w/o penalty) issued (AUG-03-2012), St Compliance achieved (AUG-31-2012), St Public Notif received (JAN-25-2013)
MCL, Single Sample - Between JAN-2006 and DEC-2006, Contaminant: Nitrate. Follow-up actions: St Tech Assistance Visit (AUG-17-2006), St Formal NOV issued (AUG-17-2006), St Public Notif requested (AUG-17-2006), St Compliance achieved (AUG-25-2006)
Past monitoring violations:
9 routine major monitoring violations
6 regular monitoring violations
Average household size: This town:
2.7 peopleNorth Carolina:
2.5 people
Percentage of family households: This town:
72.8%Whole state:
66.7%
Percentage of households with unmarried partners: This town:
5.7%Whole state:
5.9%
Likely homosexual households (counted as self-reported same-sex unmarried-partner households)
Lesbian couples: 0.5% of all households Gay men: 0.2% of all households
124 people in nursing facilities/skilled-nursing facilities in 2010people in other noninstitutional facilities in 2010
Banks with branches in Hope Mills (2011 data):
First South Bank: Hope Mills Branch at 3103 North Main Street, branch established on 2003/07/14. Info updated 2006/11/03: Bank assets: $744.4 mil, Deposits: $644.7 mil, headquarters in Washington, NC, positive income , Commercial Lending Specialization, 27 total offices , Holding Company: First South Bancorp, Inc.
Branch Banking and Trust Company: Hope Mills Branch at 3618 North Main Street, branch established on 1961/06/29. Info updated 2010/03/29: Bank assets: $168,867.6 mil, Deposits: $127,549.5 mil, headquarters in Winston Salem, NC, positive income , Commercial Lending Specialization, 1793 total offices , Holding Company: Bb&T Corporation
Lumbee Guaranty Bank: Hope Mills Branch at 3500 North Main Street, branch established on 1986/10/06. Info updated 2006/11/03: Bank assets: $304.2 mil, Deposits: $260.6 mil, headquarters in Pembroke, NC, positive income , Commercial Lending Specialization, 12 total offices
Capital Bank, National Association: Hope Mills Branch at Southpeak Drive, branch established on 2010/07/16. Info updated 2011/09/21: Bank assets: $6,448.0 mil, Deposits: $5,135.4 mil, headquarters in Miami, FL, positive income , Commercial Lending Specialization, 152 total offices , Holding Company: North American Financial Holdings, Inc.
First-Citizens Bank & Trust Company: Hope Mills Branch at 3626 North Main Street, branch established on 1974/11/19. Info updated 2011/10/11: Bank assets: $20,566.4 mil, Deposits: $17,596.8 mil, headquarters in Raleigh, NC, positive income , Commercial Lending Specialization, 433 total offices , Holding Company: First Citizens Bancshares, Inc.
The Fort Sill National Bank: Fsnb - Hope Mills Walmart Branch at 3030 N. Main Street, branch established on 1997/07/01. Info updated 2006/11/03: Bank assets: $369.8 mil, Deposits: $324.4 mil, headquarters in Fort Sill, OK, positive income , 71 total offices , Holding Company: Jrmb Ii, Inc
For population 15 years and over in Hope Mills:
Never married: 30.8%Now married: 49.8%Separated: 3.2%Widowed: 4.5%Divorced: 11.7% For population 25 years and over in Hope Mills:
High school or higher: 92.5%Bachelor's degree or higher: 22.2%Graduate or professional degree: 6.7%Unemployed: 4.7%Mean travel time to work (commute): 23.8 minutes
Education Gini index (Inequality in education) Here:
9.0North Carolina average:
11.7
Religion statistics for Hope Mills, NC (based on Cumberland County data)
Religion Adherents Congregations Evangelical Protestant 91,229 291 Mainline Protestant 26,956 74 Black Protestant 14,701 46 Catholic 8,926 7 Other 6,165 20 Orthodox 440 2 None 171,014 -
Source: Clifford Grammich, Kirk Hadaway, Richard Houseal, Dale E.Jones, Alexei Krindatch, Richie Stanley and Richard H.Taylor. 2012. 2010 U.S.Religion Census: Religious Congregations & Membership Study. Association of Statisticians of American Religious Bodies. Jones, Dale E., et al. 2002. Congregations and Membership in the United States 2000. Nashville, TN: Glenmary Research Center. Graphs represent county-level data
Food Environment Statistics: Number of grocery stores : 48Cumberland County :
1.55 / 10,000 pop.North Carolina :
2.05 / 10,000 pop.
Number of supercenters and club stores : 4Cumberland County :
0.13 / 10,000 pop.State :
0.14 / 10,000 pop.
Number of convenience stores (no gas) : 13Cumberland County :
0.42 / 10,000 pop.State :
0.92 / 10,000 pop.
Number of convenience stores (with gas) : 149Here :
4.82 / 10,000 pop.North Carolina :
4.75 / 10,000 pop.
Number of full-service restaurants : 177Cumberland County :
5.73 / 10,000 pop.North Carolina :
7.57 / 10,000 pop.
Adult diabetes rate : This county :
11.4%North Carolina :
9.8%
Adult obesity rate : This county :
31.1%North Carolina :
28.3%
Low-income preschool obesity rate : Health and Nutrition: Healthy diet rate : This city:
49.2%State:
48.9%
Average overall health of teeth and gums : Hope Mills:
48.3%State:
46.1%
Average BMI : Hope Mills:
29.2North Carolina:
28.8
People feeling badly about themselves : This city:
20.8%North Carolina:
20.7%
People not drinking alcohol at all : Average hours sleeping at night : Here:
6.7North Carolina:
6.8
Overweight people : This city:
35.7%State:
33.7%
General health condition : Here:
57.6%North Carolina:
55.8%
Average condition of hearing : This city:
81.9%State:
79.7%
More about Health and Nutrition of Hope Mills, NC Residents
Local government employment and payroll (March 2022)
Function
Full-time employees
Monthly full-time payroll
Average yearly full-time wage
Part-time employees
Monthly part-time payroll
Police Protection - Officers
40 $157,202 $47,161 0 $0 Firefighters
32 $126,448 $47,418 0 $0 Parks and Recreation
13 $54,260 $50,086 23 $20,841 Other and Unallocable
13 $57,830 $53,382 2 $2,969 Other Government Administration
13 $107,937 $99,634 0 $0 Police - Other
6 $21,851 $43,702 0 $0 Streets and Highways
6 $20,484 $40,968 0 $0 Solid Waste Management
5 $16,325 $39,180 0 $0 Financial Administration
4 $25,961 $77,883 0 $0 Sewerage
2 $11,933 $71,598 0 $0
Totals for Government
134 $600,231 $53,752 25 $23,810
Hope Mills government finances - Expenditure in 2021 (per resident):
Construction - Police Protection: $3,498,000 ($196.25)
General Public Buildings: $266,000 ($14.92)Current Operations - Police Protection: $3,549,000 ($199.11)
Local Fire Protection: $2,670,000 ($149.80)Parks and Recreation: $1,654,000 ($92.80)Solid Waste Management: $960,000 ($53.86)Central Staff Services: $842,000 ($47.24)Financial Administration: $656,000 ($36.80)Regular Highways: $655,000 ($36.75)General Public Buildings: $421,000 ($23.62)Sewerage: $393,000 ($22.05)Housing and Community Development: $329,000 ($18.46)Protective Inspection and Regulation - Other: $284,000 ($15.93)Public Welfare - Other: $257,000 ($14.42)Parking Facilities: $152,000 ($8.53)Judicial and Legal Services: $78,000 ($4.38)General - Interest on Debt: $114,000 ($6.40)
Other Capital Outlay - Police Protection: $208,000 ($11.67)
Sewerage: $160,000 ($8.98)Solid Waste Management: $110,000 ($6.17)Central Staff Services: $106,000 ($5.95)Parks and Recreation: $86,000 ($4.82)Local Fire Protection: $85,000 ($4.77)Regular Highways: $77,000 ($4.32)Protective Inspection and Regulation - Other: $28,000 ($1.57)Public Welfare - Other: $28,000 ($1.57)
Hope Mills government finances - Revenue in 2021 (per resident):
Charges - Miscellaneous Commercial Activities: $1,359,000 ($76.25)
Sewerage: $746,000 ($41.85)Other: $138,000 ($7.74)Parks and Recreation: $96,000 ($5.39)Local Intergovernmental - General Local Government Support: $73,000 ($4.10)
Miscellaneous - Sale of Property: $72,000 ($4.04)
General Revenue - Other: $36,000 ($2.02)Donations From Private Sources: $21,000 ($1.18)Interest Earnings: $1,000 ($0.06)State Intergovernmental - General Local Government Support: $1,020,000 ($57.23)
Highways: $415,000 ($23.28)Tax - Property: $5,739,000 ($321.98)
General Sales and Gross Receipts: $4,538,000 ($254.60)Other License: $634,000 ($35.57)Occupation and Business License - Other: $255,000 ($14.31)
Hope Mills government finances - Debt in 2021 (per resident):
Long Term Debt - Outstanding Unspecified Public Purpose: $17,071,000 ($957.75)
Issue, Unspecified Public Purpose: $14,325,000 ($803.69)Beginning Outstanding - Unspecified Public Purpose: $3,243,000 ($181.95)Retired Unspecified Public Purpose: $497,000 ($27.88)
Hope Mills government finances - Cash and Securities in 2021 (per resident):
Bond Funds - Cash and Securities: $9,178,000 ($514.92)
11.48% of this county's 2021 resident taxpayers lived in other counties in 2020 ($43,575 average adjusted gross income )
Here:
11.48%North Carolina average:
8.85%
0.42% of residents moved from foreign countries ($1,850 average AGI )Cumberland County:
0.42%North Carolina average:
0.04%
Top counties from which taxpayers relocated into this county between 2020 and 2021:
11.82% of this county's 2020 resident taxpayers moved to other counties in 2021 ($48,998 average adjusted gross income )
Here:
11.82%North Carolina average:
7.89%
0.34% of residents moved to foreign countries ($1,708 average AGI )Cumberland County:
0.34%North Carolina average:
0.03%
Top counties to which taxpayers relocated from this county between 2020 and 2021:
Businesses in Hope Mills, NC
Name Count Name Count
AT&T 1 Payless 1 Arby's 1 Pizza Hut 1 AutoZone 1 RadioShack 1 Blockbuster 1 Ryder Rental & Truck Leasing 1 Burger King 1 Subway 3 CVS 2 T-Mobile 2 DHL 1 Taco Bell 1 Domino's Pizza 1 U-Haul 3 FedEx 3 UPS 3 H&R Block 2 Waffle House 1 Holiday Inn 1 Walmart 1 Little Caesars Pizza 1 Wendy's 1 McDonald's 1 YMCA 1 Papa John's Pizza 1
Strongest AM radio stations in Hope Mills:
WFNC (640 AM; 10 kW; FAYETTEVILLE, NC; Owner: CUMULUS LICENSING CORP.)
WIDU (1600 AM; 5 kW; FAYETTEVILLE, NC; Owner: W I D U BROADCASTING, INC.)
WKKE (1080 AM; daytime; 5 kW; ST. PAULS, NC; Owner: FERRIS YARNELL LOCKLEAR)
WPTF (680 AM; 50 kW; RALEIGH, NC; Owner: FIRST STATE COMMUNICATIONS)
WYRU (1160 AM; 5 kW; RED SPRINGS, NC; Owner: WDAS LICENSE LIMITED PARTNERSHIP)
WAZZ (1490 AM; 1 kW; FAYETTEVILLE, NC; Owner: WAZZ LICENSE LIMITED PARTNERSHIP)
WFAY (1230 AM; 1 kW; FAYETTEVILLE, NC; Owner: COLONIAL RADIO GROUP, INC.)
WEEB (990 AM; 10 kW; SOUTHERN PINES, NC; Owner: PINEHURST BROADCASTING CORP.)
WCKB (780 AM; 7 kW; DUNN, NC; Owner: NORTH CAROLINA CENTRAL BROADCASTERS, INC.)
WFTK (1030 AM; daytime; 50 kW; WAKE FOREST, NC; Owner: POSITIVE RADIO GROUP, INC.)
WPYB (1130 AM; daytime; 6 kW; BENSON, NC; Owner: BENSON-DUNN BROADCASTING, INC.)
WTRU (830 AM; 50 kW; KERNERSVILLE, NC; Owner: TRUTH BROADCASTING CORPORATION)
WLLN (1370 AM; 5 kW; LILLINGTON, NC; Owner: ESTUARDO VALDEMAR RODRIGUEZ)
Strongest FM radio stations in Hope Mills:
WQSM (98.1 FM; FAYETTEVILLE, NC; Owner: CUMULUS LICENSING CORP.)
WCCG (104.5 FM; HOPE MILLS, NC; Owner: DR. JAMES E. CARSON)
WKML (95.7 FM; LUMBERTON, NC; Owner: WKML LICENSE LIMITED PARTNERSHIP)
WFLB (96.5 FM; LAURINBURG, NC; Owner: WFLB LICENSE LIMITED PARTNERSHIP)
WFSS (91.9 FM; FAYETTEVILLE, NC; Owner: FAYETTEVILLE STATE UNIVERSITY)
WZFX (99.1 FM; WHITEVILLE, NC; Owner: WDAS LICENSE LIMITED PARTNERSHIP)
WUKS (107.7 FM; ST. PAULS, NC; Owner: WDAS LICENSE LIMITED PARTNERSHIP)
WKQB (106.9 FM; SOUTHERN PINES, NC; Owner: CUMULUS LICENSING CORP)
WEGX (92.9 FM; DILLON, SC; Owner: QANTUM OF FLORENCE LICENSE COMPANY, LLC)
WRCQ (103.5 FM; DUNN, NC; Owner: CUMULUS LICENSING CORP.)
WRAL (101.5 FM; RALEIGH, NC; Owner: WRAL-FM, INC.)
WQDR (94.7 FM; RALEIGH, NC; Owner: CAROLINA MEDIA GROUP, INC.)
WCLN-FM (107.3 FM; CLINTON, NC; Owner: CHRISTIAN LISTENING NETWORK, INC.)
TV broadcast stations around Hope Mills:
WFPX (Channel 62; FAYETTEVILLE, NC; Owner: PAXSON COMMUNICATIONS LICENSE COMPANY, LLC)
W66DF (Channel 66; FAYETTEVILLE, NC; Owner: TRINITY BROADCASTING NETWORK)
W19CA (Channel 19; LUMBERTON, NC; Owner: PACIFIC MEDIA CORPORATION)
WUNU (Channel 31; LUMBERTON, NC; Owner: UNIVERSITY OF NORTH CAROLINA)
WUVC (Channel 40; FAYETTEVILLE, NC; Owner: CAPITAL BROADCASTING PARTNERS)
WECT (Channel 6; WILMINGTON, NC; Owner: RAYCOM AMERICA, INC.)
WTVD (Channel 11; DURHAM, NC; Owner: ABC, INC.)
WRAL-TV (Channel 5; RALEIGH, NC; Owner: CAPITOL BROADCASTING COMPANY, INC.)
WPDE-TV (Channel 15; FLORENCE, SC; Owner: GRAND STRAND COMMUNICATIONS)
WWMB (Channel 21; FLORENCE, SC; Owner: ATLANTIC MEDIA GROUP, INC.)
WBTW (Channel 13; FLORENCE, SC; Owner: MEDIA GENERAL BROADCASTING OF SO. CAROLINA HOLDINGS, INC.)
WLPS-LP (Channel 7; LUMBERTON/PEMBROKE, NC; Owner: BILLY RAY LOCKLEAR)
WRAZ (Channel 50; RALEIGH, NC; Owner: WRAZ-TV, INC.)
WNCN (Channel 17; GOLDSBORO, NC; Owner: OUTLET BROADCASTING, INC.)
W67DU (Channel 67; LUMBERTON, NC; Owner: TRINITY BROADCASTING NETWORK)
WRDC (Channel 28; DURHAM, NC; Owner: RALEIGH (WRDC-TV) LICENSEE, INC.)
WLFL (Channel 22; RALEIGH, NC; Owner: WLFL LICENSEE, LLC)
WSFX-TV (Channel 26; WILMINGTON, NC; Owner: SOUTHEASTERN MEDIA HOLDINGS, INC.)
WPEM-LP (Channel 47; LUMBERTON, NC; Owner: GERALD LOCKLEAR)
WYBE-CA (Channel 44; PINEHURST, NC; Owner: MULTIMEDIA NETWORK OF NC, INC)
National Bridge Inventory (NBI) Statistics 35 Number of bridges410ft / 125m Total length351,810 Total average daily traffic39,689 Total average daily truck traffic
New bridges - historical statistics
1 1940-1949 1 1950-1959 1 1960-1969 3 1970-1979 12 1980-1989 5 1990-1999 6 2000-2009 3 2010-2019 3 2020-2022
See full National Bridge Inventory statistics for Hope Mills, NC
FCC Registered Cell Phone Towers: 2 (
See the full list of FCC Registered Cell Phone Towers in Hope Mills )
FCC Registered Antenna Towers: 91 (
See the full list of FCC Registered Antenna Towers )
FCC Registered Broadcast Land Mobile Towers: 9 (
See the full list of FCC Registered Broadcast Land Mobile Towers in Hope Mills, NC )
FCC Registered Microwave Towers: 4
PINE KNOLL, 3040 N Main St (Lat: 34.979583 Lon: -78.966694), Overall height: 50.3 m, Call Sign: WMW636, Assigned Frequencies: 10633.1 MHz, Grant Date: 03/06/2001, Expiration Date: 02/01/2011, Cancellation Date: 03/14/2008, Certifier: Glenn S Rabin, Registrant: Alltel Communications, LLC, One Allied Drive, B1f02-D, Little Rock, AR 72202, Phone: (501) 905-8555, Fax: (501) 905-6193, Email:
5FA0621D, 2323 John Smith Rd (Lat: 35.005833 Lon: -78.964444), Type: Pole, Structure height: 48.8 m, Call Sign: WQNJ523, Assigned Frequencies: 17800.0 MHz, Grant Date: 02/23/2011, Expiration Date: 02/23/2021, Cancellation Date: 08/06/2012, Certifier: Dan Menser, Registrant: T-Mobile License LLC, 12920 Se 38th Street, Bellevue, WA 98006, Phone: (425) 383-4000, Fax: (425) 383-4040, Email:
5FA0742A, 6341 Cicada St. (Lat: 34.982222 Lon: -79.001389), Type: Pole, Structure height: 51.8 m, Call Sign: WQNJ525, Assigned Frequencies: 19360.0 MHz, Grant Date: 02/23/2011, Expiration Date: 02/23/2021, Cancellation Date: 08/06/2012, Certifier: Dan Menser, Registrant: T-Mobile License LLC, 12920 Se 38th Street, Bellevue, WA 98006, Phone: (425) 383-4000, Fax: (425) 383-4040, Email:
CLFAY00245A, 1821 Cypress Lakes Road (2520403) (Lat: 34.926167 Lon: -78.878611), Type: Mtower, Structure height: 59.4 m, Overall height: 60.6 m, Call Sign: WRXL778, Assigned Frequencies: 19425.0 MHz, 19425.0 MHz, 19425.0 MHz, 19425.0 MHz, 19425.0 MHz, 19425.0 MHz, 19425.0 MHz, 19425.0 MHz, 19425.0 MHz, 19425.0 MHz, 19425.0 MHz, 19425.0 MHz, Grant Date: 05/30/2023, Expiration Date: 05/30/2033, Certifier: Alison A Minea, Registrant: Dish Wireless L.L.C., 9601 S Meridan Blvd, Englewood, CO 80112, Phone: (202) 463-3709, Email:
FCC Registered Amateur Radio Licenses: 122 (
See the full list of FCC Registered Amateur Radio Licenses in Hope Mills )
FAA Registered Aircraft: 12 (
See the full list of FAA Registered Aircraft in Hope Mills )
Home Mortgage Disclosure Act Aggregated Statistics For Year 2009(Based on 15 partial tracts) A) FHA, FSA/RHS & VA B) Conventional C) Refinancings D) Home Improvement Loans E) Loans on Dwellings For 5+ Families F) Non-occupant Loans on G) Loans On Manufactured Number Average Value Number Average Value Number Average Value Number Average Value Number Average Value Number Average Value Number Average Value
LOANS ORIGINATED 129 $172,244 26 $137,969 166 $153,323 9 $54,137 2 $3,643,575 21 $91,576 1 $132,040 APPLICATIONS APPROVED, NOT ACCEPTED 7 $176,203 2 $104,140 12 $149,197 1 $30,330 0 $0 2 $73,660 2 $61,700 APPLICATIONS DENIED 8 $154,758 4 $118,432 63 $138,775 8 $29,920 0 $0 2 $54,885 5 $101,018 APPLICATIONS WITHDRAWN 10 $159,273 2 $122,165 46 $144,126 1 $27,920 0 $0 2 $92,225 2 $86,390 FILES CLOSED FOR INCOMPLETENESS 1 $94,860 0 $0 11 $146,641 0 $0 0 $0 0 $0 0 $0
Aggregated Statistics For Year 2008(Based on 15 partial tracts) A) FHA, FSA/RHS & VA B) Conventional C) Refinancings D) Home Improvement Loans E) Loans on Dwellings For 5+ Families F) Non-occupant Loans on G) Loans On Manufactured Number Average Value Number Average Value Number Average Value Number Average Value Number Average Value Number Average Value Number Average Value
LOANS ORIGINATED 89 $152,380 37 $135,186 85 $124,764 8 $44,035 1 $1,198,190 24 $131,141 4 $183,838 APPLICATIONS APPROVED, NOT ACCEPTED 4 $148,995 5 $115,214 16 $116,066 3 $18,663 0 $0 4 $77,648 3 $70,517 APPLICATIONS DENIED 6 $167,810 4 $111,735 77 $126,330 19 $26,251 1 $323,240 6 $72,122 2 $65,145 APPLICATIONS WITHDRAWN 4 $105,470 3 $113,533 29 $136,461 4 $59,860 0 $0 1 $80,280 0 $0 FILES CLOSED FOR INCOMPLETENESS 1 $176,710 1 $182,990 3 $107,630 1 $214,600 0 $0 1 $57,950 0 $0
Aggregated Statistics For Year 2007(Based on 15 partial tracts) A) FHA, FSA/RHS & VA B) Conventional C) Refinancings D) Home Improvement Loans F) Non-occupant Loans on G) Loans On Manufactured Number Average Value Number Average Value Number Average Value Number Average Value Number Average Value Number Average Value
LOANS ORIGINATED 72 $146,060 88 $120,501 70 $97,056 18 $32,848 22 $84,190 9 $91,269 APPLICATIONS APPROVED, NOT ACCEPTED 4 $174,242 9 $97,070 17 $132,601 5 $24,458 1 $88,180 3 $70,720 APPLICATIONS DENIED 6 $137,092 22 $100,386 90 $112,416 27 $35,125 8 $75,639 3 $73,137 APPLICATIONS WITHDRAWN 3 $164,933 8 $141,128 41 $115,080 2 $29,060 3 $79,613 1 $64,690 FILES CLOSED FOR INCOMPLETENESS 1 $100,760 2 $113,465 5 $104,130 1 $148,630 0 $0 0 $0
Aggregated Statistics For Year 2006(Based on 15 partial tracts) A) FHA, FSA/RHS & VA B) Conventional C) Refinancings D) Home Improvement Loans F) Non-occupant Loans on G) Loans On Manufactured Number Average Value Number Average Value Number Average Value Number Average Value Number Average Value Number Average Value
LOANS ORIGINATED 97 $137,355 124 $96,972 69 $97,773 16 $22,383 31 $75,690 15 $87,849 APPLICATIONS APPROVED, NOT ACCEPTED 3 $115,690 11 $87,895 16 $85,406 4 $25,080 2 $59,125 0 $0 APPLICATIONS DENIED 3 $150,477 19 $95,983 78 $92,883 21 $34,060 11 $79,578 4 $72,985 APPLICATIONS WITHDRAWN 3 $187,410 12 $97,846 43 $88,513 5 $82,276 2 $83,890 0 $0 FILES CLOSED FOR INCOMPLETENESS 1 $97,920 0 $0 12 $109,467 1 $59,320 0 $0 1 $80,340
Aggregated Statistics For Year 2005(Based on 15 partial tracts) A) FHA, FSA/RHS & VA B) Conventional C) Refinancings D) Home Improvement Loans E) Loans on Dwellings For 5+ Families F) Non-occupant Loans on G) Loans On Manufactured Number Average Value Number Average Value Number Average Value Number Average Value Number Average Value Number Average Value Number Average Value
LOANS ORIGINATED 89 $132,913 121 $91,275 78 $86,454 13 $29,747 1 $1,796,510 25 $54,246 20 $83,600 APPLICATIONS APPROVED, NOT ACCEPTED 2 $126,395 12 $86,362 22 $86,565 7 $31,886 0 $0 5 $66,390 2 $69,960 APPLICATIONS DENIED 4 $137,195 34 $66,686 105 $91,156 28 $33,621 0 $0 14 $72,431 11 $52,561 APPLICATIONS WITHDRAWN 2 $115,570 10 $121,262 39 $99,915 7 $94,989 0 $0 6 $113,035 2 $91,335 FILES CLOSED FOR INCOMPLETENESS 2 $163,145 3 $116,743 20 $101,747 1 $49,680 0 $0 1 $97,590 0 $0
Aggregated Statistics For Year 2004(Based on 15 partial tracts) A) FHA, FSA/RHS & VA B) Conventional C) Refinancings D) Home Improvement Loans E) Loans on Dwellings For 5+ Families F) Non-occupant Loans on G) Loans On Manufactured Number Average Value Number Average Value Number Average Value Number Average Value Number Average Value Number Average Value Number Average Value
LOANS ORIGINATED 103 $133,140 100 $99,479 103 $77,640 14 $29,470 1 $4,103,680 34 $74,092 9 $82,847 APPLICATIONS APPROVED, NOT ACCEPTED 1 $183,690 5 $103,324 17 $67,296 5 $17,668 0 $0 3 $71,233 2 $44,840 APPLICATIONS DENIED 5 $98,084 27 $80,159 82 $85,466 16 $24,923 0 $0 8 $64,750 12 $71,332 APPLICATIONS WITHDRAWN 6 $100,688 12 $78,648 38 $88,367 5 $56,450 0 $0 4 $62,238 3 $84,590 FILES CLOSED FOR INCOMPLETENESS 1 $107,690 0 $0 9 $105,848 1 $21,720 0 $0 1 $28,640 0 $0
Aggregated Statistics For Year 2003(Based on 15 partial tracts) A) FHA, FSA/RHS & VA B) Conventional C) Refinancings D) Home Improvement Loans F) Non-occupant Loans on Number Average Value Number Average Value Number Average Value Number Average Value Number Average Value
LOANS ORIGINATED 64 $121,801 65 $89,727 168 $82,381 8 $17,712 34 $79,630 APPLICATIONS APPROVED, NOT ACCEPTED 1 $168,650 17 $73,728 36 $78,483 4 $18,052 8 $51,836 APPLICATIONS DENIED 2 $74,165 43 $63,560 81 $75,165 11 $17,559 10 $61,861 APPLICATIONS WITHDRAWN 9 $128,611 12 $93,739 45 $78,848 2 $14,030 8 $48,742 FILES CLOSED FOR INCOMPLETENESS 0 $0 0 $0 12 $85,148 0 $0 3 $75,143
Aggregated Statistics For Year 2002(Based on 14 partial tracts) A) FHA, FSA/RHS & VA B) Conventional C) Refinancings D) Home Improvement Loans E) Loans on Dwellings For 5+ Families F) Non-occupant Loans on Number Average Value Number Average Value Number Average Value Number Average Value Number Average Value Number Average Value
LOANS ORIGINATED 41 $93,663 51 $71,652 96 $74,105 5 $20,288 1 $326,110 21 $62,756 APPLICATIONS APPROVED, NOT ACCEPTED 2 $124,875 14 $49,406 20 $63,729 5 $13,220 0 $0 4 $48,318 APPLICATIONS DENIED 4 $93,985 38 $51,869 51 $60,515 8 $15,529 0 $0 5 $66,432 APPLICATIONS WITHDRAWN 3 $74,290 2 $118,110 27 $84,918 0 $0 0 $0 2 $62,760 FILES CLOSED FOR INCOMPLETENESS 1 $146,430 5 $86,200 7 $62,810 0 $0 0 $0 2 $44,310
Aggregated Statistics For Year 2001(Based on 14 partial tracts) A) FHA, FSA/RHS & VA B) Conventional C) Refinancings D) Home Improvement Loans F) Non-occupant Loans on Number Average Value Number Average Value Number Average Value Number Average Value Number Average Value
LOANS ORIGINATED 46 $94,271 39 $74,533 114 $80,182 9 $13,957 22 $65,586 APPLICATIONS APPROVED, NOT ACCEPTED 1 $129,100 22 $56,585 11 $51,889 2 $65,140 2 $91,075 APPLICATIONS DENIED 7 $80,627 57 $52,341 48 $56,068 11 $13,495 8 $42,542 APPLICATIONS WITHDRAWN 4 $92,445 5 $61,228 29 $74,130 1 $13,880 1 $66,150 FILES CLOSED FOR INCOMPLETENESS 1 $96,650 2 $48,200 9 $70,299 0 $0 1 $81,560
Aggregated Statistics For Year 2000(Based on 14 partial tracts) A) FHA, FSA/RHS & VA B) Conventional C) Refinancings D) Home Improvement Loans E) Loans on Dwellings For 5+ Families F) Non-occupant Loans on Number Average Value Number Average Value Number Average Value Number Average Value Number Average Value Number Average Value
LOANS ORIGINATED 51 $95,942 38 $68,220 47 $69,647 7 $20,343 1 $40,000 13 $56,175 APPLICATIONS APPROVED, NOT ACCEPTED 4 $46,358 9 $37,642 19 $73,841 7 $25,099 0 $0 3 $107,837 APPLICATIONS DENIED 11 $63,572 35 $54,334 72 $60,919 18 $19,794 0 $0 5 $49,692 APPLICATIONS WITHDRAWN 4 $94,472 5 $83,750 24 $66,905 0 $0 0 $0 0 $0 FILES CLOSED FOR INCOMPLETENESS 2 $119,395 1 $217,370 5 $84,322 0 $0 0 $0 1 $59,110
Aggregated Statistics For Year 1999(Based on 12 partial tracts) A) FHA, FSA/RHS & VA B) Conventional C) Refinancings D) Home Improvement Loans F) Non-occupant Loans on Number Average Value Number Average Value Number Average Value Number Average Value Number Average Value
LOANS ORIGINATED 50 $87,897 45 $59,935 91 $69,877 15 $18,374 15 $42,967 APPLICATIONS APPROVED, NOT ACCEPTED 1 $62,920 19 $42,124 34 $61,546 9 $13,524 6 $47,083 APPLICATIONS DENIED 6 $79,932 50 $49,287 87 $57,424 13 $15,877 7 $54,853 APPLICATIONS WITHDRAWN 4 $87,028 8 $79,921 39 $65,953 2 $29,925 1 $65,820 FILES CLOSED FOR INCOMPLETENESS 1 $44,660 1 $88,780 10 $62,441 1 $10,480 0 $0
Detailed HMDA statistics for the following Tracts:
0016.01
, 0016.02 , 0019.01 , 0030.00 , 0031.00 , 0032.01 , 0032.04
Private Mortgage Insurance Companies Aggregated Statistics For Year 2009(Based on 15 partial tracts) A) Conventional B) Refinancings Number Average Value Number Average Value
LOANS ORIGINATED 4 $95,092 3 $161,273 APPLICATIONS APPROVED, NOT ACCEPTED 0 $0 2 $135,065 APPLICATIONS DENIED 0 $0 0 $0 APPLICATIONS WITHDRAWN 0 $0 0 $0 FILES CLOSED FOR INCOMPLETENESS 0 $0 1 $57,190
Aggregated Statistics For Year 2008(Based on 15 partial tracts) A) Conventional B) Refinancings C) Non-occupant Loans on Number Average Value Number Average Value Number Average Value
LOANS ORIGINATED 16 $123,754 7 $139,994 2 $111,950 APPLICATIONS APPROVED, NOT ACCEPTED 3 $132,387 2 $143,660 0 $0 APPLICATIONS DENIED 1 $176,620 0 $0 0 $0 APPLICATIONS WITHDRAWN 0 $0 0 $0 0 $0 FILES CLOSED FOR INCOMPLETENESS 1 $60,510 0 $0 0 $0
Aggregated Statistics For Year 2007(Based on 15 partial tracts) A) Conventional B) Refinancings C) Non-occupant Loans on Number Average Value Number Average Value Number Average Value
LOANS ORIGINATED 38 $140,471 13 $106,268 6 $112,138 APPLICATIONS APPROVED, NOT ACCEPTED 3 $116,073 1 $141,670 1 $44,330 APPLICATIONS DENIED 1 $197,610 0 $0 0 $0 APPLICATIONS WITHDRAWN 2 $118,690 0 $0 0 $0 FILES CLOSED FOR INCOMPLETENESS 0 $0 0 $0 0 $0
Aggregated Statistics For Year 2006(Based on 15 partial tracts) A) Conventional B) Refinancings C) Non-occupant Loans on Number Average Value Number Average Value Number Average Value
LOANS ORIGINATED 27 $102,544 4 $120,468 7 $62,023 APPLICATIONS APPROVED, NOT ACCEPTED 2 $137,925 1 $83,360 0 $0 APPLICATIONS DENIED 0 $0 0 $0 0 $0 APPLICATIONS WITHDRAWN 0 $0 0 $0 0 $0 FILES CLOSED FOR INCOMPLETENESS 1 $63,930 0 $0 0 $0
Aggregated Statistics For Year 2005(Based on 15 partial tracts) A) Conventional B) Refinancings C) Non-occupant Loans on Number Average Value Number Average Value Number Average Value
LOANS ORIGINATED 29 $116,645 9 $89,223 2 $90,740 APPLICATIONS APPROVED, NOT ACCEPTED 2 $158,710 2 $137,060 1 $123,280 APPLICATIONS DENIED 0 $0 0 $0 0 $0 APPLICATIONS WITHDRAWN 0 $0 0 $0 0 $0 FILES CLOSED FOR INCOMPLETENESS 0 $0 0 $0 0 $0
Aggregated Statistics For Year 2004(Based on 15 partial tracts) A) Conventional B) Refinancings C) Non-occupant Loans on Number Average Value Number Average Value Number Average Value
LOANS ORIGINATED 26 $98,114 8 $76,129 7 $75,671 APPLICATIONS APPROVED, NOT ACCEPTED 2 $108,975 3 $70,433 1 $74,690 APPLICATIONS DENIED 0 $0 0 $0 0 $0 APPLICATIONS WITHDRAWN 0 $0 1 $78,060 0 $0 FILES CLOSED FOR INCOMPLETENESS 0 $0 0 $0 0 $0
Aggregated Statistics For Year 2003(Based on 15 partial tracts) A) Conventional B) Refinancings C) Non-occupant Loans on Number Average Value Number Average Value Number Average Value
LOANS ORIGINATED 17 $91,554 18 $82,048 7 $71,217 APPLICATIONS APPROVED, NOT ACCEPTED 2 $49,615 4 $96,165 2 $43,625 APPLICATIONS DENIED 0 $0 0 $0 0 $0 APPLICATIONS WITHDRAWN 1 $132,930 1 $73,430 0 $0 FILES CLOSED FOR INCOMPLETENESS 0 $0 1 $54,560 0 $0
Aggregated Statistics For Year 2002(Based on 14 partial tracts) A) Conventional B) Refinancings C) Non-occupant Loans on Number Average Value Number Average Value Number Average Value
LOANS ORIGINATED 13 $89,035 16 $84,807 4 $68,965 APPLICATIONS APPROVED, NOT ACCEPTED 1 $71,150 2 $134,650 1 $106,330 APPLICATIONS DENIED 0 $0 0 $0 0 $0 APPLICATIONS WITHDRAWN 1 $73,330 0 $0 0 $0 FILES CLOSED FOR INCOMPLETENESS 0 $0 0 $0 0 $0
Aggregated Statistics For Year 2001(Based on 14 partial tracts) A) Conventional B) Refinancings C) Non-occupant Loans on Number Average Value Number Average Value Number Average Value
LOANS ORIGINATED 7 $114,893 6 $85,777 0 $0 APPLICATIONS APPROVED, NOT ACCEPTED 2 $70,280 2 $103,845 0 $0 APPLICATIONS DENIED 0 $0 1 $53,170 1 $48,870 APPLICATIONS WITHDRAWN 1 $147,070 0 $0 0 $0 FILES CLOSED FOR INCOMPLETENESS 0 $0 0 $0 0 $0
Aggregated Statistics For Year 2000(Based on 14 partial tracts) A) Conventional C) Non-occupant Loans on Number Average Value Number Average Value
LOANS ORIGINATED 6 $97,250 2 $47,120 APPLICATIONS APPROVED, NOT ACCEPTED 1 $93,220 0 $0 APPLICATIONS DENIED 0 $0 0 $0 APPLICATIONS WITHDRAWN 0 $0 0 $0 FILES CLOSED FOR INCOMPLETENESS 0 $0 0 $0
Aggregated Statistics For Year 1999(Based on 12 partial tracts) A) Conventional B) Refinancings C) Non-occupant Loans on Number Average Value Number Average Value Number Average Value
LOANS ORIGINATED 9 $76,913 6 $74,150 1 $27,240 APPLICATIONS APPROVED, NOT ACCEPTED 2 $42,355 0 $0 1 $25,810 APPLICATIONS DENIED 0 $0 0 $0 0 $0 APPLICATIONS WITHDRAWN 0 $0 0 $0 0 $0 FILES CLOSED FOR INCOMPLETENESS 0 $0 0 $0 0 $0
Detailed PMIC statistics for the following Tracts:
0016.01
, 0016.02 , 0019.01 , 0030.00 , 0031.00 , 0032.01 , 0032.04
Most common first names in Hope Mills, NC among deceased individuals Name Count Lived (average)
James 110 66.7 years William 96 69.5 years Mary 83 74.6 years John 74 71.8 years Robert 60 69.7 years Charles 34 68.4 years George 31 69.3 years David 27 66.4 years Willie 26 71.8 years Dorothy 26 68.9 years
Most common last names in Hope Mills, NC among deceased individuals Last name Count Lived (average)
Smith 88 69.1 years Davis 39 70.2 years Williams 36 64.7 years Johnson 31 71.3 years Edwards 28 72.4 years Brown 27 74.5 years Jones 26 72.6 years Jackson 25 71.5 years Taylor 24 71.9 years Canady 21 71.3 years
Hope Mills compared to North Carolina state average:
Median house value below state average. Unemployed percentage significantly below state average. Black race population percentage above state average. Hispanic race population percentage above state average. Median age significantly below state average. Length of stay since moving in significantly above state average. Hope Mills on our top lists :
#45 on the list of "Top 101 cities with largest percentage of males in industries: broadcasting, internet publishing, and telecommunications services (population 5,000+)"
#45 on the list of "Top 101 cities with largest percentage of females in industries: broadcasting, internet publishing, and telecommunications services (population 5,000+)"
#45 on the list of "Top 101 cities with largest percentage of males in industries: wholesale electronic markets and agents and brokers (population 5,000+)"
#45 on the list of "Top 101 cities with largest percentage of females in industries: wholesale electronic markets and agents and brokers (population 5,000+)"
#47 on the list of "Top 101 cities with largest percentage of females in occupations: extraction workers (population 5,000+)"
#78 on the list of "Top 101 cities with the largest positive percentage difference between never married females and males (15+ years) (with at least 1,000 females never married)"
#99 on the list of "Top 101 cities with the highest number of arson incidents per 100,000 residents, excludes tourist destinations and others with a lot of outsiders visiting based on city industries data (population 5,000+)"
#9 on the list of "Top 101 counties with the highest percentage of residents relocating to foreign countries in 2011 (pop. 50,000+)"
#10 on the list of "Top 101 counties with the highest percentage of residents relocating from foreign countries between 2010 and 2011 (pop. 50,000+)"
#12 on the list of "Top 101 counties with the highest number of births per 1000 residents 2007-2013"
#14 on the list of "Top 101 counties with the highest percentage of residents relocating from other counties between 2010 and 2011 (pop. 50,000+)"
#15 on the list of "Top 101 counties with the highest number of infant deaths per 1000 residents 2007-2013 (pop. 50,000+)"
Top Patent Applicants
William D. Cottrell (5)
William W. Andersen (2)
Stephen William Oneufer (2)
Chance Giannelli (2)
Christopher Chanelli (2)
Billy Bain (1)
Christopher Eichler (1)
Chance J. Giannelli (1)
Daniel Christian Ludwigsen (1)
Scott Germain (1)
Total of 24 patent applications in 2008-2024.


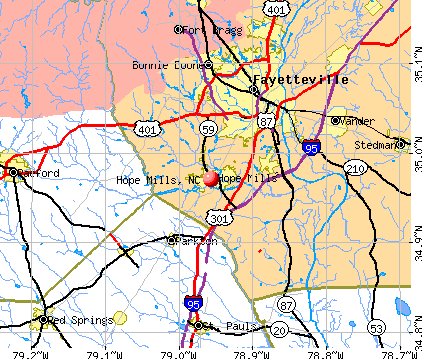


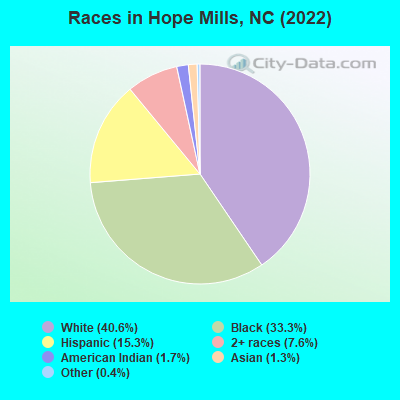
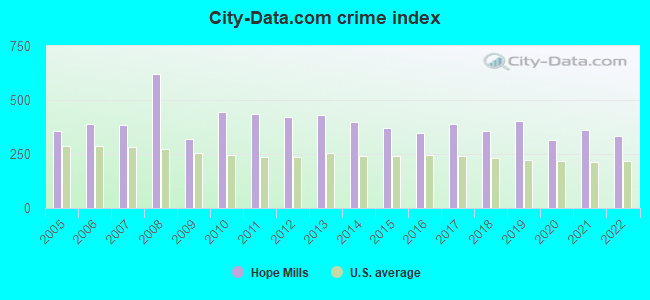
 Recent articles from our blog. Our writers, many of them Ph.D. graduates or candidates, create easy-to-read articles on a wide variety of topics.

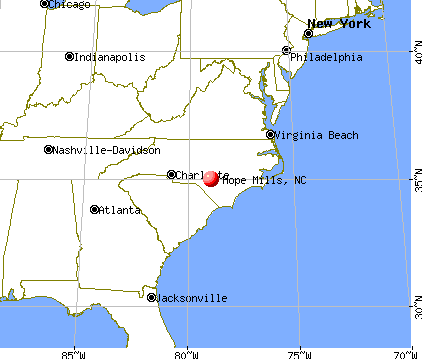
 (7.0 miles
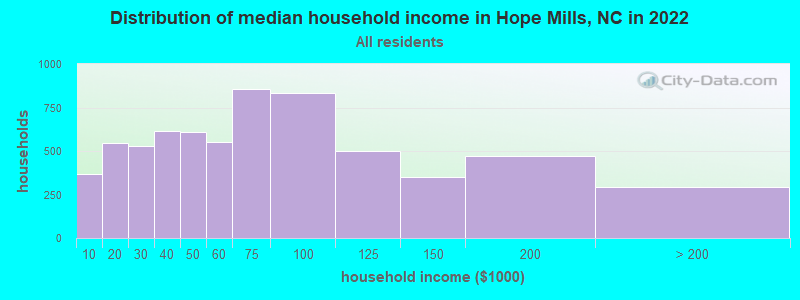
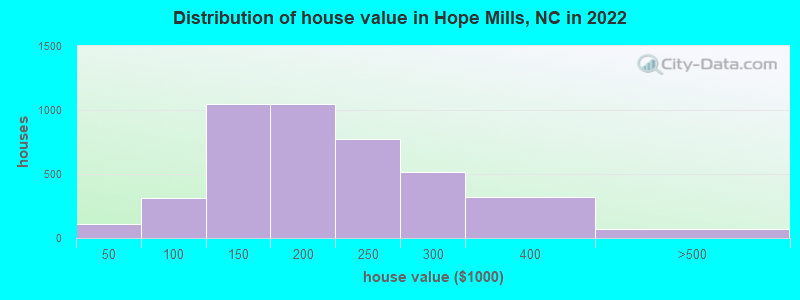

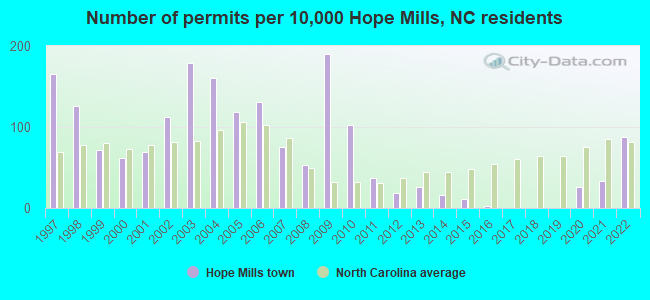
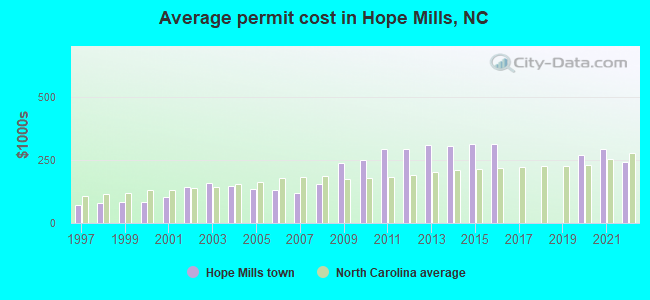
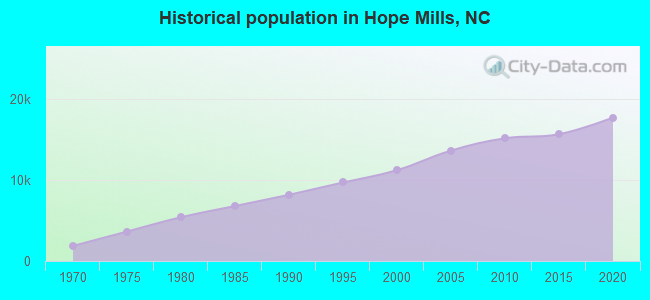
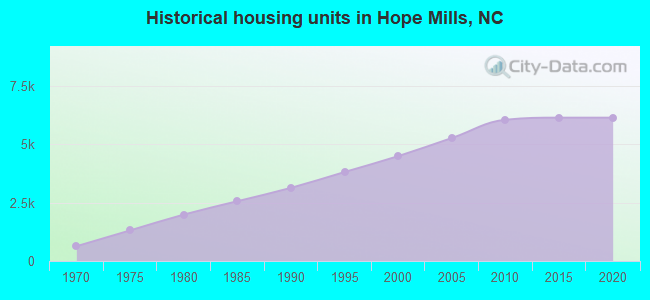
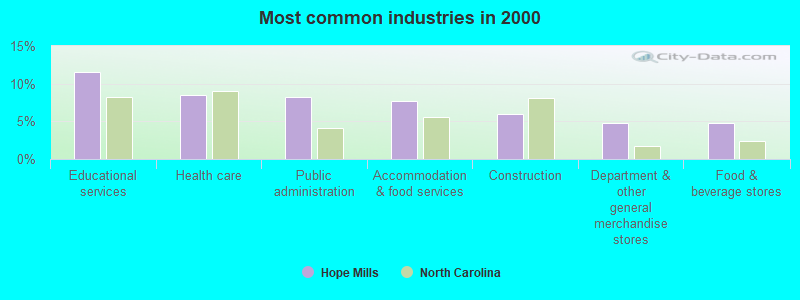
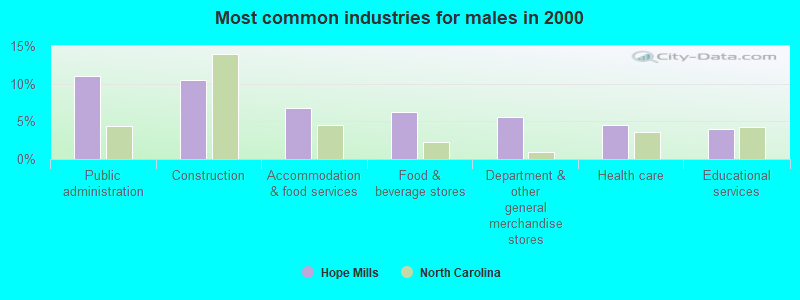
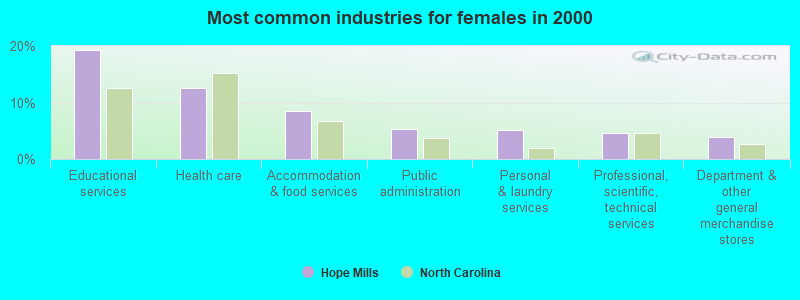
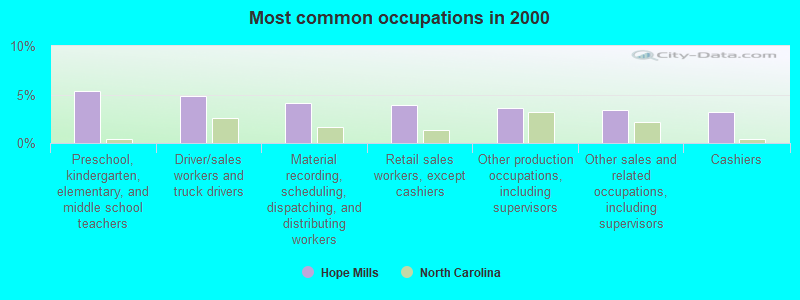
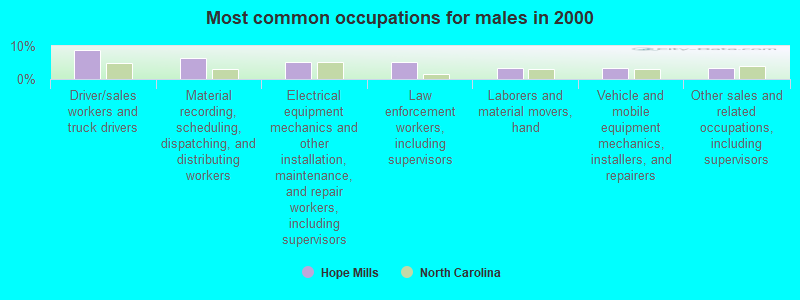
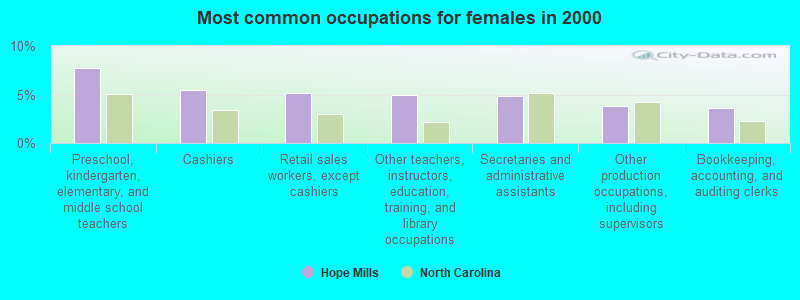


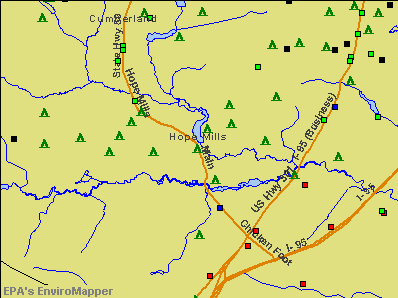

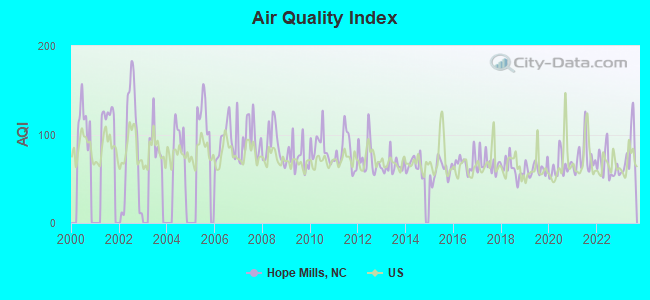
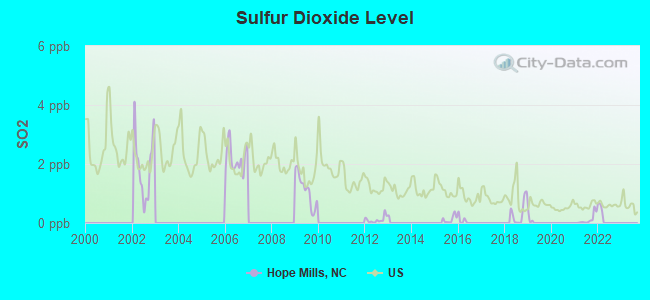
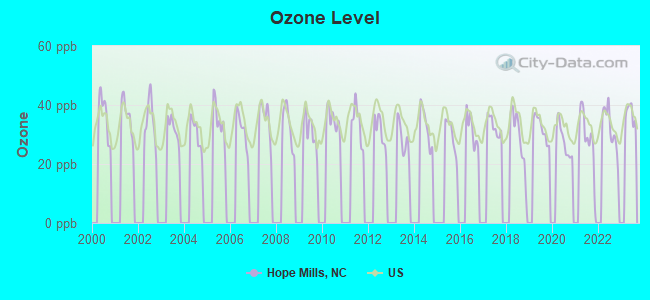
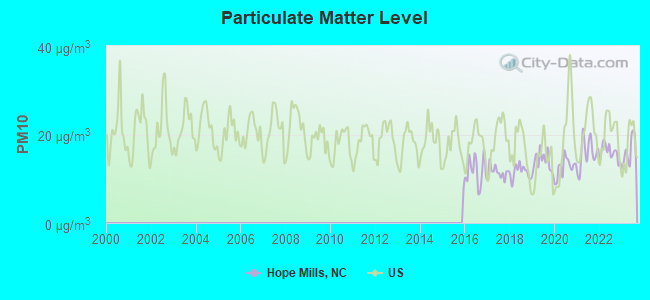
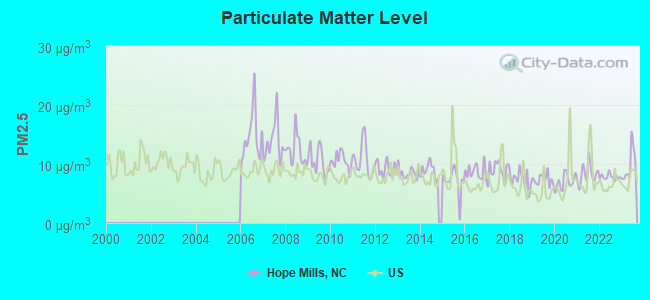
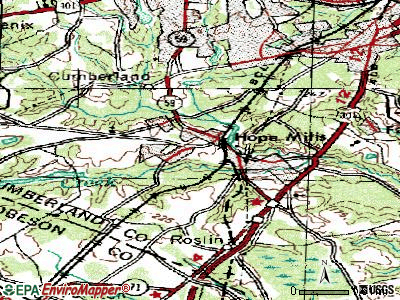
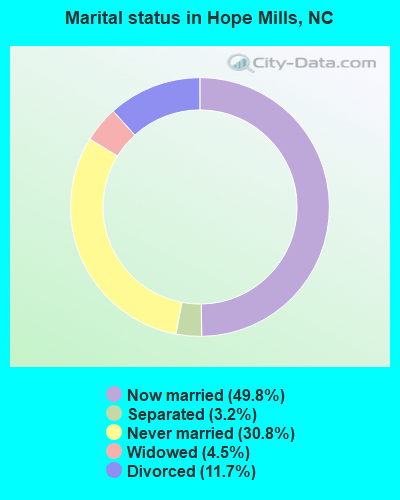
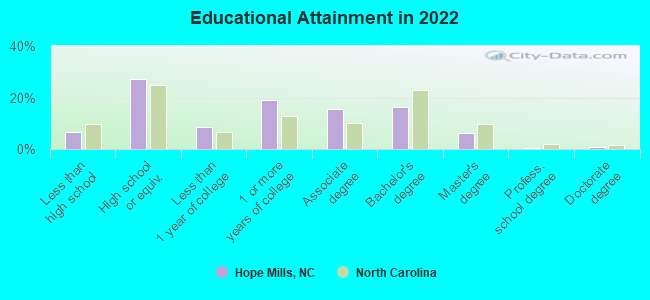
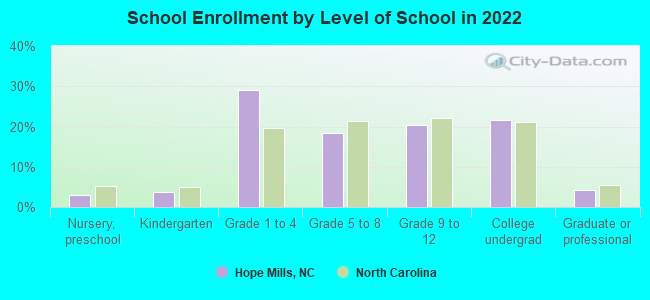
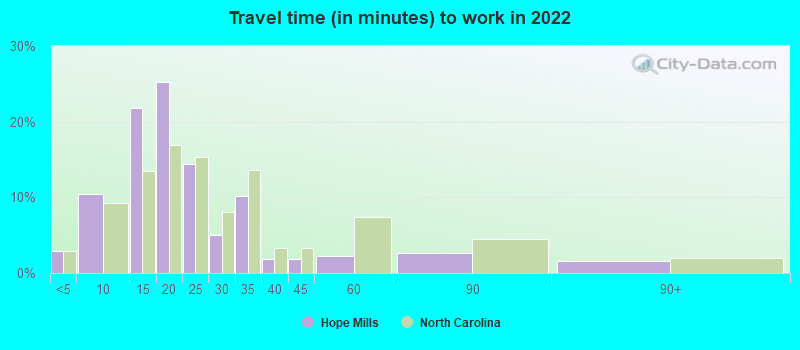
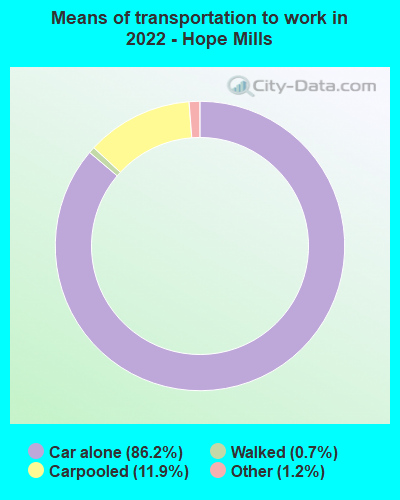
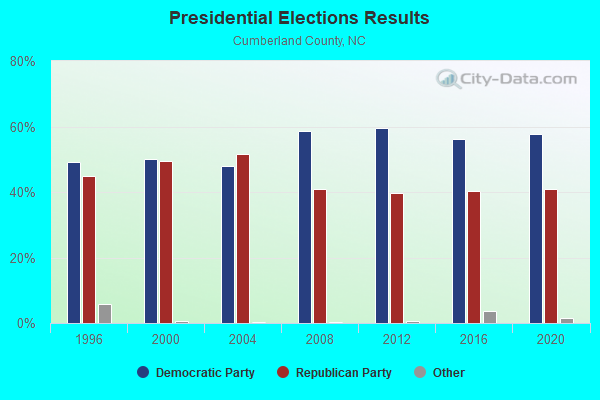
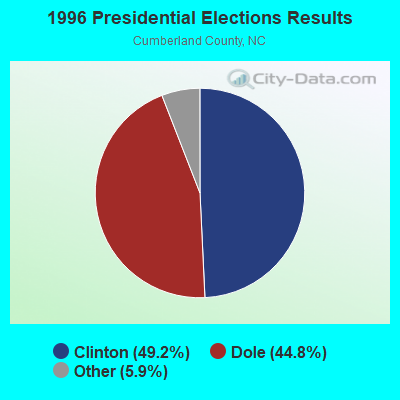
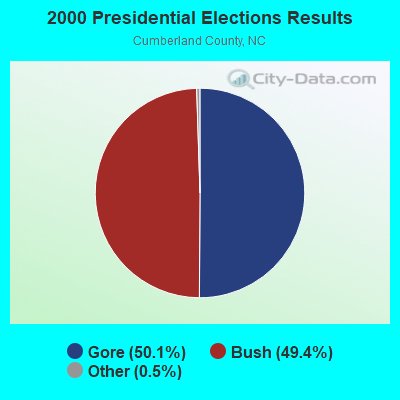
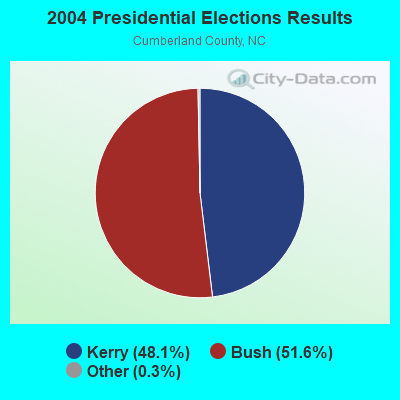
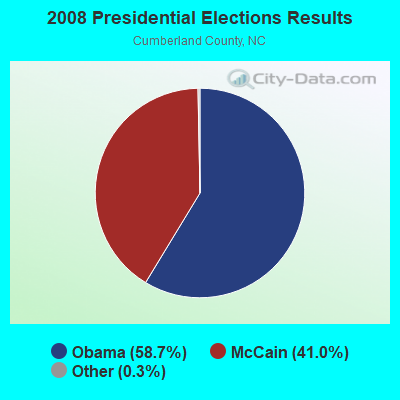
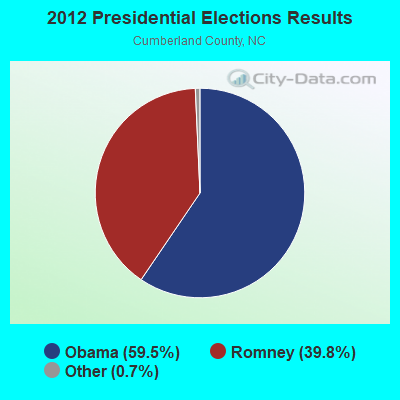
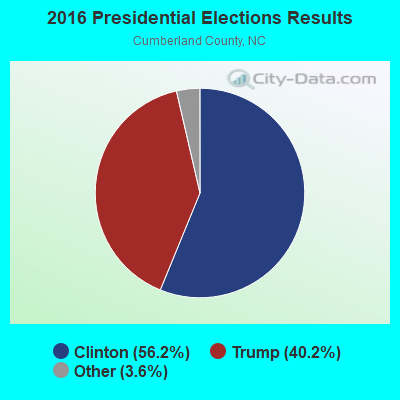
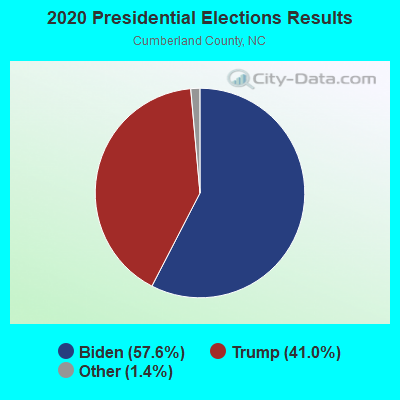
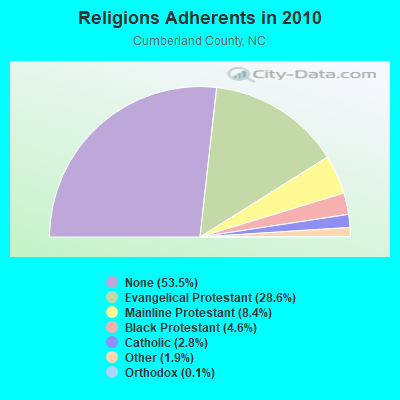
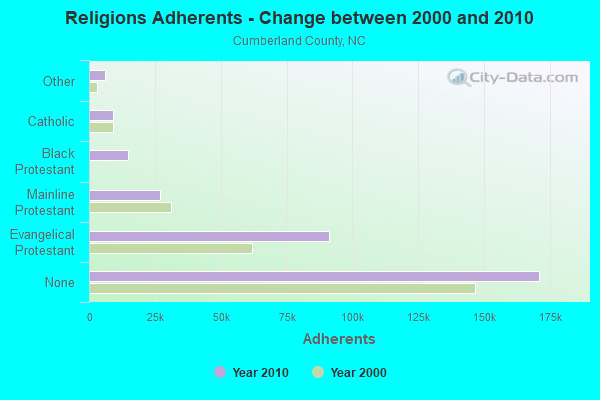
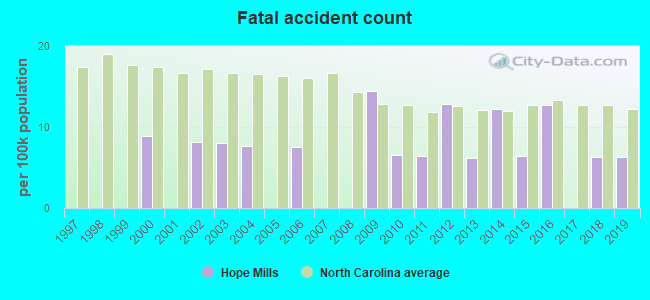
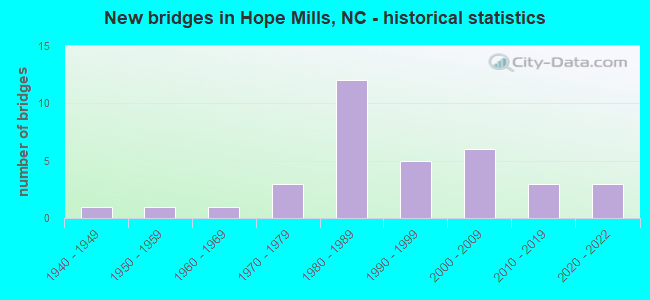
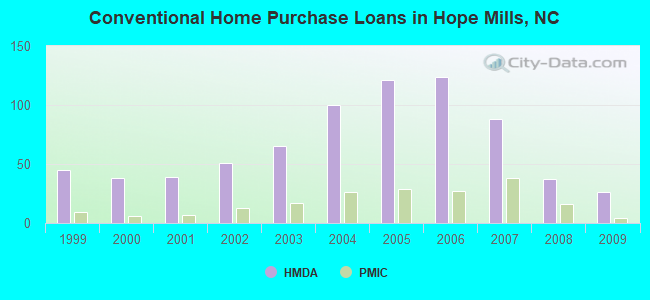
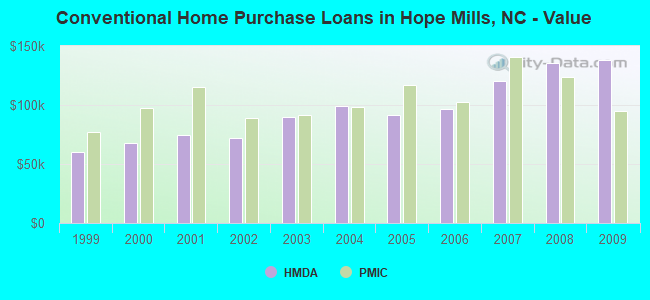
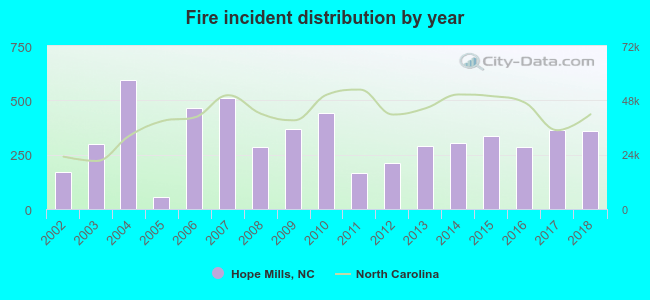 According to the data from the years 2002 - 2018 the average number of fires per year is 324. The highest number of fires - 594 took place in 2004, and the least - 57 in 2005. The data has a rising trend.
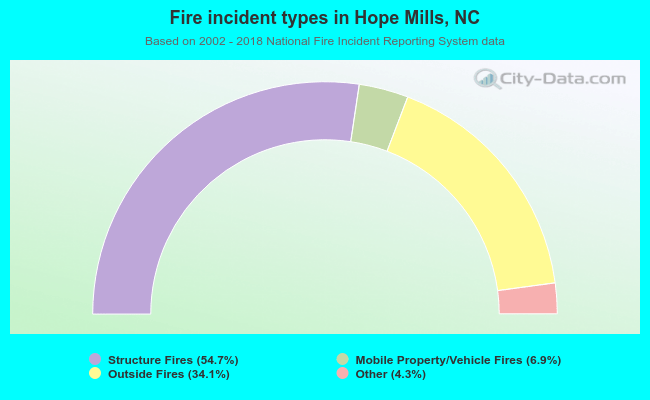 When looking into fire subcategories, the most incidents belonged to: Structure Fires (54.7%), and Outside Fires (34.1%).