East Peoria, Illinois

East Peoria: Murray Baker Bridge From East Peoria
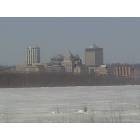
East Peoria: view of downtown peoria from east peoria
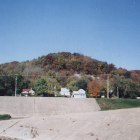
East Peoria: The autumn trees above E Washington St and below FonDuLac Dr
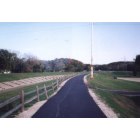
East Peoria: A view of the Bike Trail that runs from downtown East Peoria to Morton (~ 6mi)

East Peoria: McCluggage Bridge viewed from Highview Road
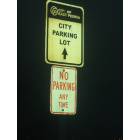
East Peoria: Say what?

East Peoria: East Peoria, IL: Spirit of Peoria float
- add
your
Submit your own pictures of this city and show them to the world
- OSM Map
- General Map
- Google Map
- MSN Map
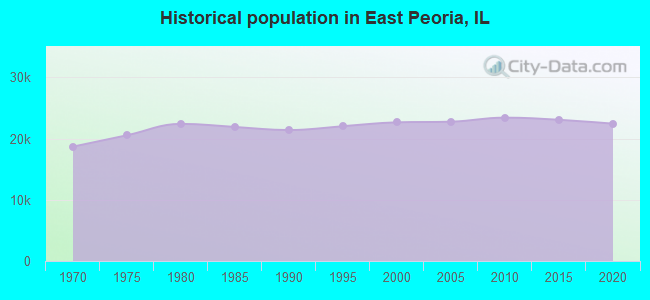
Population change since 2000: -2.2%
 |
| Males: 11,614 | |
| Females: 10,522 |
| Median resident age: | 42.2 years |
| Illinois median age: | 39.1 years |
Zip codes: 61571.
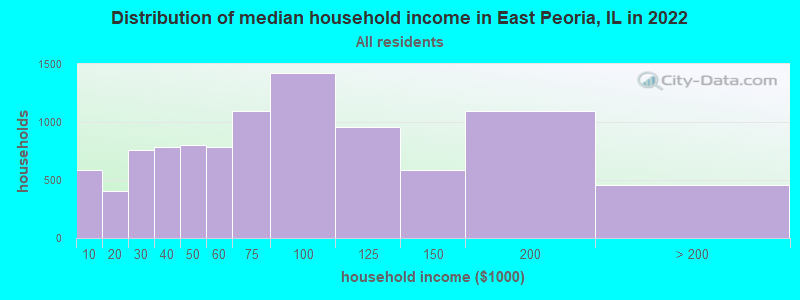
| East Peoria: | $72,064 |
| IL: | $76,708 |
Estimated per capita income in 2022: $38,574 (it was $20,147 in 2000)
East Peoria city income, earnings, and wages data
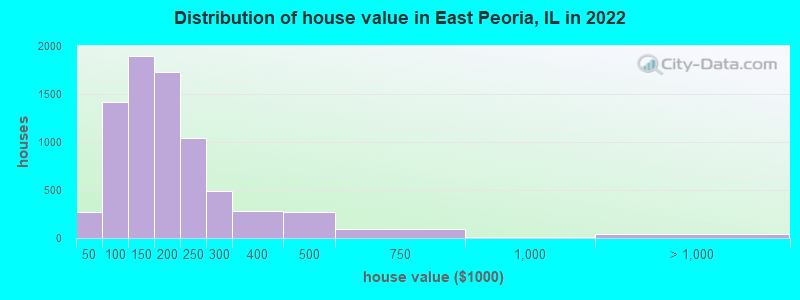
Estimated median house or condo value in 2022: $157,602 (it was $90,000 in 2000)
| East Peoria: | $157,602 |
| IL: | $251,600 |
Mean prices in 2022: all housing units: $196,810; detached houses: $199,437; townhouses or other attached units: $209,576; in 2-unit structures: $135,998; in 3-to-4-unit structures: $453,088; in 5-or-more-unit structures: $233,466; mobile homes: $29,584
Median gross rent in 2022: $867.
(9.6% for White Non-Hispanic residents, 19.1% for Black residents, 1.6% for Hispanic or Latino residents, 100.0% for American Indian residents, 3.9% for two or more races residents)
Detailed information about poverty and poor residents in East Peoria, IL
Compare current foreclosures in East Peoria, IL:
| Photo | Address | Area | Beds / Baths | Price | Details |
|---|---|---|---|---|---|

|
#1
Jim Ct
East Peoria, IL 61611
|
1,788 sq. feet
|
1 baths 3 beds |
show details | |

|
#2
Bloomington Rd
East Peoria, IL 61611
|
980 sq. feet
|
1 baths 3 beds |
show details | |

|
#3
Meadow Ave
East Peoria, IL 61611
|
- sq. feet
|
1 baths 2 beds |
show details | |

|
#4
Sun Valley Ct
East Peoria, IL 61611
|
1,060 sq. feet
|
1 baths 3 beds |
show details | |

|
#5
Roosevelt Cir
East Peoria, IL 61611
|
1,168 sq. feet
|
1 baths 3 beds |
show details | |

|
#6
Highview Ter
East Peoria, IL 61611
|
1,823 sq. feet
|
2 baths 3 beds |
show details | |

|
#7
Springfield Rd
East Peoria, IL 61611
|
1,673 sq. feet
|
2 baths 4 beds |
show details | |

|
#8
Turnron Pl
East Peoria, IL 61611
|
1,369 sq. feet
|
1 baths 4 beds |
show details | |

|
#9
W Illinois St
East Peoria, IL 61611
|
- sq. feet
|
2 baths 3 beds |
show details | |

|
#10
Laurel Ln
East Peoria, IL 61611
|
1,550 sq. feet
|
1 baths 3 beds |
show details |
| Photo | Address | Area | Beds / Baths | Price | Details |
|---|---|---|---|---|---|

|
#11
Glenridge Dr
East Peoria, IL 61611
|
1,674 sq. feet
|
1 baths 3 beds |
show details | |

|
#12
Sun Valley Ct
East Peoria, IL 61611
|
580 sq. feet
|
1 baths 3 beds |
show details | |

|
#13
Park Ave
East Peoria, IL 61611
|
764 sq. feet
|
1 baths 3 beds |
show details | |

|
#14
Sherry Ln
East Peoria, IL 61611
|
1,220 sq. feet
|
1 baths 3 beds |
show details | |

|
#15
Stoneman St
East Peoria, IL 61611
|
1,152 sq. feet
|
1 baths 2 beds |
show details | |

|
#16
Stewart St
East Peoria, IL 61611
|
1,164 sq. feet
|
1 baths 4 beds |
show details | |

|
#17
Crescent Ave
East Peoria, IL 61611
|
1,296 sq. feet
|
1 baths 4 beds |
show details | |

|
#18
Thornton Ct
East Peoria, IL 61611
|
1,624 sq. feet
|
2 baths 3 beds |
show details | |

|
#19
Indian Cir
East Peoria, IL 61611
|
1,874 sq. feet
|
1 baths 3 beds |
show details | |

|
#20
Vonachen Ct
East Peoria, IL 61611
|
1,344 sq. feet
|
1 baths 3 beds |
show details |
| Photo | Address | Area | Beds / Baths | Price | Details |
|---|---|---|---|---|---|

|
#21
Linden Ln
East Peoria, IL 61611
|
1,032 sq. feet
|
1 baths 4 beds |
show details | |

|
#22
Oakwood Rd
East Peoria, IL 61611
|
1,133 sq. feet
|
1 baths 3 beds |
show details | |

|
#23
E Washington St
East Peoria, IL 61611
|
1,248 sq. feet
|
1 baths 2 beds |
show details | |

|
#24
Briar Ct
East Peoria, IL 61611
|
1,244 sq. feet
|
2 baths 3 beds |
show details | |

|
#25
Gardena Ave
East Peoria, IL 61611
|
480 sq. feet
|
1 baths 2 beds |
show details | |

|
#26
Spring St
East Peoria, IL 61611
|
1,350 sq. feet
|
1 baths 4 beds |
show details | |

|
#27
E Washington St
East Peoria, IL 61611
|
1,154 sq. feet
|
1 baths 3 beds |
show details | |

|
#28
Liberty Dr
East Peoria, IL 61611
|
2,084 sq. feet
|
2 baths 3 beds |
show details | |

|
#29
E Ridge Rd
East Peoria, IL 61611
|
1,456 sq. feet
|
1 baths 3 beds |
show details | |

|
#30
Aspen Ct
East Peoria, IL 61611
|
1,418 sq. feet
|
1 baths 3 beds |
show details |
| Photo | Address | Area | Beds / Baths | Price | Details |
|---|---|---|---|---|---|

|
#31
Terrace Ln
East Peoria, IL 61611
|
2,439 sq. feet
|
2 baths 6 beds |
show details | |

|
#32
N Nancy St
East Peoria, IL 61611
|
- sq. feet
|
- baths - beds |
show details | |

|
#33
Keil Ave
East Peoria, IL 61611
|
- sq. feet
|
- baths - beds |
show details | |

|
#34
Springfield Rd
East Peoria, IL 61611
|
- sq. feet
|
- baths - beds |
show details | |

|
#35
Springfield Rd Apt B
East Peoria, IL 61611
|
- sq. feet
|
- baths - beds |
show details | |

|
#36
Patricia Ave Apt B
East Peoria, IL 61611
|
- sq. feet
|
- baths - beds |
show details | |

|
#37
Edmund St
East Peoria, IL 61611
|
- sq. feet
|
- baths - beds |
show details | |

|
#38
Cole St
East Peoria, IL 61611
|
- sq. feet
|
- baths - beds |
show details | |

|
#39
Oakwood Ave
East Peoria, IL 61611
|
- sq. feet
|
- baths - beds |
show details | |

|
#40
E Redbud Dr
East Peoria, IL 61611
|
- sq. feet
|
- baths - beds |
show details |
| Photo | Address | Area | Beds / Baths | Price | Details |
|---|---|---|---|---|---|

|
#41
N Nancy St
East Peoria, IL 61611
|
- sq. feet
|
- baths - beds |
show details | |

|
#42
N Randy Dr
East Peoria, IL 61611
|
- sq. feet
|
- baths - beds |
show details | |

|
Check over 1 million property listings on Foreclosure.com!
|
browse all offers | |||


- 20,43491.6%White alone
- 6813.1%Hispanic
- 5242.3%Asian alone
- 3931.8%Two or more races
- 1750.8%Black alone
- 290.1%Other race alone
- 100.04%American Indian alone
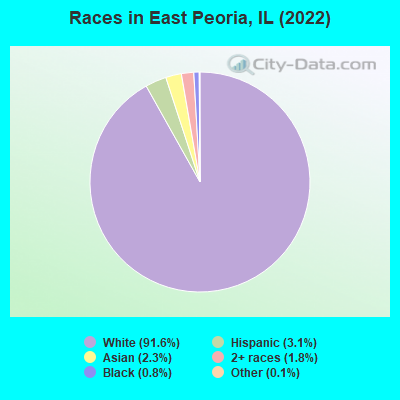
Races in East Peoria detailed stats: ancestries, foreign born residents, place of birth
According to our research of Illinois and other state lists, there were 56 registered sex offenders living in East Peoria, Illinois as of May 23, 2024.
The ratio of all residents to sex offenders in East Peoria is 411 to 1.
Type |
2009 |
2010 |
2011 |
2012 |
2013 |
2014 |
2015 |
2016 |
2017 |
2018 |
2019 |
2020 |
2021 |
2022 |
|---|---|---|---|---|---|---|---|---|---|---|---|---|---|---|
| Murders (per 100,000) | 0 (0.0) | 0 (0.0) | 0 (0.0) | 1 (4.3) | 0 (0.0) | 2 (8.5) | 0 (0.0) | 2 (8.7) | 0 (0.0) | 1 (4.4) | 0 (0.0) | 1 (4.5) | 0 (0.0) | 0 (0.0) |
| Rapes (per 100,000) | 0 (0.0) | 32 (136.7) | 21 (89.5) | 10 (42.6) | 20 (85.3) | 15 (63.8) | 20 (85.6) | 12 (52.2) | 25 (109.4) | 37 (163.4) | 11 (49.0) | 5 (22.3) | 21 (94.4) | 23 (103.9) |
| Robberies (per 100,000) | 9 (39.5) | 9 (38.5) | 5 (21.3) | 8 (34.1) | 6 (25.6) | 10 (42.5) | 4 (17.1) | 5 (21.7) | 10 (43.8) | 8 (35.3) | 5 (22.3) | 0 (0.0) | 4 (18.0) | 9 (40.7) |
| Assaults (per 100,000) | 71 (311.8) | 77 (329.0) | 104 (443.1) | 65 (277.1) | 59 (251.5) | 51 (216.8) | 72 (308.2) | 78 (339.0) | 62 (271.3) | 68 (300.4) | 62 (276.1) | 3 (13.4) | 43 (193.4) | 32 (144.6) |
| Burglaries (per 100,000) | 258 (1,133) | 175 (747.8) | 256 (1,091) | 308 (1,313) | 186 (792.9) | 204 (867.4) | 170 (727.8) | 171 (743.2) | 164 (717.5) | 93 (410.8) | 68 (302.8) | 11 (49.0) | 51 (229.4) | 62 (280.2) |
| Thefts (per 100,000) | 431 (1,893) | 542 (2,316) | 662 (2,820) | 626 (2,668) | 476 (2,029) | 433 (1,841) | 454 (1,944) | 439 (1,908) | 504 (2,205) | 482 (2,129) | 462 (2,058) | 73 (325.2) | 397 (1,785) | 497 (2,246) |
| Auto thefts (per 100,000) | 14 (61.5) | 37 (158.1) | 28 (119.3) | 12 (51.2) | 17 (72.5) | 12 (51.0) | 15 (64.2) | 15 (65.2) | 16 (70.0) | 9 (39.8) | 13 (57.9) | 5 (22.3) | 23 (103.4) | 32 (144.6) |
| Arson (per 100,000) | 2 (8.8) | 7 (29.9) | 6 (25.6) | 11 (46.9) | 3 (12.8) | 7 (29.8) | 2 (8.6) | 9 (39.1) | 2 (8.8) | 0 (0.0) | 2 (8.9) | 0 (0.0) | 0 (0.0) | 1 (4.5) |
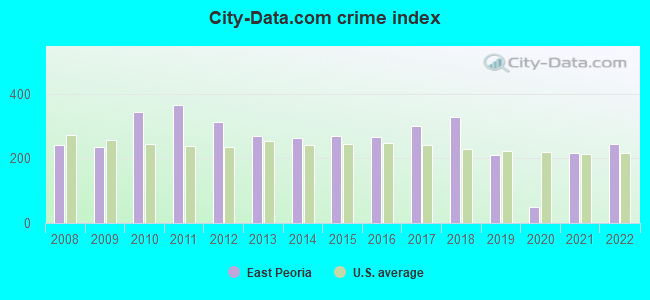
| City-Data.com crime index | 234.2 | 344.4 | 365.3 | 311.0 | 268.7 | 262.6 | 269.1 | 267.0 | 298.9 | 327.3 | 209.2 | 47.6 | 215.4 | 245.3 |
The City-Data.com crime index weighs serious crimes and violent crimes more heavily. Higher means more crime, U.S. average is 246.1. It adjusts for the number of visitors and daily workers commuting into cities.
Crime rate in East Peoria detailed stats: murders, rapes, robberies, assaults, burglaries, thefts, arson
Full-time law enforcement employees in 2021, including police officers: 47 (43 officers - 40 male; 3 female).
| Officers per 1,000 residents here: | 1.93 |
| Illinois average: | 2.84 |
 Recent articles from our blog. Our writers, many of them Ph.D. graduates or candidates, create easy-to-read articles on a wide variety of topics.

 | Washington/Germantown Hills/Chillicothe/Dunlap (5 replies) |
| PEORIA: advice needed (15 replies) |
| Peoria/Chicago—where to live in between? (21 replies) |
| Illinois advice (38 replies) |
| Many people are leaving Illinois (313 replies) |
| Fed up with illinois moving out (588 replies) |
Latest news from East Peoria, IL collected exclusively by city-data.com from local newspapers, TV, and radio stations
Ancestries: German (24.8%), American (17.5%), English (10.0%), European (8.1%), Irish (7.4%), Italian (1.3%).
Current Local Time: CST time zone
Incorporated on 07/29/1889
Elevation: 450 feet
Land area: 18.8 square miles.
Population density: 1,177 people per square mile (low).
458 residents are foreign born (1.3% Asia, 0.3% Europe, 0.3% Latin America).
| This city: | 2.1% |
| Illinois: | 14.1% |
Median real estate property taxes paid for housing units with mortgages in 2022: $3,804 (2.4%)
Median real estate property taxes paid for housing units with no mortgage in 2022: $3,419 (2.2%)
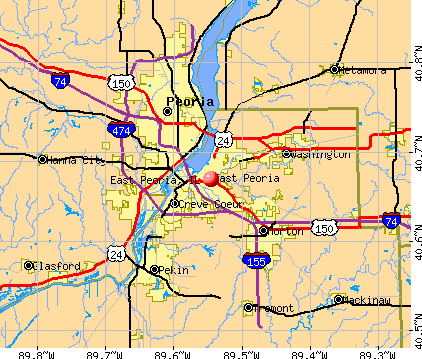
Nearest city with pop. 50,000+: Peoria, IL  (4.9 miles , pop. 112,936).
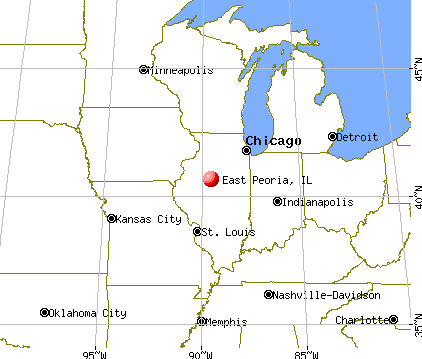
Nearest city with pop. 200,000+: Chicago, IL (126.4 miles , pop. 2,896,016).
Nearest cities:
), Latitude: 40.67 N, Longitude: 89.55 W
Daytime population change due to commuting: +4,101 (+18.4%)
Workers who live and work in this city: 3,068 (28.0%)
Area code commonly used in this area: 309

East Peoria, Illinois accommodation & food services, waste management - Economy and Business Data
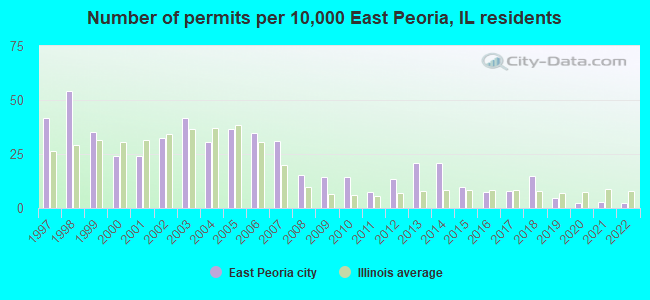
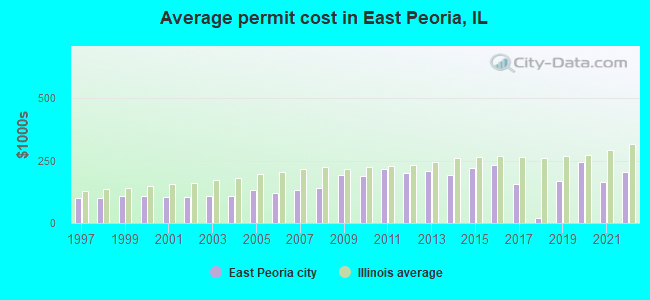
Single-family new house construction building permits:
- 2022: 5 buildings, average cost: $203,800
- 2021: 6 buildings, average cost: $162,500
- 2020: 5 buildings, average cost: $246,000
- 2019: 10 buildings, average cost: $168,000
- 2018: 34 buildings, average cost: $21,500
- 2017: 18 buildings, average cost: $156,000
- 2016: 17 buildings, average cost: $230,700
- 2015: 22 buildings, average cost: $219,500
- 2014: 47 buildings, average cost: $193,300
- 2013: 47 buildings, average cost: $207,500
- 2012: 30 buildings, average cost: $200,400
- 2011: 17 buildings, average cost: $216,400
- 2010: 33 buildings, average cost: $189,300
- 2009: 32 buildings, average cost: $192,600
- 2008: 35 buildings, average cost: $141,000
- 2007: 70 buildings, average cost: $134,100
- 2006: 79 buildings, average cost: $120,000
- 2005: 83 buildings, average cost: $132,100
- 2004: 69 buildings, average cost: $109,500
- 2003: 94 buildings, average cost: $106,700
- 2002: 73 buildings, average cost: $105,100
- 2001: 54 buildings, average cost: $103,800
- 2000: 55 buildings, average cost: $108,500
- 1999: 80 buildings, average cost: $106,800
- 1998: 123 buildings, average cost: $100,500
- 1997: 94 buildings, average cost: $101,100
| Here: | 4.4% |
| Illinois: | 4.2% |
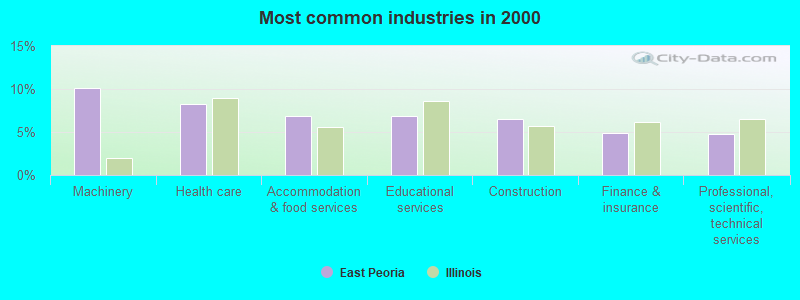
- Machinery (10.2%)
- Health care (8.2%)
- Accommodation & food services (6.9%)
- Educational services (6.9%)
- Construction (6.5%)
- Finance & insurance (4.9%)
- Professional, scientific, technical services (4.8%)
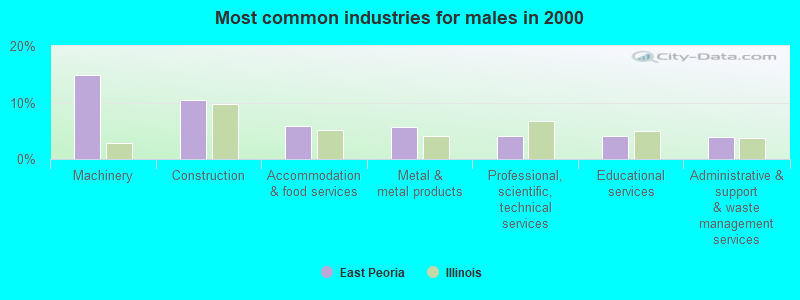
- Machinery (14.9%)
- Construction (10.5%)
- Accommodation & food services (5.9%)
- Metal & metal products (5.6%)
- Professional, scientific, technical services (4.1%)
- Educational services (4.0%)
- Administrative & support & waste management services (4.0%)
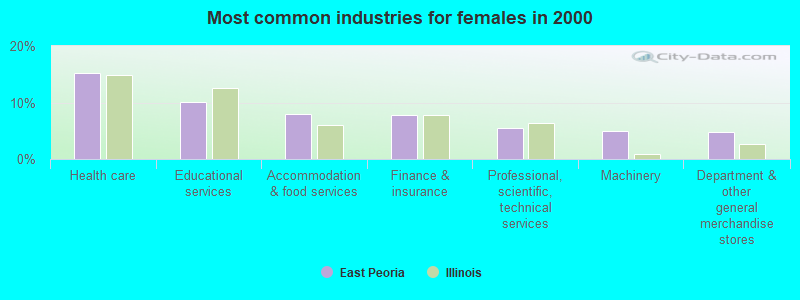
- Health care (15.2%)
- Educational services (10.0%)
- Accommodation & food services (8.0%)
- Finance & insurance (7.8%)
- Professional, scientific, technical services (5.6%)
- Machinery (4.9%)
- Department & other general merchandise stores (4.8%)
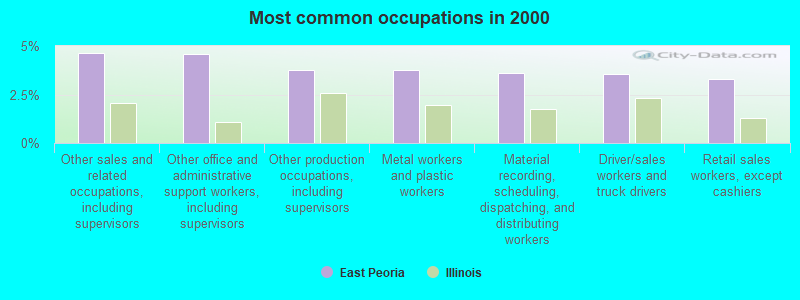
- Other sales and related occupations, including supervisors (4.6%)
- Other office and administrative support workers, including supervisors (4.6%)
- Other production occupations, including supervisors (3.8%)
- Metal workers and plastic workers (3.7%)
- Material recording, scheduling, dispatching, and distributing workers (3.6%)
- Driver/sales workers and truck drivers (3.6%)
- Retail sales workers, except cashiers (3.3%)
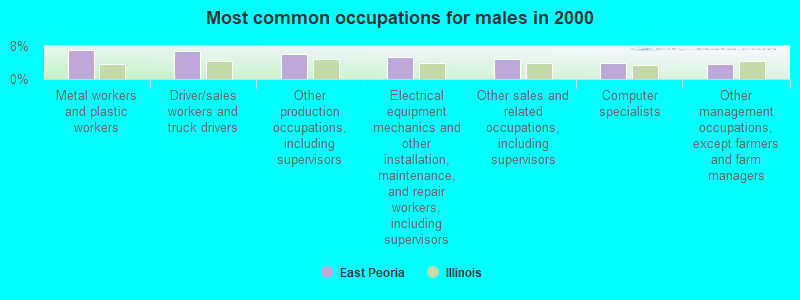
- Metal workers and plastic workers (7.1%)
- Driver/sales workers and truck drivers (6.7%)
- Other production occupations, including supervisors (6.0%)
- Electrical equipment mechanics and other installation, maintenance, and repair workers, including supervisors (5.4%)
- Other sales and related occupations, including supervisors (5.0%)
- Computer specialists (3.9%)
- Other management occupations, except farmers and farm managers (3.7%)

- Other office and administrative support workers, including supervisors (8.1%)
- Secretaries and administrative assistants (6.7%)
- Registered nurses (5.1%)
- Information and record clerks, except customer service representatives (4.9%)
- Retail sales workers, except cashiers (4.9%)
- Preschool, kindergarten, elementary, and middle school teachers (4.5%)
- Other sales and related occupations, including supervisors (4.3%)
Average climate in East Peoria, Illinois
Based on data reported by over 4,000 weather stations


|
|


(lower is better)
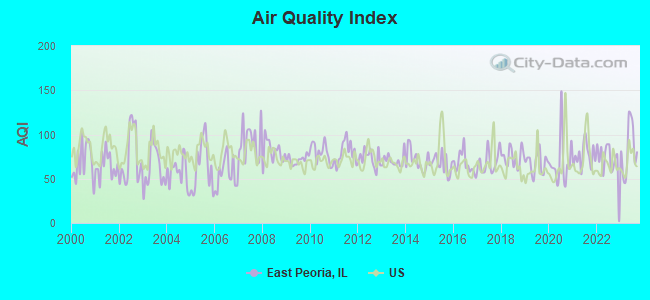
Air Quality Index (AQI) level in 2023 was 83.2. This is about average.
| City: | 83.2 |
| U.S.: | 72.6 |
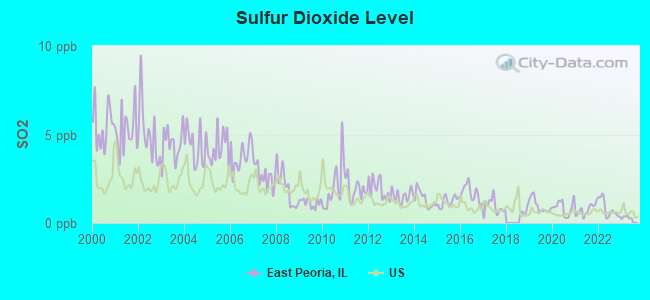
Sulfur Dioxide (SO2) [ppb] level in 2023 was 0.218. This is significantly better than average. Closest monitor was 1.6 miles away from the city center.
| City: | 0.218 |
| U.S.: | 1.515 |
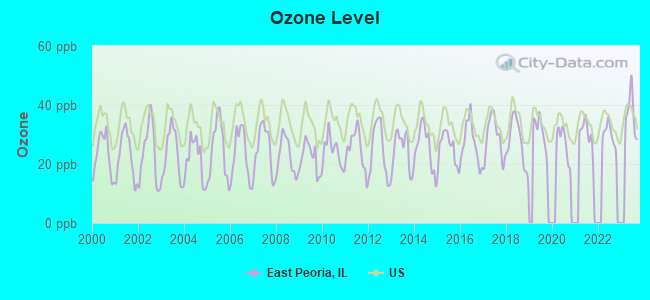
Ozone [ppb] level in 2023 was 36.9. This is about average. Closest monitor was 2.8 miles away from the city center.
| City: | 36.9 |
| U.S.: | 33.3 |
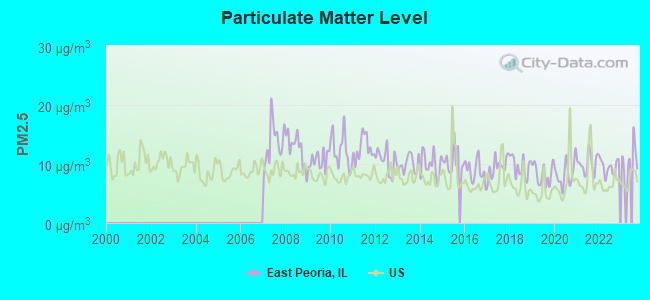
Particulate Matter (PM2.5) [µg/m3] level in 2023 was 11.1. This is worse than average. Closest monitor was 2.8 miles away from the city center.
| City: | 11.1 |
| U.S.: | 8.1 |
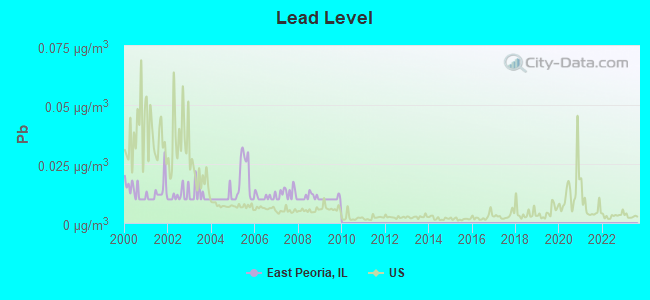
Lead (Pb) [µg/m3] level in 2009 was 0.0102. This is about average. Closest monitor was 1.7 miles away from the city center.
| City: | 0.0102 |
| U.S.: | 0.0093 |
Tornado activity:
East Peoria-area historical tornado activity is slightly above Illinois state average. It is 89% greater than the overall U.S. average.
On 6/29/1976, a category F4 (max. wind speeds 207-260 mph) tornado 12.4 miles away from the East Peoria city center caused between $50,000 and $500,000 in damages.
On 7/13/2004, a category F4 tornado 14.5 miles away from the city center injured 3 people.
Earthquake activity:
East Peoria-area historical earthquake activity is significantly above Illinois state average. It is 132% greater than the overall U.S. average.On 4/18/2008 at 09:36:59, a magnitude 5.4 (5.1 MB, 4.8 MS, 5.4 MW, 5.2 MW, Class: Moderate, Intensity: VI - VII) earthquake occurred 177.0 miles away from East Peoria center
On 6/10/1987 at 23:48:54, a magnitude 5.1 (4.9 MB, 4.4 MS, 4.6 MS, 5.1 LG) earthquake occurred 155.4 miles away from the city center
On 4/18/2008 at 09:36:59, a magnitude 5.2 (5.2 MW, Depth: 8.9 mi) earthquake occurred 177.1 miles away from East Peoria center
On 6/18/2002 at 17:37:15, a magnitude 5.0 (4.3 MB, 4.6 MW, 5.0 LG) earthquake occurred 208.2 miles away from East Peoria center
On 4/18/2008 at 15:14:16, a magnitude 4.8 (4.5 MB, 4.8 MW, 4.6 MW, Class: Light, Intensity: IV - V) earthquake occurred 176.7 miles away from East Peoria center
On 4/3/1974 at 23:05:02, a magnitude 4.7 (4.5 MB, 4.7 LG) earthquake occurred 163.1 miles away from East Peoria center
Magnitude types: regional Lg-wave magnitude (LG), body-wave magnitude (MB), surface-wave magnitude (MS), moment magnitude (MW)
Natural disasters:
The number of natural disasters in Tazewell County (14) is near the US average (15).Major Disasters (Presidential) Declared: 10
Emergencies Declared: 3
Causes of natural disasters: Storms: 10, Floods: 8, Tornadoes: 4, Snows: 2, Winds: 2, Hurricane: 1, Snowstorm: 1, Winter Storm: 1, Other: 1 (Note: some incidents may be assigned to more than one category).

Hospitals and medical centers in East Peoria:
- BRIARBROOK PLACE (228 BRIARBROOK DRIVE)
- HARRIS PLACE (209 HARRIS ROAD)
- EAST PEORIA GARDENS HLTHCR CTR (1910 SPRINGFIELD ROAD)
- FONDULAC REHABILITATION AND HCC (901 ILLINI DRIVE)
- HEARTLAND OF RIVERVIEW (500 CENTENNIAL DRIVE)
- ROSEWOOD CARE CENTER OF EAST PEORIA (900 CENTENNIAL DRIVE)
- AFFILIATED HOME DIALYSIS, LLC (2500 NORTH MAIN ST., SUITE 1A)
- FMC- EAST PEORIA DIALYSIS (3300 NORTH MAIN)
Colleges/Universities in East Peoria:
- Illinois Central College (Full-time enrollment: 7,158; Location: 1 College Drive; Public; Website: www.icc.edu)
- Midwest Technical Institute-East Peoria (Full-time enrollment: 1,148; Location: 280 High Point Ln; Private, for-profit; Website: www.midwesttech.edu)
- Oehrlein School of Cosmetology (Full-time enrollment: 61; Location: 100 Meadow Ave; Private, for-profit; Website: oehrleinschool.com)
Other colleges/universities with over 2000 students near East Peoria:
- Bradley University (about 5 miles; Peoria, IL; Full-time enrollment: 5,152)
- Heartland Community College (about 30 miles; Normal, IL; FT enrollment: 3,958)
- Illinois State University (about 32 miles; Normal, IL; FT enrollment: 18,804)
- Illinois Wesleyan University (about 32 miles; Bloomington, IL; FT enrollment: 2,323)
- Illinois Valley Community College (about 50 miles; Oglesby, IL; FT enrollment: 2,747)
- Western Illinois University (about 62 miles; Macomb, IL; FT enrollment: 10,755)
- Richland Community College (about 65 miles; Decatur, IL; FT enrollment: 2,434)
Public high school in East Peoria:
- EAST PEORIA HIGH SCHOOL (Students: 1,159, Location: 1401 E WASHINGTON ST, Grades: 9-12)
Public elementary/middle schools in East Peoria:
- RIVERVIEW ELEM SCHOOL (Students: 284, Location: 1421 SPRING BAY RD, Grades: PK-8)
- ROBEIN ELEM SCHOOL (Students: 229, Location: 200 CAMPUS AVE, Grades: PK-8)
- DON D SHUTE ELEM SCHOOL (Students: 216, Location: 300 BRIARBROOK DR, Grades: PK-2)
- P L BOLIN ELEM SCHOOL (Students: 203, Location: 428 ARNOLD RD, Grades: 3-5)
- ARMSTRONG-OAKVIEW ELEM SCHOOL (Students: 188, Location: 1848 HIGHVIEW RD, Grades: KG-2)
- WOODROW WILSON ELEM SCHOOL (Students: 187, Location: 300 OAKWOOD AVE, Grades: KG-2)
- GLENDALE ELEM SCHOOL (Students: 187, Location: 1000 BLOOMINGTON RD, Grades: 3-5)
- CENTRAL JR HIGH SCHOOL (Location: 601 TAYLOR ST, Grades: 6-8)
- LINCOLN ELEM SCHOOL (Location: 801 SPRINGFIELD RD, Grades: 3-5)
Library in East Peoria:
- FONDULAC PUBLIC LIBRARY DISTRICT (Operating income: $1,270,331; Location: 140 EAST WASHINGTON STREET; 76,502 books; 7,135 e-books; 1,912 audio materials; 2,759 video materials; 3 local licensed databases; 18 state licensed databases; 1 other licensed databases; 106 print serial subscriptions; 1 electronic serial subscriptions)
Points of interest:
Notable locations in East Peoria: Fondulac Golf Course (A), East Peoria Fire Department Station 3 (B), Caterpillar Tractor Company Y 131 Fire Station (C), Northern Tazewell Fire Protection District Rescue Squad (D), East Peoria Fire Department (E), East Peoria City Hall (F). Display/hide their locations on the map
Churches in East Peoria include: Assembly of God Church (A), Bethel Memorial Church (B), Bethel Temple (C), East Peoria Church of Christ (D), East Peoria Church of the Nazarene (E), East Peoria Community Church (F), East Peoria Mennonite Church (G), Faith United Methodist Church (H), First Baptist Church (I). Display/hide their locations on the map
Cemeteries: Guth Cemetery (1), Fondulac Cemetery (2). Display/hide their locations on the map
Lakes and reservoirs: Peoria Lake (A), Fondulac Reservoir (B). Display/hide their locations on the map
Creeks: Coal Creek (A), Kerfoot Creek (B), Dempsey Creek (C), Farm Creek (D). Display/hide their locations on the map
Parks in East Peoria include: Thomas Park (1), Bennetts Terraqueous Gardens Nature Preserve (2), Cooper Park (3), Fondulac Park (4), Richland Park (5), McGlothlin Farm Park and Petting Zoo (6), East Peoria Pool and Recreation Area (7), Brady Park (8). Display/hide their locations on the map
Tourist attractions: Splashdown Family Waterpark (Water Parks & Slides; 1 Eastside Drive) (1), East Peoria Festival of Lights (2200 East Washington Street) (2). Display/hide their approximate locations on the map
Hotels: Holiday Inn Exp East Peoria (300 Eastlight Court) (1), Hampton Inn East Peoria (11 Winners Way) (2), Hampton Inn (11 Winners Way) (3), Adams Wilson R (3813 East Washington Street) (4), Beacon Motel (3813 East Washington Street) (5). Display/hide their approximate locations on the map
Birthplace of: William Lane Craig - Philosopher, Roger Phegley - Baseball player.
Drinking water stations with addresses in East Peoria and their reported violations in the past:
CATERPILLAR TRAIL PWD (Population served: 4,400, Groundwater):Past monitoring violations:FAIRVIEW (Population served: 450, Purch surface water):
- Monitoring and Reporting (DBP) - Between JUL-2005 and SEP-2005, Contaminant: Chlorine. Follow-up actions: St Compliance achieved (SEP-21-2005), St Public Notif requested (OCT-06-2005), St Violation/Reminder Notice (OCT-06-2005), St Public Notif received (JUN-29-2006)
- One routine major monitoring violation
Past health violations:PEORIA SKEET & TRAP CLUB (Population served: 400, Groundwater):Past monitoring violations:
- MCL, Monthly (TCR) - In SEP-2012, Contaminant: Coliform. Follow-up actions: St Public Notif requested (OCT-16-2012), St Violation/Reminder Notice (OCT-16-2012), St Compliance achieved (OCT-30-2012), St Public Notif received (NOV-15-2012)
- Monitoring and Reporting (DBP) - Between APR-2012 and JUN-2012, Contaminant: Chlorine. Follow-up actions: St Public Notif requested (MAY-15-2012), St Violation/Reminder Notice (MAY-15-2012), St Compliance achieved (MAY-24-2012), St Public Notif received (JUN-21-2012)
- Monitoring and Reporting (DBP) - Between JAN-2012 and MAR-2012, Contaminant: Chlorine. Follow-up actions: St Public Notif requested (APR-18-2012), St Violation/Reminder Notice (APR-18-2012), St Compliance achieved (MAY-24-2012), St Public Notif received (JUN-21-2012)
- Monitoring and Reporting (DBP) - Between OCT-2011 and DEC-2011, Contaminant: Chlorine. Follow-up actions: St Public Notif requested (APR-18-2012), St Violation/Reminder Notice (APR-18-2012), St Compliance achieved (MAY-24-2012), St Public Notif received (JUN-21-2012)
- Monitoring and Reporting (DBP) - Between JUL-2011 and SEP-2011, Contaminant: Chlorine. Follow-up actions: St Violation/Reminder Notice (2 times from APR-18-2012 to APR-18-2012), St Public Notif requested (2 times from APR-18-2012 to APR-18-2012), St Compliance achieved (MAY-24-2012), St Public Notif received (JUN-21-2012)
- Monitoring and Reporting (DBP) - Between JAN-2008 and DEC-2008, Contaminant: Total Haloacetic Acids (HAA5). Follow-up actions: St Public Notif requested (OCT-22-2008), St Violation/Reminder Notice (OCT-22-2008), St Formal NOV issued (DEC-18-2008), St BCA signed (FEB-10-2009), St Public Notif received (MAR-03-2009), St Compliance achieved (JUL-08-2009)
- One other older monitoring violation
Past health violations:DELUXE LAKE ESTATES MHP (Population served: 325, Purch surface water):
- MCL, Monthly (TCR) - Between APR-2010 and JUN-2010, Contaminant: Coliform. Follow-up actions: St Public Notif requested (APR-29-2010), St Compliance achieved (MAY-03-2010)
Past monitoring violations:SPRING BAY AMERICAN LEGION (Population served: 100, Groundwater):
- One routine major monitoring violation
Past monitoring violations:WASTE MANAGEMENT INC/TAZEWELL TRANSFER (Population served: 70, Groundwater):
- One routine major monitoring violation
- One regular monitoring violation
Past monitoring violations:
- One routine major monitoring violation
- 21 regular monitoring violations
Drinking water stations with addresses in East Peoria that have no violations reported:
- EAST PEORIA (Population served: 23,448, Primary Water Source Type: Groundwater)
- ARMINGTON (Population served: 368, Primary Water Source Type: Groundwater)
- ROCK CHURCH (Population served: 50, Primary Water Source Type: Groundwater)
| This city: | 2.3 people |
| Illinois: | 2.6 people |
| This city: | 63.9% |
| Whole state: | 65.8% |
| This city: | 7.2% |
| Whole state: | 6.3% |
Likely homosexual households (counted as self-reported same-sex unmarried-partner households)
- Lesbian couples: 0.3% of all households
- Gay men: 0.3% of all households
People in group quarters in East Peoria in 2010:
- 227 people in nursing facilities/skilled-nursing facilities
- 48 people in group homes intended for adults
- 5 people in military barracks and dormitories (nondisciplinary)
- 2 people in workers' group living quarters and job corps centers
People in group quarters in East Peoria in 2000:
- 265 people in nursing homes
- 57 people in homes for the mentally retarded
- 6 people in military ships
Banks with branches in East Peoria (2011 data):
- Morton Community Bank: Washington Branch, Fondulac Plaza Branch, East Peoria Express Branch. Info updated 2010/12/15: Bank assets: $2,667.0 mil, Deposits: $2,086.4 mil, headquarters in Morton, IL, positive income, Commercial Lending Specialization, 32 total offices, Holding Company: Hometown Community Bancorp, Inc. Esop And Trust
- Regions Bank: Community Branch at 111 West Washington Street, branch established on 1993/11/19. Info updated 2011/02/24: Bank assets: $123,368.2 mil, Deposits: $98,301.3 mil, headquarters in Birmingham, AL, positive income, Commercial Lending Specialization, 1778 total offices, Holding Company: Regions Financial Corporation
- CIBM Bank: East Peoria Branch at 803 West Camp Street, branch established on 1997/10/23. Info updated 2010/08/18: Bank assets: $500.2 mil, Deposits: $431.1 mil, headquarters in Champaign, IL, negative income in the last year, Commercial Lending Specialization, 14 total offices, Holding Company: Cib Marine Bancshares, Inc.
- South Side Trust & Savings Bank of Peoria: East Peoria Branch at 118 Cole Street, branch established on 1998/12/01. Info updated 2006/11/03: Bank assets: $668.3 mil, Deposits: $535.4 mil, headquarters in Peoria, IL, positive income, 14 total offices, Holding Company: Mid Illinois Bancorp, Inc.
- Associated Bank, National Association: East Peoria Branch at 300 East Washington Street, branch established on 1882/01/01. Info updated 2008/09/12: Bank assets: $21,715.0 mil, Deposits: $15,244.4 mil, headquarters in Green Bay, WI, positive income, Commercial Lending Specialization, 282 total offices, Holding Company: Associated Banc-Corp
- Heritage Bank of Central Illinois: East Peoria Branch at 410 N Main Street, branch established on 2007/02/02. Info updated 2006/11/03: Bank assets: $314.6 mil, Deposits: $242.0 mil, headquarters in Trivoli, IL, positive income, Commercial Lending Specialization, 6 total offices, Holding Company: Trivoli Bancorp, Inc.
For population 15 years and over in East Peoria:
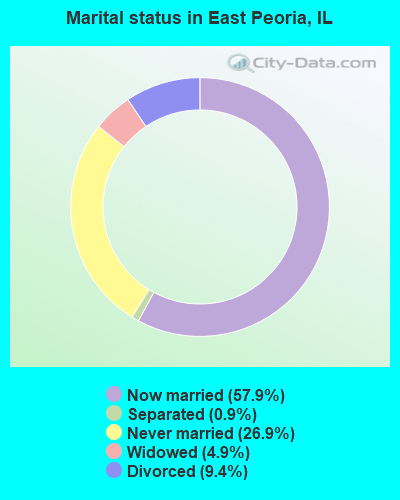
- Never married: 26.9%
- Now married: 57.9%
- Separated: 0.9%
- Widowed: 4.9%
- Divorced: 9.4%
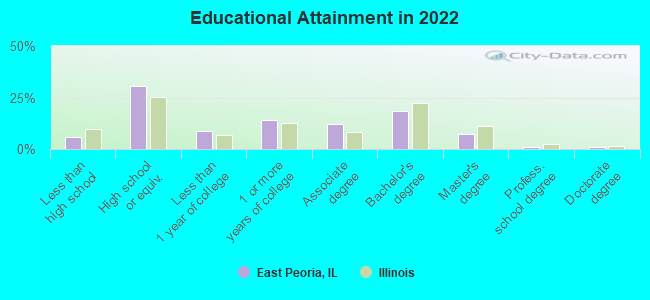
For population 25 years and over in East Peoria:
- High school or higher: 93.6%
- Bachelor's degree or higher: 26.5%
- Graduate or professional degree: 9.1%
- Unemployed: 4.2%
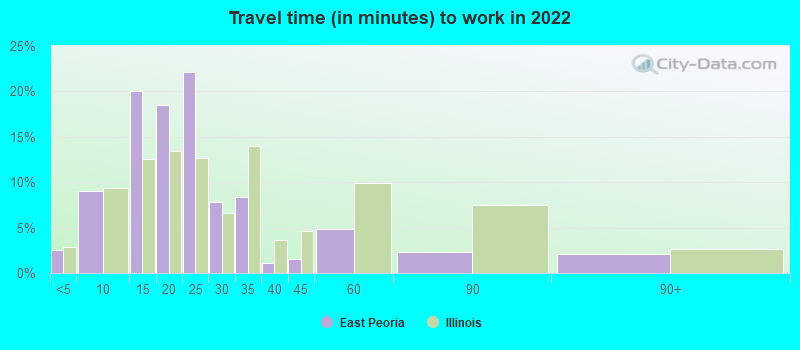
- Mean travel time to work (commute): 18.3 minutes
| Here: | 9.1 |
| Illinois average: | 12.5 |
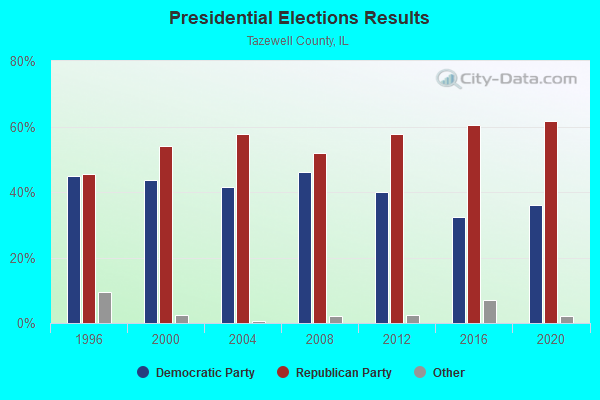
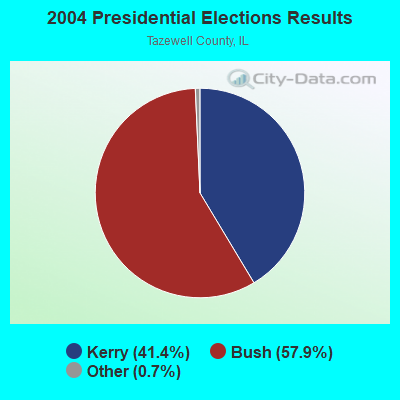
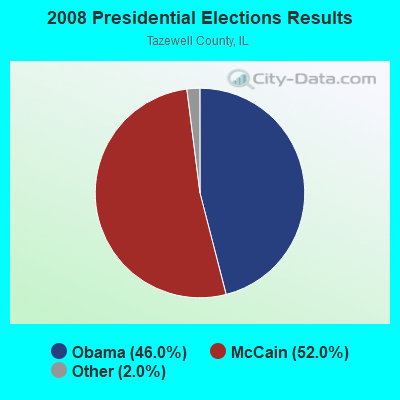
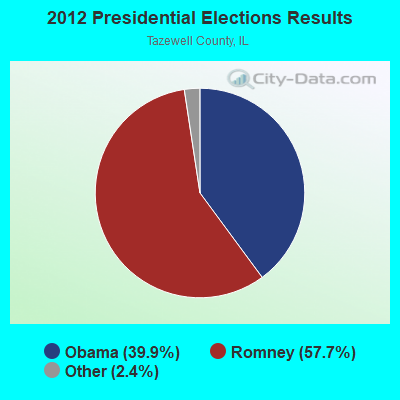

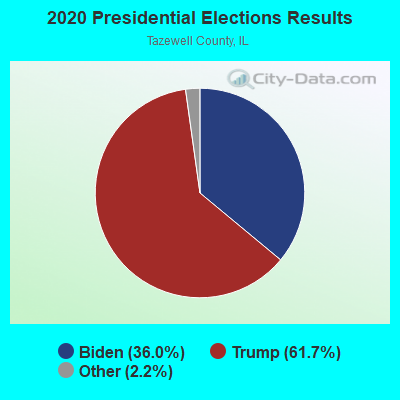
Graphs represent county-level data. Detailed 2008 Election Results
Religion statistics for East Peoria, IL (based on Tazewell County data)
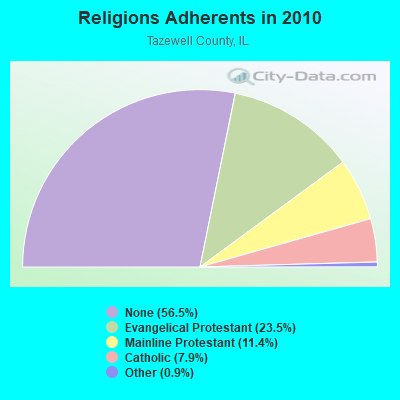
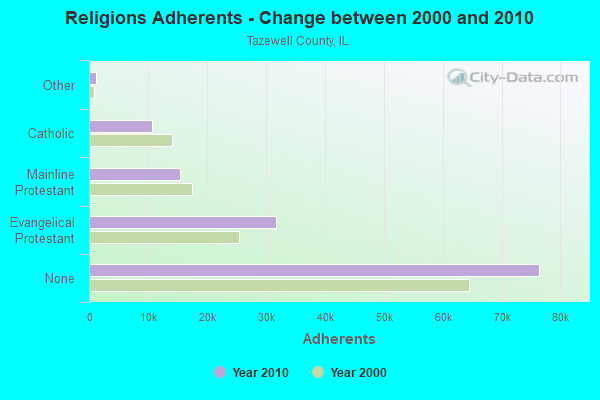
| Religion | Adherents | Congregations |
|---|---|---|
| Evangelical Protestant | 31,756 | 118 |
| Mainline Protestant | 15,404 | 40 |
| Catholic | 10,650 | 7 |
| Other | 1,154 | 6 |
| None | 76,430 | - |
Food Environment Statistics:
| This county: | 0.99 / 10,000 pop. |
| State: | 2.24 / 10,000 pop. |
| Tazewell County: | 0.08 / 10,000 pop. |
| Illinois: | 0.08 / 10,000 pop. |
| This county: | 0.46 / 10,000 pop. |
| Illinois: | 0.75 / 10,000 pop. |
| Tazewell County: | 4.51 / 10,000 pop. |
| Illinois: | 2.61 / 10,000 pop. |
| Here: | 7.72 / 10,000 pop. |
| State: | 6.86 / 10,000 pop. |
| Here: | 8.7% |
| Illinois: | 8.3% |
| This county: | 27.1% |
| Illinois: | 25.2% |
| Here: | 8.2% |
| Illinois: | 14.5% |
Health and Nutrition:
| East Peoria: | 51.5% |
| State: | 49.5% |
| East Peoria: | 49.5% |
| Illinois: | 47.2% |
| Here: | 28.8 |
| Illinois: | 28.6 |
| East Peoria: | 19.2% |
| State: | 20.5% |
| This city: | 9.2% |
| Illinois: | 10.8% |
| East Peoria: | 6.9 |
| Illinois: | 6.8 |
| East Peoria: | 35.4% |
| State: | 33.4% |
| East Peoria: | 58.6% |
| State: | 56.4% |
| East Peoria: | 78.4% |
| State: | 79.9% |
More about Health and Nutrition of East Peoria, IL Residents
| Local government employment and payroll (March 2022) | |||||
| Function | Full-time employees | Monthly full-time payroll | Average yearly full-time wage | Part-time employees | Monthly part-time payroll |
|---|---|---|---|---|---|
| Police Protection - Officers | 47 | $401,817 | $102,592 | 0 | $0 |
| Firefighters | 47 | $336,111 | $85,816 | 0 | $0 |
| Streets and Highways | 15 | $83,798 | $67,038 | 0 | $0 |
| Police - Other | 15 | $81,664 | $65,331 | 0 | $0 |
| Water Supply | 13 | $84,876 | $78,347 | 0 | $0 |
| Sewerage | 12 | $80,922 | $80,922 | 0 | $0 |
| Solid Waste Management | 8 | $49,348 | $74,022 | 0 | $0 |
| Financial Administration | 8 | $34,940 | $52,410 | 0 | $0 |
| Other and Unallocable | 7 | $31,816 | $54,542 | 0 | $0 |
| Parks and Recreation | 6 | $30,445 | $60,890 | 89 | $74,335 |
| Other Government Administration | 3 | $26,552 | $106,208 | 4 | $3,516 |
| Housing and Community Development (Local) | 2 | $9,082 | $54,492 | 0 | $0 |
| Fire - Other | 1 | $4,537 | $54,444 | 0 | $0 |
| Totals for Government | 184 | $1,255,908 | $81,907 | 93 | $77,851 |
East Peoria government finances - Expenditure in 2021 (per resident):
- Construction - Water Utilities: $20,219,000 ($913.40)
General - Other: $2,111,000 ($95.37)
Central Staff Services: $402,000 ($18.16)
- Current Operations - General - Other: $8,115,000 ($366.60)
Police Protection: $7,914,000 ($357.52)
Local Fire Protection: $7,062,000 ($319.03)
Central Staff Services: $6,037,000 ($272.72)
Regular Highways: $3,185,000 ($143.88)
Water Utilities: $2,445,000 ($110.45)
Parks and Recreation: $1,057,000 ($47.75)
Solid Waste Management: $843,000 ($38.08)
- General - Interest on Debt: $2,876,000 ($129.92)
- Other Capital Outlay - Central Staff Services: $1,067,000 ($48.20)
Water Utilities: $815,000 ($36.82)
Police Protection: $167,000 ($7.54)
Local Fire Protection: $107,000 ($4.83)
Regular Highways: $77,000 ($3.48)
- Total Salaries and Wages: $11,870,000 ($536.23)
East Peoria government finances - Revenue in 2021 (per resident):
- Charges - Sewerage: $5,175,000 ($233.78)
Other: $4,615,000 ($208.48)
- Miscellaneous - General Revenue - Other: $4,158,000 ($187.84)
Fines and Forfeits: $172,000 ($7.77)
Interest Earnings: $61,000 ($2.76)
- Revenue - Water Utilities: $3,320,000 ($149.98)
- State Intergovernmental - General Local Government Support: $17,880,000 ($807.73)
Highways: $2,987,000 ($134.94)
Transit Utilities: $1,649,000 ($74.49)
Other: $171,000 ($7.72)
- Tax - Property: $11,710,000 ($529.00)
Other Selective Sales: $9,849,000 ($444.93)
Public Utilities Sales: $414,000 ($18.70)
Other License: $263,000 ($11.88)
East Peoria government finances - Debt in 2021 (per resident):
- Long Term Debt - Beginning Outstanding - Unspecified Public Purpose: $73,126,000 ($3303.49)
Outstanding Unspecified Public Purpose: $66,930,000 ($3023.58)
Beginning Outstanding - Public Debt for Private Purpose: $16,505,000 ($745.62)
Outstanding Nonguaranteed - Industrial Revenue: $16,315,000 ($737.03)
Retired Unspecified Public Purpose: $6,196,000 ($279.91)
Retired Nonguaranteed - Public Debt for Private Purpose: $190,000 ($8.58)
East Peoria government finances - Cash and Securities in 2021 (per resident):
- Other Funds - Cash and Securities: $31,792,000 ($1436.21)
- Sinking Funds - Cash and Securities: $16,315,000 ($737.03)
| Businesses in East Peoria, IL | ||||
| Name | Count | Name | Count | |
|---|---|---|---|---|
| ALDI | 1 | Motel 6 | 1 | |
| Ace Hardware | 1 | Nike | 1 | |
| Advance Auto Parts | 1 | OfficeMax | 1 | |
| Applebee's | 1 | Panera Bread | 1 | |
| Arby's | 1 | Papa John's Pizza | 1 | |
| Burger King | 1 | Penske | 1 | |
| CVS | 2 | PetSmart | 1 | |
| Circle K | 1 | Pizza Hut | 1 | |
| Curves | 1 | Qdoba Mexican Grill | 1 | |
| Fashion Bug | 1 | Quiznos | 1 | |
| FedEx | 4 | SONIC Drive-In | 1 | |
| Ford | 1 | Sprint Nextel | 1 | |
| Goodwill | 1 | Steak 'n Shake | 1 | |
| H&R Block | 2 | Subaru | 1 | |
| Hardee's | 1 | Subway | 3 | |
| Hilton | 1 | Super 8 | 1 | |
| Holiday Inn | 1 | T-Mobile | 2 | |
| IHOP | 1 | T.G.I. Driday's | 1 | |
| Jimmy John's | 1 | Taco Bell | 1 | |
| Kohl's | 1 | True Value | 1 | |
| Kroger | 1 | U-Haul | 2 | |
| La-Z-Boy | 1 | U.S. Cellular | 2 | |
| Long John Silver's | 1 | UPS | 4 | |
| Lowe's | 1 | Verizon Wireless | 1 | |
| Marriott | 1 | Walgreens | 1 | |
| McDonald's | 1 | Walmart | 1 | |
Strongest AM radio stations in East Peoria:
- WWFS (1290 AM; 5 kW; PEORIA, IL; Owner: MONTEREY LICENSES, LLC)
- WPEO (1020 AM; daytime; 1 kW; PEORIA, IL)
- WVEL (1140 AM; daytime; 5 kW; PEKIN, IL)
- WMBD (1470 AM; 5 kW; PEORIA, IL; Owner: MONTEREY LICENSES, LLC)
- WOAM (1350 AM; 1 kW; PEORIA, IL; Owner: KELLY COMMUNICATIONS, INC.)
- WSCR (670 AM; 50 kW; CHICAGO, IL; Owner: INFINITY BROADCASTING OPERATIONS, INC.)
- WLS (890 AM; 50 kW; CHICAGO, IL; Owner: WLS, INC.)
- WGN (720 AM; 50 kW; CHICAGO, IL; Owner: WGN CONTINENTAL BROADCASTING CO.)
- WBBM (780 AM; 50 kW; CHICAGO, IL; Owner: INFINITY BROADCASTING OPERATIONS, INC.)
- WYLL (1160 AM; 50 kW; CHICAGO, IL; Owner: SCA LICENSE CORPORATION)
- WMVP (1000 AM; 50 kW; CHICAGO, IL; Owner: ABC, INC.)
- WTMJ (620 AM; 50 kW; MILWAUKEE, WI; Owner: JOURNAL BROADCAST CORPORATION)
- KXEN (1010 AM; 50 kW; FESTUS-ST. LOUIS, MO; Owner: BDJ RADIO ENTERPRISES, LLC)
Strongest FM radio stations in East Peoria:
- WXMP (105.7 FM; PEORIA, IL; Owner: AAA ENTERTAINMENT LICENSING LLC)
- WBNH (88.5 FM; PEKIN, IL; Owner: CENTRAL ILLINOIS RADIO FELLOWSHIP, INC.)
- WPBG (93.3 FM; PEORIA, IL; Owner: MONTEREY LICENSES, LLC)
- WXCL (104.9 FM; PEKIN, IL; Owner: AAA ENTERTAINMENT LICENSING LLC)
- WCBU (89.9 FM; PEORIA, IL; Owner: BRADLEY UNIVERSITY)
- WGLO (95.5 FM; PEKIN, IL; Owner: REGENT BROADCASTING OF PEORIA, INC.)
- WSWT (106.9 FM; PEORIA, IL; Owner: MONTEREY LICENSES, LLC)
- W278AE (103.5 FM; PEORIA, IL; Owner: ILLINOIS STATE UNIVERSITY)
- WIXO (99.9 FM; BARTONVILLE, IL; Owner: REGENT BROADCASTING OF PEORIA, INC.)
- WCIC (91.5 FM; PEKIN, IL; Owner: ILLINOIS BIBLE INSTITUTE, INC.)
- WDQX (102.3 FM; MORTON, IL; Owner: AAA ENTERTAINMENT LICENSING LLC)
- WPPY (101.1 FM; GLASFORD, IL; Owner: REGENT BROADCASTING OF PEORIA, INC.)
- WZPW (92.3 FM; PEORIA, IL; Owner: B&G BROADCASTING, INC.)
- WPMJ (94.3 FM; CHILLICOTHE, IL; Owner: KELLY COMMUNICATIONS, INC.)
- WFYR (97.3 FM; ELMWOOD, IL; Owner: REGENT BROADCASTING OF PEORIA, INC.)
- WRVP (98.5 FM; EUREKA, IL; Owner: REGENT BROADCASTING OF PEORIA, INC.)
- WWCT (96.5 FM; FARMINGTON, IL; Owner: AAA ENTERTAINMENT LICENSING LLC)
TV broadcast stations around East Peoria:
- WHOI (Channel 19; PEORIA, IL; Owner: CHELSEY BROADCASTING COMPANY OF PEORIA, LLC)
- WMBD-TV (Channel 31; PEORIA, IL; Owner: NEXSTAR BROADCASTING OF PEORIA, L.L.C.)
- WEEK-TV (Channel 25; PEORIA, IL; Owner: WEEK-TV LICENSE, INC.)
- WTVP (Channel 47; PEORIA, IL; Owner: ILLINOIS VALLEY PUB TELECOMM CORP)
- WAOE (Channel 59; PEORIA, IL; Owner: FOUR SEASONS PEORIA, LLC)
- W67CW (Channel 67; PEORIA, IL; Owner: M.C. PRODUCTIONS)
- W41BO (Channel 41; PEORIA, IL; Owner: TRINITY BROADCASTING NETWORK)
- WYZZ-TV (Channel 43; BLOOMINGTON, IL; Owner: WYZZ LICENSEE, INC.)
- National Bridge Inventory (NBI) Statistics
- 111Number of bridges
- 1,686ft / 514mTotal length
- $7,384,000Total costs
- 1,444,575Total average daily traffic
- 118,083Total average daily truck traffic
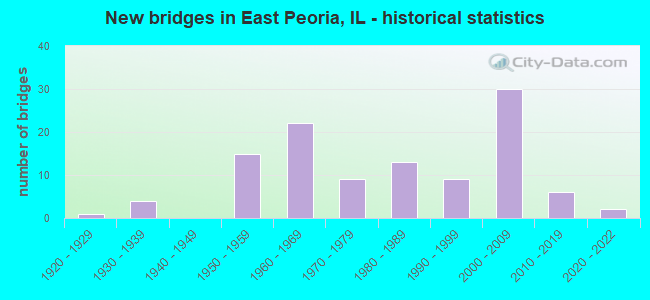
- New bridges - historical statistics
- 11920-1929
- 41930-1939
- 151950-1959
- 221960-1969
- 91970-1979
- 131980-1989
- 91990-1999
- 302000-2009
- 62010-2019
- 22020-2022
FCC Registered Commercial Land Mobile Towers: 2 (See the full list of FCC Registered Commercial Land Mobile Towers in East Peoria, IL)
FCC Registered Private Land Mobile Towers: 7 (See the full list of FCC Registered Private Land Mobile Towers)
FCC Registered Broadcast Land Mobile Towers: 27 (See the full list of FCC Registered Broadcast Land Mobile Towers)
FCC Registered Microwave Towers: 47 (See the full list of FCC Registered Microwave Towers in this town)
FCC Registered Paging Towers: 2 (See the full list of FCC Registered Paging Towers)
FCC Registered Maritime Coast & Aviation Ground Towers: 1 (See the full list of FCC Registered Maritime Coast & Aviation Ground Towers)
FCC Registered Amateur Radio Licenses: 123 (See the full list of FCC Registered Amateur Radio Licenses in East Peoria)
FAA Registered Aircraft Manufacturers and Dealers: 1 (See the full list of FAA Registered Manufacturers and Dealers in East Peoria)
FAA Registered Aircraft: 12 (See the full list of FAA Registered Aircraft)
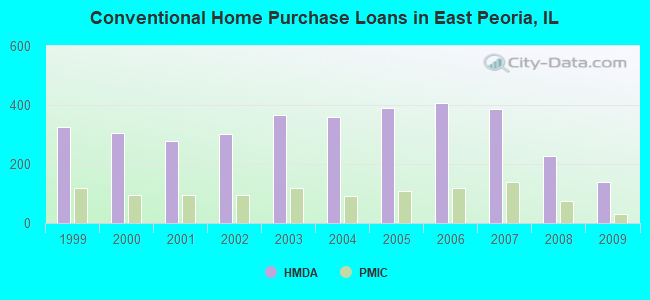
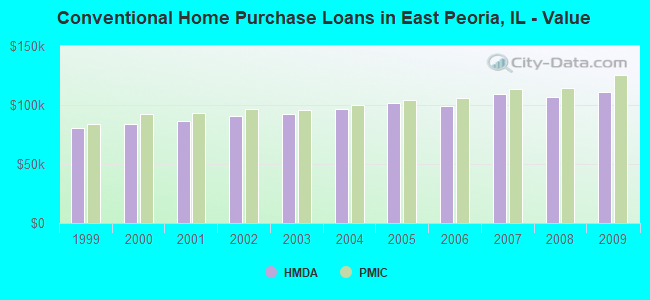
| Home Mortgage Disclosure Act Aggregated Statistics For Year 2009 (Based on 2 full and 4 partial tracts) | ||||||||||||
| A) FHA, FSA/RHS & VA Home Purchase Loans | B) Conventional Home Purchase Loans | C) Refinancings | D) Home Improvement Loans | F) Non-occupant Loans on < 5 Family Dwellings (A B C & D) | G) Loans On Manufactured Home Dwelling (A B C & D) | |||||||
|---|---|---|---|---|---|---|---|---|---|---|---|---|
| Number | Average Value | Number | Average Value | Number | Average Value | Number | Average Value | Number | Average Value | Number | Average Value | |
| LOANS ORIGINATED | 117 | $114,586 | 140 | $111,099 | 596 | $118,150 | 42 | $46,400 | 45 | $80,488 | 0 | $0 |
| APPLICATIONS APPROVED, NOT ACCEPTED | 8 | $102,719 | 4 | $69,348 | 24 | $115,441 | 2 | $65,300 | 3 | $56,347 | 0 | $0 |
| APPLICATIONS DENIED | 9 | $121,589 | 14 | $99,004 | 139 | $109,089 | 25 | $21,827 | 4 | $136,065 | 1 | $24,280 |
| APPLICATIONS WITHDRAWN | 11 | $131,806 | 6 | $113,915 | 108 | $116,997 | 4 | $21,280 | 0 | $0 | 0 | $0 |
| FILES CLOSED FOR INCOMPLETENESS | 1 | $39,660 | 0 | $0 | 9 | $138,250 | 0 | $0 | 0 | $0 | 0 | $0 |
Detailed HMDA statistics for the following Tracts: 0201.00 , 0203.01, 0203.02, 0212.02, 0212.03, 0224.00
| Private Mortgage Insurance Companies Aggregated Statistics For Year 2009 (Based on 2 full and 4 partial tracts) | ||||||
| A) Conventional Home Purchase Loans | B) Refinancings | C) Non-occupant Loans on < 5 Family Dwellings (A & B) | ||||
|---|---|---|---|---|---|---|
| Number | Average Value | Number | Average Value | Number | Average Value | |
| LOANS ORIGINATED | 29 | $125,048 | 41 | $144,575 | 1 | $262,000 |
| APPLICATIONS APPROVED, NOT ACCEPTED | 3 | $83,663 | 9 | $134,156 | 0 | $0 |
| APPLICATIONS DENIED | 5 | $102,898 | 4 | $138,208 | 1 | $72,850 |
| APPLICATIONS WITHDRAWN | 1 | $65,930 | 5 | $129,804 | 0 | $0 |
| FILES CLOSED FOR INCOMPLETENESS | 1 | $156,400 | 1 | $102,790 | 0 | $0 |
Detailed PMIC statistics for the following Tracts: 0201.00 , 0203.01, 0203.02, 0212.02, 0212.03, 0224.00
2002 - 2018 National Fire Incident Reporting System (NFIRS) incidents
- Fire incident types reported to NFIRS in East Peoria, IL
- 62240.2%Outside Fires
- 51233.1%Structure Fires
- 26517.1%Mobile Property/Vehicle Fires
- 1499.6%Other
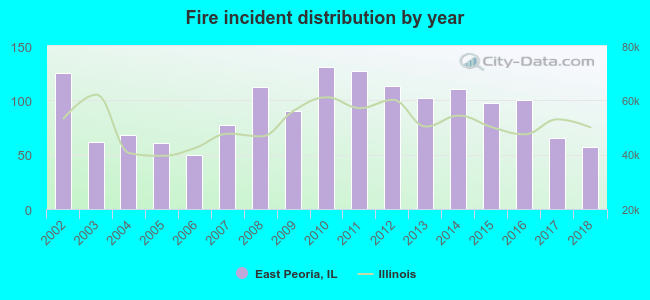 Based on the data from the years 2002 - 2018 the average number of fires per year is 91. The highest number of fires - 131 took place in 2010, and the least - 50 in 2006. The data has a declining trend.
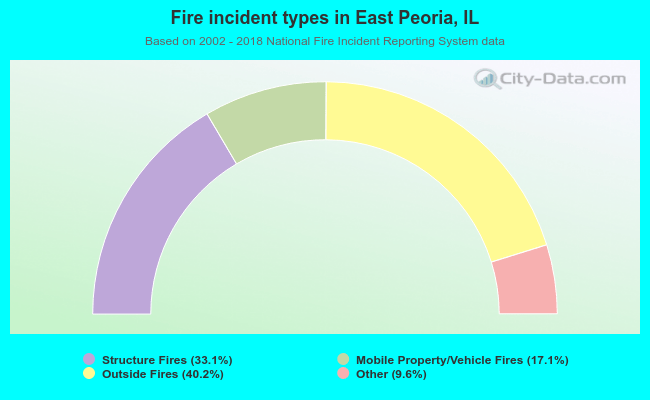 When looking into fire subcategories, the most reports belonged to: Outside Fires (40.2%), and Structure Fires (33.1%).
Fire-safe hotels and motels in East Peoria, Illinois:
- Hampton Inn East Peoria, 11 Winners Way, East Peoria, Illinois 61611 , Phone: (309) 694-0711, Fax: (309) 694-0407
- Best Western Plus, 300 Eastlight Ct, East Peoria, Illinois 61611 , Phone: (309) 694-4959, Fax: (309) 694-4727
- Embassy Suites-East Peoria, 100 Conference Center Dr, East Peoria, Illinois 61611 , Phone: (309) 694-0200, Fax: (309) 694-0201
- Fairfield Inn & Suites By Marriott, 200 Eastlight Ct, East Peoria, Illinois 61611 , Phone: (309) 699-4100, Fax: (309) 699-4300
- Holiday Inn And Suites East Peoria, 101 Holiday Dr, East Peoria, Illinois 61611 , Phone: (309) 291-6023
- Holiday Inn Express & Suites East Peoria - Riverfront, 1100 Bass Pro Dr, East peoria, Illinois 61611 , Phone: (309) 694-9800, Fax: (309) 694-6771
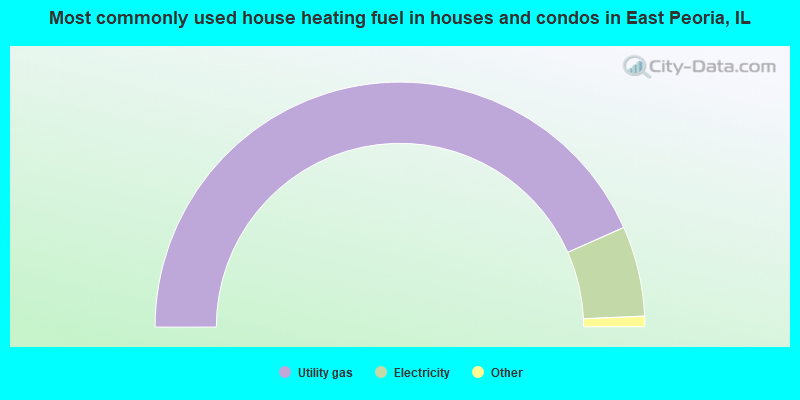
- 86.7%Utility gas
- 11.9%Electricity
- 1.1%Bottled, tank, or LP gas
- 0.3%Other fuel
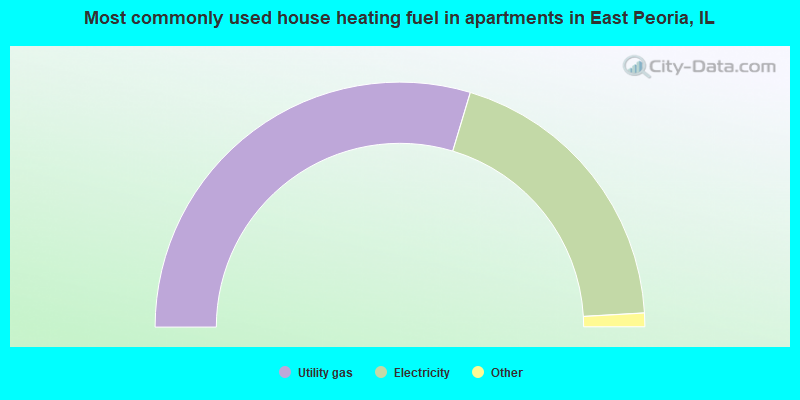
- 59.3%Utility gas
- 38.9%Electricity
- 1.4%No fuel used
- 0.3%Bottled, tank, or LP gas
East Peoria compared to Illinois state average:
- Median house value below state average.
- Unemployed percentage significantly below state average.
- Black race population percentage significantly below state average.
- Hispanic race population percentage significantly below state average.
- Foreign-born population percentage significantly below state average.
- Length of stay since moving in significantly above state average.
East Peoria on our top lists:
- #54 on the list of "Top 101 cities with the largest percentage of people in military ships (population 1,000+)"
- #10 on the list of "Top 101 counties with the lowest percentage of residents relocating to foreign countries in 2011"
- #32 on the list of "Top 101 counties with the lowest percentage of residents relocating from foreign countries between 2010 and 2011"
- #56 on the list of "Top 101 counties with the largest number of people without health insurance coverage in 2000 (pop. 50,000+)"

|
|
Total of 414 patent applications in 2008-2024.