Oxford, Connecticut (CT) income map, earnings map, and wages data
The median household income in Oxford, CT in 2022 was $130,507, which was 32.2% greater than the median annual income of $88,429 across the entire state of Connecticut. Compared to the median income of $77,126 in 2000 this represents an increase of 40.9%. The per capita income in 2022 was $51,677, which means an increase of 45.3% compared to 2000 when it was $28,250.
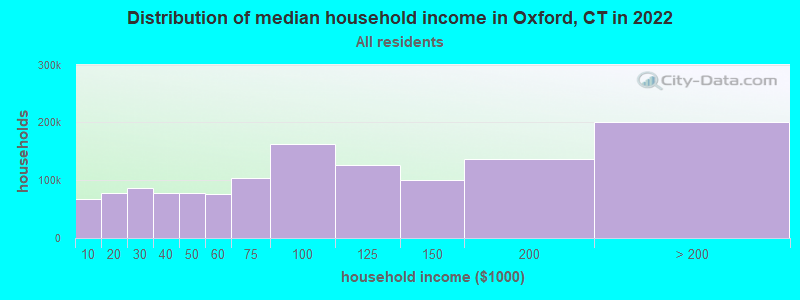
Income statistics for all residents
Median household income in Oxford, CT in 2022:| Oxford: | $130,508 |
| State: | $88,429 |
Change in median household income between 2000 and 2022:| Oxford, Connecticut: | +69.2% |
| Connecticut: | +64.0% |
Number of households with income < $10k:| Oxford: | 5.2% (53,158) |
| State: | 5.1% (72,746) |
Number of households with income $10k - 20k:| Oxford: | 5.8% (59,943) |
| State: | 5.7% (81,643) |
Number of households with income $20k - 30k:| Oxford: | 6.6% (67,851) |
| State: | 6.5% (92,844) |
Number of households with income $30k - 40k:| Oxford: | 5.9% (60,892) |
| Connecticut: | 5.9% (83,934) |
Number of households with income $40k - 50k:| Oxford: | 5.9% (60,501) |
| Connecticut: | 5.8% (83,025) |
Number of households with income $50k - 60k:| Oxford: | 5.8% (59,325) |
| State: | 5.7% (81,788) |
Number of households with income $60k - 75k:| Oxford: | 8.1% (83,122) |
| Connecticut: | 8.1% (115,651) |
Number of households with income $75k - 100k:| Oxford: | 12.6% (129,818) |
| State: | 12.6% (180,173) |
Number of households with income $100k - 125k:| Oxford: | 9.8% (101,062) |
| Connecticut: | 9.9% (141,231) |
Number of households with income $125k - 150k:| Oxford: | 7.8% (80,708) |
| State: | 7.9% (112,826) |
Number of households with income $150k - 200k:| Oxford: | 10.7% (110,402) |
| State: | 10.8% (154,641) |
Number of households with income > $200k:| Oxford: | 16.0% (164,933) |
| Connecticut: | 16.3% (233,133) |
Aggregate household income in Oxford in 2022: $11,945,276,834
Median family income in Oxford in 2022:| Oxford: | $143,633 |
| State: | $115,183 |
Median non-family income in Oxford in 2022:| Oxford: | $60,872 |
| Connecticut: | $50,964 |
Change in median non-family income between 2000 and 2022:| Oxford, Connecticut: | +71.5% |
| State: | +65.1% |
Median per capita income in Oxford in 2022:| Oxford: | $51,678 |
| State: | $51,581 |
Change in median per capita income between 2000 and 2022:| Oxford, Connecticut: | +82.9% |
| Connecticut: | +79.3% |
Income statistics for White residents
Median household income in Oxford, CT in 2022:| Oxford: | $130,563 |
| Connecticut: | $96,890 |
Change in median household income between 2000 and 2022:| Oxford, Connecticut: | +69.4% |
| State: | +68.5% |
Number of households with income < $10k:| Oxford: | 4.2% (28,557) |
| State: | 4.2% (42,265) |
Number of households with income $10k - 20k:| Oxford: | 4.9% (32,832) |
| Connecticut: | 4.8% (48,323) |
Number of households with income $20k - 30k:| Oxford: | 5.8% (39,046) |
| Connecticut: | 5.7% (57,716) |
Number of households with income $30k - 40k:| Oxford: | 5.4% (36,143) |
| State: | 5.3% (53,827) |
Number of households with income $40k - 50k:| Oxford: | 5.3% (35,993) |
| State: | 5.3% (53,301) |
Number of households with income $50k - 60k:| Oxford: | 5.6% (37,458) |
| State: | 5.5% (55,690) |
Number of households with income $60k - 75k:| Oxford: | 7.9% (53,529) |
| State: | 8.0% (80,329) |
Number of households with income $75k - 100k:| Oxford: | 12.7% (85,774) |
| State: | 12.7% (128,070) |
Number of households with income $100k - 125k:| Oxford: | 10.0% (67,353) |
| State: | 10.0% (101,210) |
Number of households with income $125k - 150k:| Oxford: | 8.0% (54,073) |
| State: | 8.0% (81,250) |
Number of households with income $150k - 200k:| Oxford: | 11.8% (79,509) |
| State: | 11.8% (119,527) |
Number of households with income > $200k:| Oxford: | 18.4% (124,467) |
| Connecticut: | 18.6% (187,875) |
Aggregate household income in Oxford in 2022: $8,907,933,321
Median family income in Oxford in 2022:| Oxford: | $146,902 |
| State: | $128,955 |
Number of families with income < $10k:| Oxford: | 1.7% (40) |
| State: | 1.9% (11,537) |
Number of families with income $10k - 20k:| Oxford: | 0.5% (12) |
| State: | 1.8% (11,289) |
Number of families with income $20k - 30k:| Oxford: | 1.2% (27) |
| State: | 3.0% (18,506) |
Number of families with income $30k - 40k:| Oxford: | 2.3% (54) |
| State: | 2.9% (18,160) |
Number of families with income $40k - 50k:| Oxford: | 3.1% (74) |
| State: | 3.9% (24,550) |
Number of families with income $50k - 60k:| Oxford: | 4.2% (100) |
| Connecticut: | 4.3% (26,723) |
Number of families with income $60k - 75k:| Oxford: | 9.6% (228) |
| Connecticut: | 7.1% (44,075) |
Number of families with income $75k - 100k:| Oxford: | 16.4% (387) |
| State: | 12.5% (77,679) |
Number of families with income $100k - 125k:| Oxford: | 16.6% (393) |
| State: | 11.1% (69,086) |
Number of families with income $125k - 150k:| Oxford: | 15.3% (362) |
| State: | 9.6% (59,616) |
Number of families with income $150k - 200k:| Oxford: | 17.7% (419) |
| Connecticut: | 15.7% (97,890) |
Number of families with income > $200k:| Oxford: | 11.3% (268) |
| State: | 26.3% (163,417) |
Median non-family income in Oxford in 2022:| Oxford: | $64,694 |
| Connecticut: | $54,067 |
Change in median non-family income between 2000 and 2022:| Oxford, Connecticut: | +73.7% |
| Connecticut: | +68.7% |
Median per capita income in Oxford in 2022:| Oxford: | $54,237 |
| State: | $59,916 |
Change in median per capita income between 2000 and 2022:| Oxford, Connecticut: | +92.1% |
| State: | +90.2% |
Income statistics for Black or African American residents
Median household income in Oxford, CT in 2022:| Oxford: | $134,080 |
| State: | $61,803 |
Change in median household income between 2000 and 2022:| Oxford, Connecticut: | +60.9% |
| State: | +76.1% |
Number of households with income < $10k:| Oxford: | 6.8% (22,536) |
| Connecticut: | 6.8% (9,494) |
Number of households with income $10k - 20k:| Oxford: | 7.9% (26,118) |
| Connecticut: | 7.9% (11,003) |
Number of households with income $20k - 30k:| Oxford: | 10.8% (35,712) |
| Connecticut: | 10.8% (15,045) |
Number of households with income $30k - 40k:| Oxford: | 8.2% (27,300) |
| State: | 8.2% (11,501) |
Number of households with income $40k - 50k:| Oxford: | 7.4% (24,724) |
| State: | 7.4% (10,416) |
Number of households with income $50k - 60k:| Oxford: | 7.5% (25,005) |
| State: | 7.5% (10,534) |
Number of households with income $60k - 75k:| Oxford: | 8.0% (26,690) |
| State: | 8.0% (11,244) |
Number of households with income $75k - 100k:| Oxford: | 9.6% (31,737) |
| State: | 9.6% (13,370) |
Number of households with income $100k - 125k:| Oxford: | 10.2% (33,811) |
| Connecticut: | 10.2% (14,244) |
Number of households with income $125k - 150k:| Oxford: | 8.0% (26,695) |
| State: | 8.0% (11,246) |
Number of households with income $150k - 200k:| Oxford: | 7.7% (25,463) |
| Connecticut: | 7.7% (10,727) |
Number of households with income > $200k:| Oxford: | 7.9% (26,315) |
| Connecticut: | 7.9% (11,086) |
Aggregate household income in Oxford in 2022: $17,267,963
Median family income in Oxford in 2022:| Oxford: | $383,457 |
| Connecticut: | $87,228 |
Number of families with income $150k - 200k:| Oxford: | 100.0% (123) |
| Connecticut: | 11.4% (9,497) |
Median non-family income in Oxford in 2022:| Oxford: | $21,721 |
| State: | $38,608 |
Change in median non-family income between 2000 and 2022:| Oxford, Connecticut: | +77.0% |
| State: | +77.0% |
Median per capita income in Oxford in 2022:| Oxford: | $93,792 |
| Connecticut: | $36,289 |
Change in median per capita income between 2000 and 2022:| Oxford, Connecticut: | +115.2% |
| Connecticut: | +117.5% |
Income statistics for Asian residents
Median household income in Oxford, CT in 2022:| Oxford: | $149,687 |
| State: | $110,568 |
Change in median household income between 2000 and 2022:| Oxford, Connecticut: | +110.1% |
| State: | +79.5% |
Number of households with income < $10k:| Oxford: | 7.1% (4,911) |
| State: | 7.1% (4,245) |
Number of households with income $10k - 20k:| Oxford: | 3.5% (2,415) |
| State: | 3.5% (2,087) |
Number of households with income $20k - 30k:| Oxford: | 4.1% (2,851) |
| State: | 4.1% (2,464) |
Number of households with income $30k - 40k:| Oxford: | 4.1% (2,867) |
| State: | 4.1% (2,478) |
Number of households with income $40k - 50k:| Oxford: | 3.3% (2,294) |
| Connecticut: | 3.3% (1,983) |
Number of households with income $50k - 60k:| Oxford: | 3.9% (2,693) |
| State: | 3.9% (2,328) |
Number of households with income $60k - 75k:| Oxford: | 7.0% (4,891) |
| State: | 7.0% (4,228) |
Number of households with income $75k - 100k:| Oxford: | 11.5% (7,995) |
| State: | 11.5% (6,911) |
Number of households with income $100k - 125k:| Oxford: | 10.2% (7,088) |
| Connecticut: | 10.2% (6,127) |
Number of households with income $125k - 150k:| Oxford: | 8.5% (5,876) |
| State: | 8.5% (5,079) |
Number of households with income $150k - 200k:| Oxford: | 12.4% (8,600) |
| Connecticut: | 12.4% (7,434) |
Number of households with income > $200k:| Oxford: | 24.4% (16,961) |
| State: | 24.4% (14,661) |
Aggregate household income in Oxford in 2022: $1,420,185
Median family income in Oxford in 2022:| Oxford: | $148,065 |
| Connecticut: | $134,548 |
Median per capita income in Oxford in 2022:| Oxford: | $14,799 |
| State: | $55,295 |
Change in median per capita income between 2000 and 2022:| Oxford, Connecticut: | +103.6% |
| State: | +97.8% |
Income statistics for Hispanic or Latino residents
Median household income in Oxford, CT in 2022:| Oxford: | $158,420 |
| Connecticut: | $60,275 |
Change in median household income between 2000 and 2022:| Oxford, Connecticut: | +67.8% |
| State: | +87.9% |
Number of households with income < $10k:| Oxford: | 8.7% (54,702) |
| State: | 8.7% (18,584) |
Number of households with income $10k - 20k:| Oxford: | 9.1% (56,618) |
| Connecticut: | 9.1% (19,235) |
Number of households with income $20k - 30k:| Oxford: | 8.9% (55,895) |
| State: | 8.9% (18,989) |
Number of households with income $30k - 40k:| Oxford: | 7.5% (46,999) |
| Connecticut: | 7.5% (15,967) |
Number of households with income $40k - 50k:| Oxford: | 8.7% (54,355) |
| State: | 8.7% (18,466) |
Number of households with income $50k - 60k:| Oxford: | 6.9% (43,287) |
| Connecticut: | 6.9% (14,706) |
Number of households with income $60k - 75k:| Oxford: | 8.9% (55,597) |
| State: | 8.9% (18,888) |
Number of households with income $75k - 100k:| Oxford: | 13.5% (84,387) |
| State: | 13.5% (28,669) |
Number of households with income $100k - 125k:| Oxford: | 8.2% (51,317) |
| Connecticut: | 8.2% (17,434) |
Number of households with income $125k - 150k:| Oxford: | 6.5% (40,479) |
| State: | 6.5% (13,752) |
Number of households with income $150k - 200k:| Oxford: | 6.6% (41,545) |
| State: | 6.6% (14,114) |
Number of households with income > $200k:| Oxford: | 6.4% (40,120) |
| State: | 6.4% (13,630) |
Aggregate household income in Oxford in 2022: $30,290,875
Median family income in Oxford in 2022:| Oxford: | $172,412 |
| Connecticut: | $68,336 |
Number of families with income < $10k:| Oxford: | 3.9% (20) |
| Connecticut: | 5.2% (7,456) |
Number of families with income $10k - 20k:| Oxford: | 2.2% (11) |
| State: | 6.0% (8,616) |
Number of families with income $20k - 30k:| Oxford: | 4.2% (21) |
| State: | 8.9% (12,680) |
Number of families with income $30k - 40k:| Oxford: | 6.2% (32) |
| State: | 8.5% (12,090) |
Number of families with income $40k - 50k:| Oxford: | 7.4% (38) |
| State: | 8.8% (12,624) |
Number of families with income $50k - 60k:| Oxford: | 8.9% (45) |
| Connecticut: | 8.4% (11,924) |
Number of families with income $60k - 75k:| Oxford: | 12.1% (62) |
| State: | 8.9% (12,677) |
Number of families with income $75k - 100k:| Oxford: | 19.6% (101) |
| State: | 14.3% (20,457) |
Number of families with income $100k - 125k:| Oxford: | 12.0% (61) |
| State: | 8.2% (11,720) |
Number of families with income $125k - 150k:| Oxford: | 13.0% (66) |
| State: | 8.2% (11,729) |
Number of families with income $150k - 200k:| Oxford: | 7.7% (39) |
| State: | 7.1% (10,096) |
Number of families with income > $200k:| Oxford: | 2.9% (15) |
| Connecticut: | 7.4% (10,622) |
Median non-family income in Oxford in 2022:| Oxford: | $71,727 |
| State: | $36,714 |
Change in median non-family income between 2000 and 2022:| Oxford, Connecticut: | +73.9% |
| State: | +90.0% |
Median per capita income in Oxford in 2022:| Oxford: | $44,415 |
| Connecticut: | $28,507 |
Change in median per capita income between 2000 and 2022:| Oxford, Connecticut: | +80.3% |
| State: | +117.2% |
Income statistics for American Indian and Alaska Native residents
Median household income in Oxford, CT in 2022:| Oxford: | $113,508 |
| State: | $41,848 |
Change in median household income between 2000 and 2022:| Oxford, Connecticut: | +12.9% |
| Connecticut: | +12.9% |
Number of households with income < $10k:| Oxford: | 8.4% (285,977) |
| State: | 10.2% (340) |
Number of households with income $10k - 20k:| Oxford: | 9.4% (319,143) |
| State: | 8.5% (283) |
Number of households with income $20k - 30k:| Oxford: | 8.5% (288,668) |
| State: | 9.4% (314) |
Number of households with income $30k - 40k:| Oxford: | 9.1% (309,272) |
| State: | 10.1% (337) |
Number of households with income $40k - 50k:| Oxford: | 8.3% (283,685) |
| Connecticut: | 13.4% (447) |
Number of households with income $50k - 60k:| Oxford: | 7.8% (267,492) |
| State: | 3.1% (104) |
Number of households with income $60k - 75k:| Oxford: | 9.8% (333,417) |
| Connecticut: | 5.6% (188) |
Number of households with income $75k - 100k:| Oxford: | 12.6% (430,388) |
| State: | 13.4% (447) |
Number of households with income $100k - 125k:| Oxford: | 9.4% (321,844) |
| State: | 9.5% (317) |
Number of households with income $125k - 150k:| Oxford: | 5.6% (192,687) |
| State: | 3.9% (131) |
Number of households with income $150k - 200k:| Oxford: | 6.0% (203,128) |
| Connecticut: | 6.3% (212) |
Number of households with income > $200k:| Oxford: | 5.2% (175,819) |
| State: | 6.8% (228) |
Aggregate household income in Oxford in 2022: $2,121,452
Median family income in Oxford in 2022:| Oxford: | $137,422 |
| State: | $57,217 |
Number of families with income $75k - 100k:| Oxford: | 28.4% (17) |
| Connecticut: | 17.4% (349) |
Number of families with income $100k - 125k:| Oxford: | 71.6% (42) |
| State: | 7.9% (159) |
Median per capita income in Oxford in 2022:| Oxford: | $35,255 |
| State: | $25,355 |
Change in median per capita income between 2000 and 2022:| Oxford, Connecticut: | +45.9% |
| Connecticut: | +39.4% |
Income statistics for Multirace residents
Median household income in Oxford, CT in 2022:| Oxford: | $26,974 |
| Connecticut: | $77,277 |
Change in median household income between 2000 and 2022:| Oxford, Connecticut: | +119.4% |
| State: | +113.6% |
Number of households with income < $10k:| Oxford: | 6.0% (2,533) |
| State: | 6.0% (7,457) |
Number of households with income $10k - 20k:| Oxford: | 8.1% (3,444) |
| State: | 8.1% (10,139) |
Number of households with income $20k - 30k:| Oxford: | 7.0% (2,956) |
| State: | 7.0% (8,702) |
Number of households with income $30k - 40k:| Oxford: | 6.9% (2,903) |
| State: | 6.9% (8,546) |
Number of households with income $40k - 50k:| Oxford: | 7.0% (2,960) |
| Connecticut: | 7.0% (8,712) |
Number of households with income $50k - 60k:| Oxford: | 5.9% (2,490) |
| Connecticut: | 5.9% (7,331) |
Number of households with income $60k - 75k:| Oxford: | 8.5% (3,612) |
| State: | 8.5% (10,634) |
Number of households with income $75k - 100k:| Oxford: | 14.1% (5,979) |
| Connecticut: | 14.1% (17,600) |
Number of households with income $100k - 125k:| Oxford: | 9.9% (4,206) |
| Connecticut: | 9.9% (12,383) |
Number of households with income $125k - 150k:| Oxford: | 7.2% (3,030) |
| State: | 7.2% (8,921) |
Number of households with income $150k - 200k:| Oxford: | 8.8% (3,710) |
| Connecticut: | 8.8% (10,922) |
Number of households with income > $200k:| Oxford: | 10.6% (4,500) |
| State: | 10.6% (13,247) |
Aggregate household income in Oxford in 2022: $7,543,085
Median family income in Oxford in 2022:| Oxford: | $88,708 |
| State: | $84,255 |
Number of families with income $40k - 50k:| Oxford: | 100.0% (43) |
| Connecticut: | 6.9% (5,792) |
Median non-family income in Oxford in 2022:| Oxford: | $20,365 |
| State: | $44,462 |
Change in median non-family income between 2000 and 2022:| Oxford, Connecticut: | +81.0% |
| State: | +97.6% |
Median per capita income in Oxford in 2022:| Oxford: | $33,936 |
| Connecticut: | $32,794 |
Change in median per capita income between 2000 and 2022:| Oxford, Connecticut: | +95.5% |
| Connecticut: | +117.2% |