Woodbridge, NJ (New Jersey) Houses and Residents
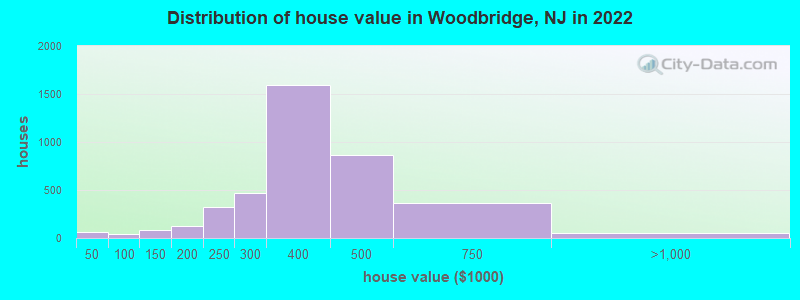
Estimated median house or condo value in 2022: $367,681 (it was $145,100 in 2000 )
Woodbridge:
$367,681New Jersey:
$428,900
Lower value quartile - upper value quartile: $292,577 - $446,345Mean price in 2022: Detached houses: $366,907 Here:
$366,907State:
$537,591
Townhouses or other attached units: $280,011 Here:
$280,011State:
$381,113
In 2-unit structures: $380,108 Here:
$380,108State:
$444,476
In 3-to-4-unit structures: $212,124 Here:
$212,124State:
$457,463
In 5-or-more-unit structures: $301,168 Here:
$301,168State:
$368,745
Total population: 19,265 (Urban population: 18,496, Rural population: 0)
Houses: 8,365 (7,874 occupied: 4,256 owner occupied, 3,684 renter occupied )
% of renters here:
46%State:
35%
Housing density: 2,160 houses/condos per square mile
Median price asked for vacant for-sale houses and condos in 2022: $945,500.
Median contract rent in 2022: $1,813 (lower quartile is $1,417, upper quartile is over $2,000)
Median rent asked for vacant for-rent units in 2022: $2,240
Median gross rent in Woodbridge, NJ in 2022: $1,893
Housing units in Woodbridge with a mortgage: 2,930 (416 second mortgage, 180 home equity loan, 219 both second mortgage and home equity loan )Houses without a mortgage: 127
Median household income for houses/condos with a mortgage: $119,478
Median household income for apartments without a mortgage: $95,318
Median monthly housing costs: $1,951
Data:
Median house or condo value ($)
Median house or condo value ($ change since 2000)
Median house or condo value ($) - White
Median house or condo value ($) - Black or African American
Median house or condo value ($) - Asian
Median house or condo value ($) - Hispanic or Latino
Median house or condo value ($) - American Indian and Alaska Native
Median house or condo value ($) - Multirace
Median house or condo value ($) - Other Race
Median price asked for mobile homes ($)
Household density (households per square mile)
Mean house or condo value by units in structure - 1, detached ($)
Mean house or condo value by units in structure - 1, attached ($)
Mean house or condo value by units in structure - 2 ($)
Mean house or condo value by units in structure by units in structure - 3 or 4 ($)
Mean house or condo value by units in structure - 5 or more ($)
Mean house or condo value by units in structure - Boat, RV, van, etc. ($)
Mean house or condo value by units in structure - Mobile home ($)
Median contract rent ($)
Median contract rent - Lower quartile ($)
Median contract rent - Upper quartile ($)
Median gross rent ($)
Urban houses (%)
Rural houses (%)
Houses occupied (%)
Houses occupied (% change since 2000)
Houses owner occupied (%)
Houses owner occupied (% change since 2000)
Houses renter occupied (%)
Houses renter occupied (% change since 2000)
Vacant housing units - For rent (%)
Vacant housing units - For rent (% change since 2000)
Vacant housing units - For sale only (%)
Vacant housing units - For sale only (% change since 2000)
Vacant housing units - Rented or sold, not occupied (%)
Vacant housing units - Rented or sold, not occupied (% change since 2000)
Vacant housing units - For seasonal, recreational, or occasional use (%)
Vacant housing units - For seasonal, recreational, or occasional use (% change since 2000)
Vacant housing units - For migrant workers (%)
Vacant housing units - For migrant workers (% change since 2000)
Vacant housing units - Other vacant (%)
Vacant housing units - Other vacant (% change since 2000)
Median monthly housing costs ($)
Median household income for houses/condos with a mortgage ($)
Median household income for houses/condos without a mortgage ($)
Median household income ($)
Median household income ($) - White
Median household income ($) - Black or African American
Median household income ($) - Asian
Median household income ($) - Hispanic or Latino
Median household income ($) - American Indian and Alaska Native
Median household income ($) - Multirace
Median household income ($) - Other Race
Mortgage status - with mortgage (%)
Mortgage status - with second mortgage (%)
Mortgage status - with home equity loan (%)
Mortgage status - with both second mortgage and home equity loan (%)
Mortgage status - without a mortgage (%)
Median year house/condo built
Median year apartment built
Household type by relationship - Male householder living alone (%)
Household type by relationship - Male householder not living alone (%)
Household type by relationship - Female householder living alone (%)
Household type by relationship - Female householder not living alone (%)
Household type by relationship - Opposite-Sex spouse (%)
Household type by relationship - Same-Sex spouse (%)
Household type by relationship - Opposite-Sex unmarried partner (%)
Household type by relationship - Same-Sex unmarried partner (%)
Household type by relationship - In group quarters (%)
Size of family households - 2-person household (%)
Size of family households - 3-person household (%)
Size of family households - 4-person household (%)
Size of family households - 5-person household (%)
Size of family households - 6-person household (%)
Size of family households - 7-or-more-person household (%)
Size of nonfamily households - 1-person household (%)
Size of nonfamily households - 2-person household (%)
Size of nonfamily households - 3-person household (%)
Size of nonfamily households - 4-person household (%)
Size of nonfamily households - 5-person household (%)
Size of nonfamily households - 6-person household (%)
Size of nonfamily households - 7-or-moreperson household (%)
Year house built - Built 2010 or later (%)
Year house built - Built 2000 to 2009 (%)
Year house built - Built 1990 to 1999 (%)
Year house built - Built 1980 to 1989 (%)
Year house built - Built 1970 to 1979 (%)
Year house built - Built 1960 to 1969 (%)
Year house built - Built 1950 to 1959 (%)
Year house built - Built 1940 to 1949 (%)
Year house built - Built 1939 or earlier (%)
Median number of rooms in houses and condos
Median number of rooms in apartments
Median number of bedrooms in owner occupied houses
Mean number of bedrooms in owner occupied houses
Median number of bedrooms in renter occupied houses
Mean number of bedrooms in renter occupied houses
Median number of vehichles in owner occupied houses
Mean number of vehichles in owner occupied houses
Median number of vehichles in renter occupied houses
Mean number of vehichles in renter occupied houses
Rooms in owner-occupied houses - 1 room (%)
Rooms in owner-occupied houses - 2 rooms (%)
Rooms in owner-occupied houses - 3 rooms (%)
Rooms in owner-occupied houses - 4 rooms (%)
Rooms in owner-occupied houses - 5 rooms (%)
Rooms in owner-occupied houses - 6 rooms (%)
Rooms in owner-occupied houses - 7 rooms (%)
Rooms in owner-occupied houses - 8 rooms (%)
Rooms in owner-occupied houses - 9+ rooms (%)
Rooms in renter-occupied houses - 1 room (%)
Rooms in renter-occupied houses - 2 rooms (%)
Rooms in renter-occupied houses - 3 rooms (%)
Rooms in renter-occupied houses - 4 rooms (%)
Rooms in renter-occupied houses - 5 rooms (%)
Rooms in renter-occupied houses - 6 rooms (%)
Rooms in renter-occupied houses - 7 rooms (%)
Rooms in renter-occupied houses - 8 rooms (%)
Rooms in renter-occupied houses - 9+ rooms (%)
Bedrooms in owner-occupied houses - no bedrooms (%)
Bedrooms in owner-occupied houses - 1 bedroom (%)
Bedrooms in owner-occupied houses - 2 bedrooms (%)
Bedrooms in owner-occupied houses - 3 bedrooms (%)
Bedrooms in owner-occupied houses - 4 bedrooms (%)
Bedrooms in owner-occupied houses - 5+ bedrooms (%)
Bedrooms in renter-occupied houses - no bedrooms (%)
Bedrooms in renter-occupied houses - 1 bedroom (%)
Bedrooms in renter-occupied houses - 2 bedrooms (%)
Bedrooms in renter-occupied houses - 3 bedrooms (%)
Bedrooms in renter-occupied houses - 4 bedrooms (%)
Bedrooms in renter-occupied houses - 5+ bedrooms (%)
Vehicles available in owner-occupied houses - no vehicle available (%)
Vehicles available in owner-occupied houses - 1 vehicle available(%)
Vehicles available in owner-occupied houses - 2 Vehicles available (%)
Vehicles available in owner-occupied houses - 3 Vehicles available (%)
Vehicles available in owner-occupied houses - 4 Vehicles available (%)
Vehicles available in owner-occupied houses - 5+ Vehicles available (%)
Vehicles available in renter-occupied houses - no vehicle available (%)
Vehicles available in renter-occupied houses - 1 vehicle available (%)
Vehicles available in renter-occupied houses - 2 Vehicles available (%)
Vehicles available in renter-occupied houses - 3 Vehicles available (%)
Vehicles available in renter-occupied houses - 4 Vehicles available (%)
Vehicles available in renter-occupied houses - 5+ Vehicles available (%)
Housing units in structures - 1, detached (%)
Housing units in structures - 1, attached (%)
Housing units in structures - 2 (%)
Housing units in structures - 3 or 4 (%)
Housing units in structures - 5 to 9 (%)
Housing units in structures - 10 to 19 (%)
Housing units in structures - 20 to 49 (%)
Housing units in structures - 50 or more (%)
Housing units in structures - Mobile home (%)
Housing units in structures - Boat, RV, van, etc. (%)
Housing units in structures - Owners - 1, detached (%)
Housing units in structures - Owners - 1, attached (%)
Housing units in structures - Owners - 2 (%)
Housing units in structures - Owners - 3 or 4 (%)
Housing units in structures - Owners - 5 to 9 (%)
Housing units in structures - Owners - 10 to 19 (%)
Housing units in structures - Owners - 20 to 49 (%)
Housing units in structures - Owners - 50 or more (%)
Housing units in structures - Owners - Mobile home (%)
Housing units in structures - Owners - Boat, RV, van, etc. (%)
Housing units in structures - Renters - 1, detached (%)
Housing units in structures - Renters - 1, attached (%)
Housing units in structures - Renters - 2 (%)
Housing units in structures - Renters - 3 or 4 (%)
Housing units in structures - Renters - 5 to 9 (%)
Housing units in structures - Renters - 10 to 19 (%)
Housing units in structures - Renters - 20 to 49 (%)
Housing units in structures - Renters - 50 or more (%)
Housing units in structures - Renters - Mobile home (%)
Housing units in structures - Renters - Boat, RV, van, etc. (%)
House/condo owner moved in on average (years ago)
Renter moved in on average (years ago)
Year householder moved into unit - Moved in 1999 to March 2000 (%)
Year householder moved into unit - Moved in 1999 to March 2000 (%) - White
Year householder moved into unit - Moved in 1999 to March 2000 (%) - Black or African American
Year householder moved into unit - Moved in 1999 to March 2000 (%) - Asian
Year householder moved into unit - Moved in 1999 to March 2000 (%) - Hispanic or Latino
Year householder moved into unit - Moved in 1999 to March 2000 (%) - American Indian and Alaska Native
Year householder moved into unit - Moved in 1999 to March 2000 (%) - Multirace
Year householder moved into unit - Moved in 1999 to March 2000 (%) - Other Race
Year householder moved into unit - Moved in 1995 to 1998 (%)
Year householder moved into unit - Moved in 1995 to 1998 (%) - White
Year householder moved into unit - Moved in 1995 to 1998 (%) - Black or African American
Year householder moved into unit - Moved in 1995 to 1998 (%) - Asian
Year householder moved into unit - Moved in 1995 to 1998 (%) - Hispanic or Latino
Year householder moved into unit - Moved in 1995 to 1998 (%) - American Indian and Alaska Native
Year householder moved into unit - Moved in 1995 to 1998 (%) - Multirace
Year householder moved into unit - Moved in 1995 to 1998 (%) - Other Race
Year householder moved into unit - Moved in 1990 to 1994 (%)
Year householder moved into unit - Moved in 1990 to 1994 (%) - White
Year householder moved into unit - Moved in 1990 to 1994 (%) - Black or African American
Year householder moved into unit - Moved in 1990 to 1994 (%) - Asian
Year householder moved into unit - Moved in 1990 to 1994 (%) - Hispanic or Latino
Year householder moved into unit - Moved in 1990 to 1994 (%) - American Indian and Alaska Native
Year householder moved into unit - Moved in 1990 to 1994 (%) - Multirace
Year householder moved into unit - Moved in 1990 to 1994 (%) - Other Race
Year householder moved into unit - Moved in 1980 to 1989 (%)
Year householder moved into unit - Moved in 1980 to 1989 (%) - White
Year householder moved into unit - Moved in 1980 to 1989 (%) - Black or African American
Year householder moved into unit - Moved in 1980 to 1989 (%) - Asian
Year householder moved into unit - Moved in 1980 to 1989 (%) - Hispanic or Latino
Year householder moved into unit - Moved in 1980 to 1989 (%) - American Indian and Alaska Native
Year householder moved into unit - Moved in 1980 to 1989 (%) - Multirace
Year householder moved into unit - Moved in 1980 to 1989 (%) - Other Race
Year householder moved into unit - Moved in 1970 to 1979 (%)
Year householder moved into unit - Moved in 1970 to 1979 (%) - White
Year householder moved into unit - Moved in 1970 to 1979 (%) - Black or African American
Year householder moved into unit - Moved in 1970 to 1979 (%) - Asian
Year householder moved into unit - Moved in 1970 to 1979 (%) - Hispanic or Latino
Year householder moved into unit - Moved in 1970 to 1979 (%) - American Indian and Alaska Native
Year householder moved into unit - Moved in 1970 to 1979 (%) - Multirace
Year householder moved into unit - Moved in 1970 to 1979 (%) - Other Race
Year householder moved into unit - Moved in 1969 or earlier (%)
Year householder moved into unit - Moved in 1969 or earlier (%) - White
Year householder moved into unit - Moved in 1969 or earlier (%) - Black or African American
Year householder moved into unit - Moved in 1969 or earlier (%) - Asian
Year householder moved into unit - Moved in 1969 or earlier (%) - Hispanic or Latino
Year householder moved into unit - Moved in 1969 or earlier (%) - American Indian and Alaska Native
Year householder moved into unit - Moved in 1969 or earlier (%) - Multirace
Year householder moved into unit - Moved in 1969 or earlier (%) - Other Race
Housing units lacking complete plumbing facilities (%)
Housing units lacking complete kitchen facilities (%)
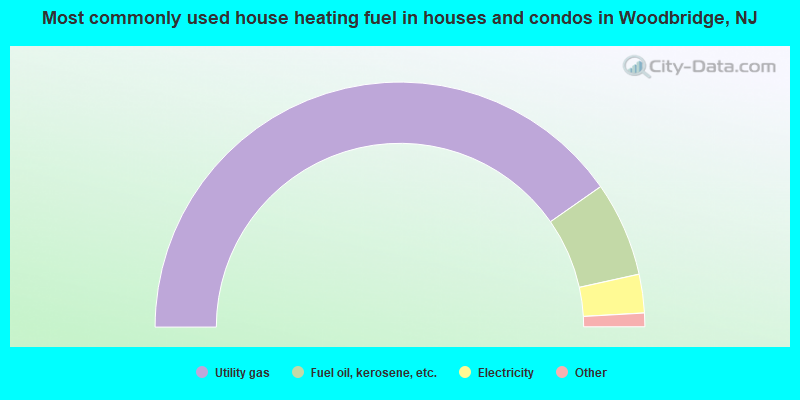
House heating fuel used in houses and condos - Utility gas (%)
House heating fuel used in houses and condos - Bottled, tank, or LP gas (%)
House heating fuel used in houses and condos - Electricity (%)
House heating fuel used in houses and condos - Fuel oil, kerosene, etc. (%)
House heating fuel used in houses and condos - Coal or coke (%)
House heating fuel used in houses and condos - Wood (%)
House heating fuel used in houses and condos - Solar energy (%)
House heating fuel used in houses and condos - Other fuel (%)
House heating fuel used in houses and condos - No fuel used (%)
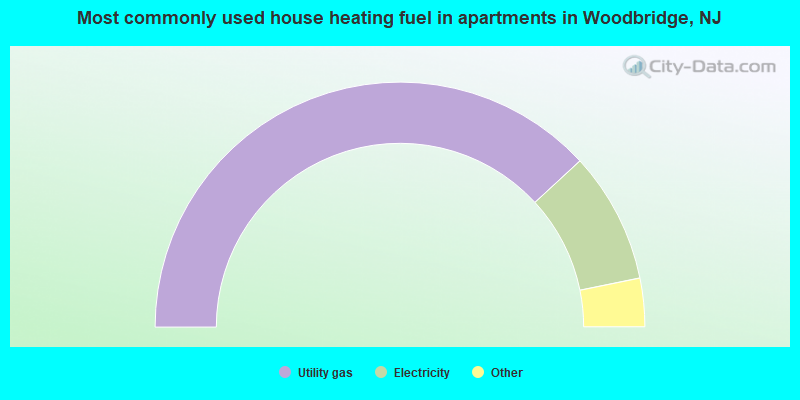
House heating fuel used in apartments - Utility gas (%)
House heating fuel used in apartments - Bottled, tank, or LP gas (%)
House heating fuel used in apartments - Electricity (%)
House heating fuel used in apartments - Fuel oil, kerosene, etc. (%)
House heating fuel used in apartments - Coal or coke (%)
House heating fuel used in apartments - Wood (%)
House heating fuel used in apartments - Solar energy (%)
House heating fuel used in apartments - Other fuel (%)
House heating fuel used in apartments - No fuel used (%)
Latest news about housing in Woodbridge, NJ collected exclusively by city-data.com from local newspapers, TV, and radio stations
Median year house/condo built: 1958Median year apartment built: 1984Household type by relationship:
Households: 20,957
Male householders: 4,156 (767 living alone ), Female householders: 3,667 (976 living alone )3,923 spouses (3,874 opposite-sex spouses ), 547 unmarried partners , (544 opposite-sex unmarried partners ), 6,545 children (6,357 natural , 43 adopted , 145 stepchildren ), 182 grandchildren , 264 brothers or sisters , 562 parents , 46 foster children , 486 other relatives , 530 non-relatives In group quarters: 44
Size of family households: 1,858 2-persons , 1,607 3-persons , 1,448 4-persons , 357 5-persons , 160 6-persons , 102 7-or-more-persons .
Size of nonfamily households: 1,773 1-person , 566 2-persons , 72 3-persons , 15 4-persons .
3,089 married couples with children. single-parent households (314 men , 970 women ).
59.1% of residents of Woodbridge speak English at home. of residents speak Spanish at home (64% speak English very well , 10% speak English well , 14% speak English not well , 12% don't speak English at all ).of residents speak other Indo-European language at home (73% speak English very well , 18% speak English well , 9% speak English not well ).of residents speak Asian or Pacific Island language at home (75% speak English very well , 21% speak English well , 2% speak English not well , 2% don't speak English at all ).of residents speak other language at home (84% speak English very well , 15% speak English well , 2% speak English not well ).
Foreign born population: 6,031 (28.8%)of them are naturalized citizens )
Median number of rooms in houses and condos:
Median number of rooms in apartments
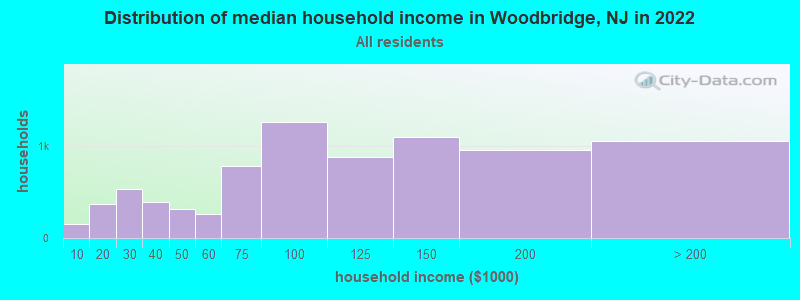
Woodbridge, NJ household income distribution 148 Less than $10,000366 $10,000 to $19,999531 $20,000 to $29,999393 $30,000 to $39,999319 $40,000 to $49,999256 $50,000 to $59,999784 $60,000 to $74,9991,255 $75,000 to $99,999874 $100,000 to $124,9991,092 $125,000 to $149,999956 $150,000 to $199,9991,047 $200,000 or more
Home value of owner - occupied houses in 2022 in Woodbridge, NJ 4 Less than $10,0000 $20,000 to $24,99939 $30,000 to $34,99913 $40,000 to $49,99923 $60,000 to $69,9998 $100,000 to $124,99973 $125,000 to $149,99987 $150,000 to $174,99938 $175,000 to $199,999327 $200,000 to $249,999471 $250,000 to $299,9991,589 $300,000 to $399,999868 $400,000 to $499,999369 $500,000 to $749,99937 $750,000 to $999,99911 $2,000,000 or moreRent paid by renters in 2022 in Woodbridge, NJ 13 $150 to $19912 $200 to $249113 $300 to $3495 $350 to $39916 $400 to $44962 $500 to $54923 $600 to $64917 $750 to $79929 $800 to $89916 $900 to $99983 $1,000 to $1,249460 $1,250 to $1,4991,322 $1,500 to $1,999788 $2,000 to $2,499235 $2,500 to $2,99949 $3,500 or more164 No cash rent
Percentage of workers working in this county: 58.0%Number of people working at home: 1,420 (12.8% of all workers )
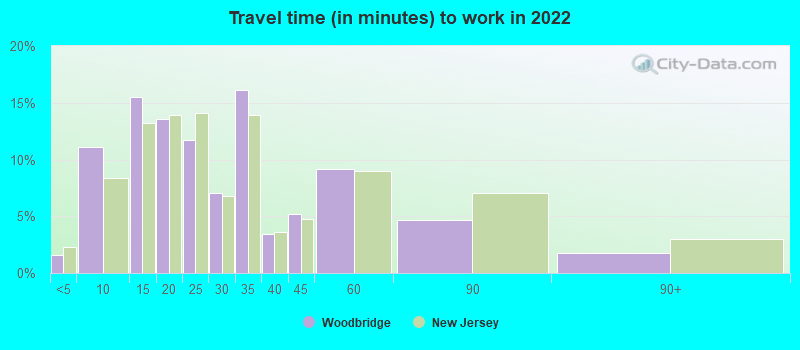
Travel time to work (commute)
Less than 5 minutes: 2015 to 9 minutes: 1,19310 to 14 minutes: 1,42015 to 19 minutes: 1,50320 to 24 minutes: 57025 to 29 minutes: 81630 to 34 minutes: 1,23735 to 39 minutes: 21040 to 44 minutes: 62945 to 59 minutes: 83860 to 89 minutes: 69190 or more minutes: 376
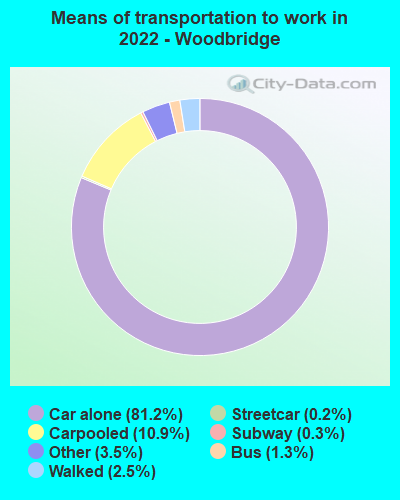
Means of transportation to work:
Drove a car alone: 11,493 (70.2%)Carpooled: 1,820 (11.1%)Bus : 81 (0.5%)Subway or elevated rail : 46 (0.3%)Long-distance train or commuter rail : 40 (0.2%)Taxi: 676 (4.1%)Walked: 522 (3.2%)Worked at home: 1,420 (8.7%)
Unemployment by race in 2022
Unemployment rate for White non-Hispanic residents 2.5% Males2.9% FemalesUnemployment rate for Black residents 14.0% MalesUnemployment rate for Asian residents 3.6% Males8.7% FemalesUnemployment rate for other race residents 6.1% Males1.9% FemalesUnemployment rate for two or more race residents 3.4% Males6.3% FemalesUnemployment rate for Hispanic or Latino residents 8.4% Males7.7% Females
Year of entry for the foreign-born population in Woodbridge, New Jersey
2,552 2010 or later 1,704 2000 to 2009 977 1990 to 1999 774 1980 to 1989 365 1970 to 1979 551 Before 1970
First ancestries reported:
Irish: 702 (6.1%)
Italian: 589 (5.2%)
Polish: 543 (4.8%)
American: 282 (2.5%)
Hungarian: 249 (2.2%)
German: 247 (2.2%)
Haitian: 193 (1.7%)
African: 186 (1.6%)
Egyptian: 107 (0.9%)
Portuguese: 91 (0.8%)
Ukrainian: 91 (0.8%)
Turkish: 76 (0.7%)
Jamaican: 75 (0.7%)
Czechoslovakian: 66 (0.6%)
European: 61 (0.5%)
Nigerian: 61 (0.5%)
Iranian: 39 (0.3%)
Russian: 31 (0.3%)
Brazilian: 28 (0.2%)
Slovak: 28 (0.2%)
British: 27 (0.2%)
Scottish: 27 (0.2%)
Pennsylvania German: 26 (0.2%)
Greek: 14 (0.1%)
Armenian: 12 (0.1%)
Finnish: 12 (0.1%)
Guyanese: 12 (0.1%)
Eastern European: 10 (0.09%)
Norwegian: 10 (0.09%)
Danish: 9 (0.08%)
Scotch-Irish: 3 (0.03%) Most common places of birth for foreign-born residents (%): India Woodbridge:
35.5% (2,083)New Jersey:
12.8% (274,609)
Dominican Republic Woodbridge:
10.5% (615)New Jersey:
9.7% (209,055)
Mexico Woodbridge:
8.2% (479)New Jersey:
4.8% (102,527)
Colombia Woodbridge:
5.4% (315)New Jersey:
4.2% (90,817)
Nigeria Woodbridge:
3.3% (195)New Jersey:
1.2% (25,213)
Pakistan Woodbridge:
3.2% (190)New Jersey:
1.3% (27,580)
Philippines Woodbridge:
2.4% (143)New Jersey:
4.0% (85,934)
Argentina Woodbridge:
2.2% (127)New Jersey:
0.5% (10,607)
Poland Woodbridge:
2.1% (124)New Jersey:
2.3% (48,811)
El Salvador Woodbridge:
1.8% (108)New Jersey:
2.3% (48,885)
Ecuador Woodbridge:
1.8% (106)New Jersey:
4.4% (95,275)
Vietnam Woodbridge:
1.5% (89)New Jersey:
0.7% (15,644)
Place of birth for U.S.-born residents:
This state: 11,088Other state: 3,285Northeast: 2,261Midwest: 273South: 504West: 225 87.9% of Woodbridge residents lived in the same house 1 years ago.
Out of people who lived in different houses, 42.6% lived in this county.
Out of people who lived in different counties, 60.0% lived in New Jersey.
Woodbridge:
87.9%State average:
90.4%
Education attainment for males 25 years and older:
No schooling: 212Nursery to 4th grade: 205th and 6th grade: 507th and 8th grade: 429th grade: 5010th grade: 3911th grade: 3712th grade, no diploma: 140High school graduate (or equivalency): 1,770Less than 1 year of college: 437Some college more than 1 year, no degree: 968Associate degree: 654Bachelor's degree: 1,652Master's degree: 819Professional school degree: 180Doctorate degree: 157
Education attainment for females 25 years and older:
No schooling: 251Nursery to 4th grade: 975th and 6th grade: 97th and 8th grade: 169th grade: 3710th grade: 2611th grade: 5712th grade, no diploma: 104High school graduate (or equivalency): 1,959Less than 1 year of college: 483Some college more than 1 year, no degree: 964Associate degree: 1,066Bachelor's degree: 1,519Master's degree: 842Professional school degree: 151Doctorate degree: 11
Housing units in structures:
One, detached: 3,642One, attached: 498Two: 6213 or 4: 2525 to 9: 78810 to 19: 1,81220 to 49: 26750 or more: 480Mobile homes: 1Housing units lacking complete plumbing facilities in 2022: 0.3%Housing units lacking complete kitchen facilities in 2022: 0.6%House/condo owner moved in on average 17 years ago
Renter moved in on average 3 years ago
Private vs. public school enrollment:
Students in private schools in grades 1 to 8 (elementary and middle school): 212 Here:
13.5%New Jersey:
12.3%
Students in private schools in grades 9 to 12 (high school): 38 Here:
2.9%New Jersey:
13.1%
Students in private undergraduate colleges: 184 Here:
32.1%New Jersey:
33.2%