Races in Woodbridge, New Jersey (NJ) Detailed Stats
Data:
Races - White alone (%)
Races - White alone (% change since 2000)
Races - Black alone (%)
Races - Black alone (% change since 2000)
Races - American Indian alone (%)
Races - American Indian alone (% change since 2000)
Races - Asian alone (%)
Races - Asian alone (% change since 2000)
Races - Hispanic (%)
Races - Hispanic (% change since 2000)
Races - Native Hawaiian and Other Pacific Islander alone (%)
Races - Native Hawaiian and Other Pacific Islander alone (% change since 2000)
Races - Two or more races(%)
Races - Two or more races(% change since 2000)
Races - Other race alone (%)
Races - Other race alone (% change since 2000)
Racial diversity
Place of birth - Born in state of residence (%)
Place of birth - Born in state of residence (%) - White
Place of birth - Born in state of residence (%) - Black or African American
Place of birth - Born in state of residence (%) - Asian
Place of birth - Born in state of residence (%) - Hispanic or Latino
Place of birth - Born in state of residence (%) - American Indian and Alaska Native
Place of birth - Born in state of residence (%) - Multirace
Place of birth - Born in state of residence (%) - Other Race
Place of birth - Born in other state (%)
Place of birth - Born in other state (%) - White
Place of birth - Born in other state (%) - Black or African American
Place of birth - Born in other state (%) - Asian
Place of birth - Born in other state (%) - Hispanic or Latino
Place of birth - Born in other state (%) - American Indian and Alaska Native
Place of birth - Born in other state (%) - Multirace
Place of birth - Born in other state (%) - Other Race
Place of birth - Native, outside of US (%)
Place of birth - Native, outside of US (%) - White
Place of birth - Native, outside of US (%) - Black or African American
Place of birth - Native, outside of US (%) - Asian
Place of birth - Native, outside of US (%) - Hispanic or Latino
Place of birth - Native, outside of US (%) - American Indian and Alaska Native
Place of birth - Native, outside of US (%) - Multirace
Place of birth - Native, outside of US (%) - Other Race
Place of birth - Foreign born (%)
Place of birth - Foreign born (%) - White
Place of birth - Foreign born (%) - Black or African American
Place of birth - Foreign born (%) - Asian
Place of birth - Foreign born (%) - Hispanic or Latino
Place of birth - Foreign born (%) - American Indian and Alaska Native
Place of birth - Foreign born (%) - Multirace
Place of birth - Foreign born (%) - Other Race
Residents speaking English at home (%)
Residents speaking English at home - Born in the United States (%)
Residents speaking English at home - Native, born elsewhere (%)
Residents speaking English at home - Foreign born (%)
Residents speaking Spanish at home (%)
Residents speaking Spanish at home - Born in the United States (%)
Residents speaking Spanish at home - Native, born elsewhere (%)
Residents speaking Spanish at home - Foreign born (%)
Residents speaking other language at home (%)
Residents speaking other language at home - Born in the United States (%)
Residents speaking other language at home - Native, born elsewhere (%)
Residents speaking other language at home - Foreign born (%)
Marital status - Never married (%)
Marital status - Now married (%)
Marital status - Separated (%)
Marital status - Widowed (%)
Marital status - Divorced (%)
Ancestries Reported - Arab (%)
Ancestries Reported - Czech (%)
Ancestries Reported - Danish (%)
Ancestries Reported - Dutch (%)
Ancestries Reported - English (%)
Ancestries Reported - French (%)
Ancestries Reported - French Canadian (%)
Ancestries Reported - German (%)
Ancestries Reported - Greek (%)
Ancestries Reported - Hungarian (%)
Ancestries Reported - Irish (%)
Ancestries Reported - Italian (%)
Ancestries Reported - Lithuanian (%)
Ancestries Reported - Norwegian (%)
Ancestries Reported - Polish (%)
Ancestries Reported - Portuguese (%)
Ancestries Reported - Russian (%)
Ancestries Reported - Scotch-Irish (%)
Ancestries Reported - Scottish (%)
Ancestries Reported - Slovak (%)
Ancestries Reported - Subsaharan African (%)
Ancestries Reported - Swedish (%)
Ancestries Reported - Swiss (%)
Ancestries Reported - Ukrainian (%)
Ancestries Reported - United States (%)
Ancestries Reported - Welsh (%)
Ancestries Reported - West Indian (%)
Ancestries Reported - Other (%)
Geographical mobility - Same house 1 year ago (%)
Geographical mobility - Same house 1 year ago (%) - White
Geographical mobility - Same house 1 year ago (%) - Black or African American
Geographical mobility - Same house 1 year ago (%) - Asian
Geographical mobility - Same house 1 year ago (%) - Hispanic or Latino
Geographical mobility - Same house 1 year ago (%) - American Indian and Alaska Native
Geographical mobility - Same house 1 year ago (%) - Multirace
Geographical mobility - Same house 1 year ago (%) - Other Race
Geographical mobility - Moved within same county (%)
Geographical mobility - Moved within same county (%) - White
Geographical mobility - Moved within same county (%) - Black or African American
Geographical mobility - Moved within same county (%) - Asian
Geographical mobility - Moved within same county (%) - Hispanic or Latino
Geographical mobility - Moved within same county (%) - American Indian and Alaska Native
Geographical mobility - Moved within same county (%) - Multirace
Geographical mobility - Moved within same county (%) - Other Race
Geographical mobility - Moved from different county within same state (%)
Geographical mobility - Moved from different county within same state (%) - White
Geographical mobility - Moved from different county within same state (%) - Black or African American
Geographical mobility - Moved from different county within same state (%) - Asian
Geographical mobility - Moved from different county within same state (%) - Hispanic or Latino
Geographical mobility - Moved from different county within same state (%) - American Indian and Alaska Native
Geographical mobility - Moved from different county within same state (%) - Multirace
Geographical mobility - Moved from different county within same state (%) - Other Race
Geographical mobility - Moved from different state (%)
Geographical mobility - Moved from different state (%) - White
Geographical mobility - Moved from different state (%) - Black or African American
Geographical mobility - Moved from different state (%) - Asian
Geographical mobility - Moved from different state (%) - Hispanic or Latino
Geographical mobility - Moved from different state (%) - American Indian and Alaska Native
Geographical mobility - Moved from different state (%) - Multirace
Geographical mobility - Moved from different state (%) - Other Race
Geographical mobility - Moved from abroad (%)
Geographical mobility - Moved from abroad (%) - White
Geographical mobility - Moved from abroad (%) - Black or African American
Geographical mobility - Moved from abroad (%) - Asian
Geographical mobility - Moved from abroad (%) - Hispanic or Latino
Geographical mobility - Moved from abroad (%) - American Indian and Alaska Native
Geographical mobility - Moved from abroad (%) - Multirace
Geographical mobility - Moved from abroad (%) - Other Race
Place of birth for the foreign-born population - Ireland (%)
Place of birth for the foreign-born population - Denmark (%)
Place of birth for the foreign-born population - Norway (%)
Place of birth for the foreign-born population - Sweden (%)
Place of birth for the foreign-born population - United Kingdom (%)
Place of birth for the foreign-born population - England (%)
Place of birth for the foreign-born population - Scotland (%)
Place of birth for the foreign-born population - Other Northern Europe (%)
Place of birth for the foreign-born population - Austria (%)
Place of birth for the foreign-born population - Belgium (%)
Place of birth for the foreign-born population - France (%)
Place of birth for the foreign-born population - Germany (%)
Place of birth for the foreign-born population - Netherlands (%)
Place of birth for the foreign-born population - Switzerland (%)
Place of birth for the foreign-born population - Other Western Europe (%)
Place of birth for the foreign-born population - Greece (%)
Place of birth for the foreign-born population - Italy (%)
Place of birth for the foreign-born population - Portugal (%)
Place of birth for the foreign-born population - Spain (%)
Place of birth for the foreign-born population - Other Southern Europe (%)
Place of birth for the foreign-born population - Albania (%)
Place of birth for the foreign-born population - Belarus (%)
Place of birth for the foreign-born population - Bosnia and Herzegovina (%)
Place of birth for the foreign-born population - Bulgaria (%)
Place of birth for the foreign-born population - Croatia (%)
Place of birth for the foreign-born population - Czechoslovakia (%)
Place of birth for the foreign-born population - Hungary (%)
Place of birth for the foreign-born population - Latvia (%)
Place of birth for the foreign-born population - Lithuania (%)
Place of birth for the foreign-born population - North Macedonia (Macedonia) (%)
Place of birth for the foreign-born population - Moldova (%)
Place of birth for the foreign-born population - Poland (%)
Place of birth for the foreign-born population - Romania (%)
Place of birth for the foreign-born population - Russia (%)
Place of birth for the foreign-born population - Serbia (%)
Place of birth for the foreign-born population - Ukraine (%)
Place of birth for the foreign-born population - Other Eastern Europe (%)
Place of birth for the foreign-born population - China (%)
Place of birth for the foreign-born population - Hong Kong (%)
Place of birth for the foreign-born population - Taiwan (%)
Place of birth for the foreign-born population - Japan (%)
Place of birth for the foreign-born population - Korea (%)
Place of birth for the foreign-born population - Other Eastern Asia (%)
Place of birth for the foreign-born population - Afghanistan (%)
Place of birth for the foreign-born population - Bangladesh (%)
Place of birth for the foreign-born population - India (%)
Place of birth for the foreign-born population - Iran (%)
Place of birth for the foreign-born population - Kazakhstan (%)
Place of birth for the foreign-born population - Nepal (%)
Place of birth for the foreign-born population - Pakistan (%)
Place of birth for the foreign-born population - Sri Lanka (%)
Place of birth for the foreign-born population - Uzbekistan (%)
Place of birth for the foreign-born population - Other South Central Asia (%)
Place of birth for the foreign-born population - Burma (%)
Place of birth for the foreign-born population - Cambodia (%)
Place of birth for the foreign-born population - Indonesia (%)
Place of birth for the foreign-born population - Laos (%)
Place of birth for the foreign-born population - Malaysia (%)
Place of birth for the foreign-born population - Philippines (%)
Place of birth for the foreign-born population - Singapore (%)
Place of birth for the foreign-born population - Thailand (%)
Place of birth for the foreign-born population - Vietnam (%)
Place of birth for the foreign-born population - Other South Eastern Asia (%)
Place of birth for the foreign-born population - Armenia (%)
Place of birth for the foreign-born population - Iraq (%)
Place of birth for the foreign-born population - Israel (%)
Place of birth for the foreign-born population - Jordan (%)
Place of birth for the foreign-born population - Kuwait (%)
Place of birth for the foreign-born population - Lebanon (%)
Place of birth for the foreign-born population - Saudi Arabia (%)
Place of birth for the foreign-born population - Syria (%)
Place of birth for the foreign-born population - Turkey (%)
Place of birth for the foreign-born population - Yemen (%)
Place of birth for the foreign-born population - Other Western Asia (%)
Place of birth for the foreign-born population - Eritrea (%)
Place of birth for the foreign-born population - Ethiopia (%)
Place of birth for the foreign-born population - Kenya (%)
Place of birth for the foreign-born population - Somalia (%)
Place of birth for the foreign-born population - Uganda (%)
Place of birth for the foreign-born population - Zimbabwe (%)
Place of birth for the foreign-born population - Other Eastern Africa (%)
Place of birth for the foreign-born population - Cameroon (%)
Place of birth for the foreign-born population - Congo (%)
Place of birth for the foreign-born population - Democratic Republic of Congo (Zaire) (%)
Place of birth for the foreign-born population - Other Middle Africa (%)
Place of birth for the foreign-born population - Egypt (%)
Place of birth for the foreign-born population - Morocco (%)
Place of birth for the foreign-born population - Sudan (%)
Place of birth for the foreign-born population - Other Northern Africa (%)
Place of birth for the foreign-born population - South Africa (%)
Place of birth for the foreign-born population - Other Southern Africa (%)
Place of birth for the foreign-born population - Cabo Verde (%)
Place of birth for the foreign-born population - Ghana (%)
Place of birth for the foreign-born population - Liberia (%)
Place of birth for the foreign-born population - Nigeria (%)
Place of birth for the foreign-born population - Senegal (%)
Place of birth for the foreign-born population - Sierra Leone (%)
Place of birth for the foreign-born population - Other Western Africa (%)
Place of birth for the foreign-born population - Australia (%)
Place of birth for the foreign-born population - New Zealand (%)
Place of birth for the foreign-born population - Fiji (%)
Place of birth for the foreign-born population - Micronesia (%)
Place of birth for the foreign-born population - Bahamas (%)
Place of birth for the foreign-born population - Barbados (%)
Place of birth for the foreign-born population - Cuba (%)
Place of birth for the foreign-born population - Dominica (%)
Place of birth for the foreign-born population - Dominican Republic (%)
Place of birth for the foreign-born population - Grenada (%)
Place of birth for the foreign-born population - Haiti (%)
Place of birth for the foreign-born population - Jamaica (%)
Place of birth for the foreign-born population - St. Vincent and the Grenadines (%)
Place of birth for the foreign-born population - Trinidad and Tobago (%)
Place of birth for the foreign-born population - West Indies (%)
Place of birth for the foreign-born population - Other Caribbean (%)
Place of birth for the foreign-born population - Belize (%)
Place of birth for the foreign-born population - Costa Rica (%)
Place of birth for the foreign-born population - El Salvador (%)
Place of birth for the foreign-born population - Guatemala (%)
Place of birth for the foreign-born population - Honduras (%)
Place of birth for the foreign-born population - Mexico (%)
Place of birth for the foreign-born population - Nicaragua (%)
Place of birth for the foreign-born population - Panama (%)
Place of birth for the foreign-born population - Other Central America (%)
Place of birth for the foreign-born population - Argentina (%)
Place of birth for the foreign-born population - Bolivia (%)
Place of birth for the foreign-born population - Brazil (%)
Place of birth for the foreign-born population - Chile (%)
Place of birth for the foreign-born population - Colombia (%)
Place of birth for the foreign-born population - Ecuador (%)
Place of birth for the foreign-born population - Guyana (%)
Place of birth for the foreign-born population - Peru (%)
Place of birth for the foreign-born population - Uruguay (%)
Place of birth for the foreign-born population - Venezuela (%)
Place of birth for the foreign-born population - Other South America (%)
Place of birth for the foreign-born population - Canada (%)
Place of birth for the foreign-born population - Other Northern America (%)
Place of birth for the foreign-born population - Other (%)
Latest news about races in Woodbridge, NJ collected exclusively by city-data.com from local newspapers, TV, and radio stations
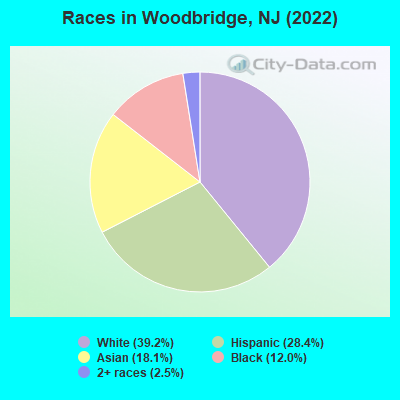
According to 2022 data, the most numerous races in Woodbridge, NJ are White alone (8,208 residents), Hispanic (5,962 residents), and Black alone (2,515 residents). 59.1% of Woodbridge residents speak English at home. 28.0% of Woodbridge, NJ residents are foreign-born (13.6% born in Asia, 10.3% born in Latin America), which is 17.9% greater than the foreign-born rate of 23.0% across the entire state of New Jersey.
Race distribution in Woodbridge
2000 2022
5,557,209 66.0% White alone 1,117,191 13.3% Hispanic 1,096,171 13.0% Black alone 477,012 5.7% Asian alone 133,689 1.6% Two or more races 19,565 0.2% Other race alone 11,338 0.1% American Indian alone 2,175 0.03% Native Hawaiian and Other
4,766,476 51.5% White alone 2,028,470 21.9% Hispanic 1,111,632 12.0% Black alone 923,546 10.0% Asian alone 332,237 3.6% Two or more races 89,847 1.0% Other race alone 8,557 0.09% American Indian alone 934 0.01% Native Hawaiian and Other
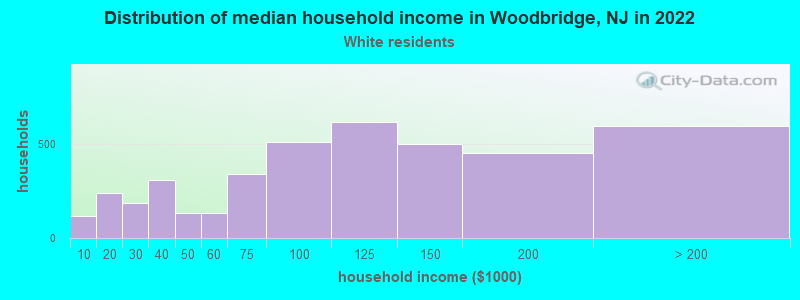
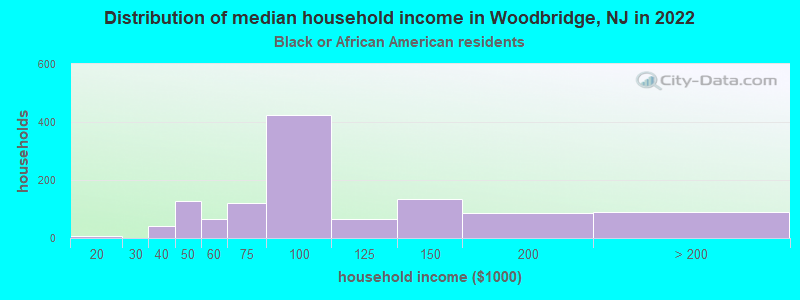
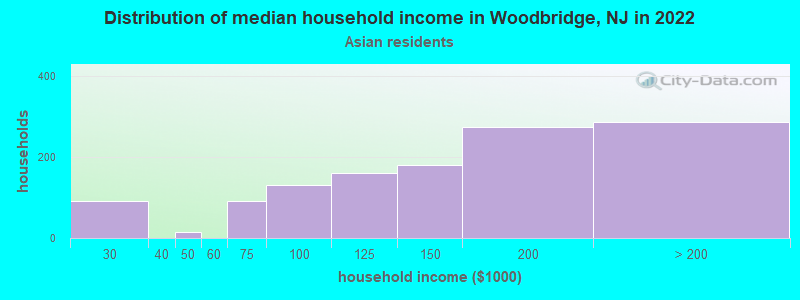
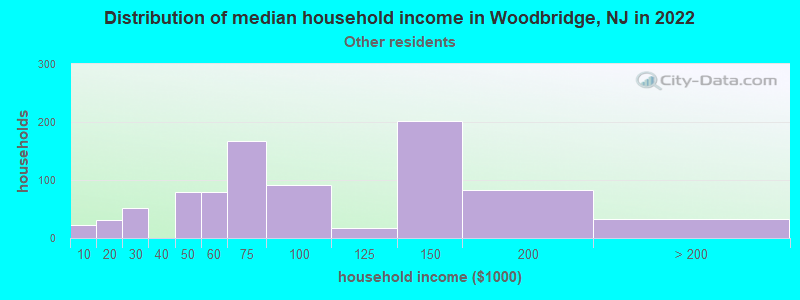
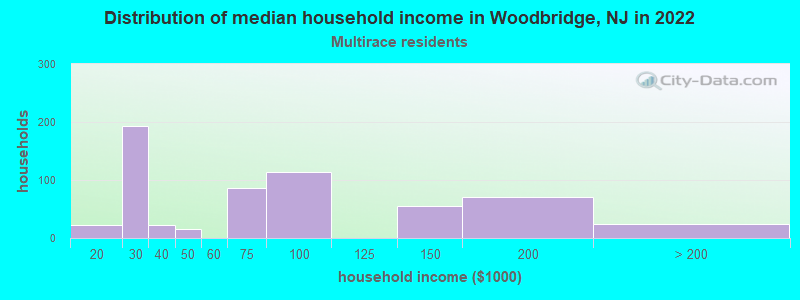
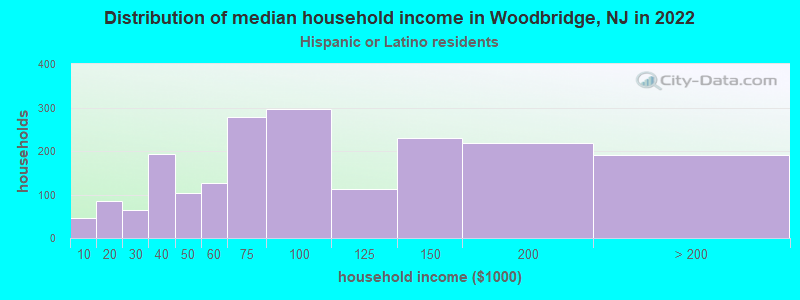
Income and house value in Woodbridge Median household income in 2022 $114,126 White non-Hispanic householders$79,937 Black householders$146,319 Asian householders$87,881 Some other race householders$82,078 Hispanic or Latino race householdersMedian 2022 house value $383,645 White Non-Hispanic householders$429,257 Black or African American householders$411,772 American Indian or Alaska Native householders $395,048 Asian householders$367,934 Some other race householders$415,067 Two or more races householders$390,740 Hispanic or Latino householders
Median age by race in Woodbridge
45.0 Median age for White residents42.0 47.3 42.0 Median age for Black or African American residents29.4 45.4 35.6 Median age for American Indian / Alaska Native residents-624,624,624.0 -739,999,999.3 34.6 Median age for Asian residents35.2 33.2 -939,393,938.5 Median age for Native Hawaiian / Pacific Islander residents-860,335,194.7 -713,070,378.3 32.7 Median age for Other race residents31.2 32.6 35.3 Median age for Two or more races residents36.2 42.4 46.7 Median age for White alone residents45.5 47.3 31.1 Median age for Hispanic or Latino residents28.9 34.8
Owner/renter occupied households by race in Woodbridge
House owners and renters - White residents 2,773 69.7% Owner occupied1,207 30.3% Renter occupiedHouse owners and renters - Black or African American residents 387 32.4% Owner occupied806 67.6% Renter occupiedHouse owners and renters - American Indian / Alaska Native residents 4 100.0% Renter occupiedHouse owners and renters - Asian residents 377 32.2% Owner occupied795 67.8% Renter occupiedHouse owners and renters - Other race residents 413 48.7% Owner occupied434 51.3% Renter occupiedHouse owners and renters - Two or more races residents 393 58.6% Owner occupied278 41.4% Renter occupiedHouse owners and renters - White alone residents 2,506 70.1% Owner occupied1,070 29.9% Renter occupiedHouse owners and renters - Hispanic or Latino residents 877 47.6% Owner occupied967 52.4% Renter occupied
Language usage in Woodbridge
English speakers - Total 59.1% of residents of Woodbridge speak English at home.
21.1% of residents speak Spanish at home 2,636 64.2% Speak English very well1,473 35.8% Speak English less than very well18.9% of residents speak other language at home 2,763 74.7% Speak English very well934 25.3% Speak English less than very well
English speakers - Born in the United States 83.0% of residents of Woodbridge speak English at home.
10.1% of residents speak Spanish at home 311 100.0% Speak English very well6.4% of residents speak other language at home 172 87.8% Speak English very well24 12.2% Speak English less than very well
English speakers - Native, born elsewhere 38.9% of residents of Woodbridge speak English at home.
55.7% of residents speak Spanish at home 147 62.6% Speak English very well88 37.4% Speak English less than very well5.9% of residents speak other language at home 17 68.0% Speak English very well8 32.0% Speak English less than very well
English speakers - Foreign-born 17.1% of residents of Woodbridge speak English at home.
32.7% of residents speak Spanish at home 819 42.2% Speak English very well1,123 57.8% Speak English less than very well49.8% of residents speak other language at home 2,107 71.3% Speak English very well848 28.7% Speak English less than very well
White (Caucasian) - Speak only English Native:
87.0% (7,168)Foreign-born:
14.6% (146)
White (Caucasian) - Speak another language Native:
10.9% (898)Foreign-born:
83.3% (833)
Black or African American - Speak only English Native:
91.6% (1,751)Foreign-born:
38.6% (252)
Black or African American - Speak another language Native:
8.3% (159)Foreign-born:
62.2% (405)
Asian - Speak only English Native:
59.6% (346)Foreign-born:
15.0% (401)
Asian - Speak another language Native:
39.8% (231)Foreign-born:
85.6% (2,290)
Other race - Speak only English Native:
25.1% (321)Foreign-born:
5.7% (70)
Other race - Speak another language Native:
73.4% (939)Foreign-born:
93.7% (1,145)
Two or more races - Speak only English Native:
68.1% (915)Foreign-born:
36.4% (132)
Two or more races - Speak another language Native:
31.5% (423)Foreign-born:
62.7% (228)
White alone - Speak only English Native:
94.2% (6,908)Foreign-born:
29.5% (159)
White alone - Speak another language Native:
5.7% (419)Foreign-born:
71.2% (385)
Hispanic or Latino - Speak only English Native:
35.4% (1,132)Foreign-born:
11.2% (248)
Hispanic or Latino - Speak another language Native:
64.2% (2,050)Foreign-born:
90.1% (1,999)
Foreign-born residents in Woodbridge 5,869 residents are foreign born (13.6% Asia , 10.3% Latin America ).
This city:
28.0%New Jersey:
23.2%
Marital status for residents in Woodbridge Marital status - White (Caucasian) population 15 years and over
Males 37.9% Never married52.0% Now married0.7% Separated1.1% Widowed8.2% DivorcedFemales 27.4% Never married47.2% Now married3.2% Separated9.5% Widowed12.7% DivorcedWomen who gave birth in the past 12 months Now married:
83.3% (53)Unmarried:
16.7% (11)
Women who did not give birth in the past 12 months Now married:
46.0% (947)Unmarried:
54.0% (1,111)
Marital status - Black or African American population 15 years and over
Males 49.5% Never married44.7% Now married0.0% Separated0.0% Widowed5.7% DivorcedFemales 34.8% Never married50.5% Now married7.0% Separated0.0% Widowed7.8% DivorcedWomen who did not give birth in the past 12 months Now married:
48.6% (282)Unmarried:
51.4% (298)
Marital status - American Indian / Alaska Native population 15 years and over
Males 100.0% Never married0.0% Now married0.0% Separated0.0% Widowed0.0% DivorcedFemales 0.0% Never married100.0% Now married0.0% Separated0.0% Widowed0.0% DivorcedMarital status - Asian population 15 years and over
Males 18.4% Never married77.4% Now married0.0% Separated0.7% Widowed3.6% DivorcedFemales 9.4% Never married80.6% Now married1.8% Separated4.4% Widowed3.8% DivorcedWomen who gave birth in the past 12 months Now married:
100.0% (95)Unmarried:
0.0% (0)
Women who did not give birth in the past 12 months Now married:
84.0% (824)Unmarried:
16.0% (156)
Marital status - Other race population 15 years and over
Males 41.7% Never married54.3% Now married4.0% Separated0.0% Widowed0.0% DivorcedFemales 34.3% Never married34.3% Now married12.2% Separated6.4% Widowed12.8% DivorcedWomen who gave birth in the past 12 months Now married:
100.0% (63)Unmarried:
0.0% (0)
Women who did not give birth in the past 12 months Now married:
45.7% (286)Unmarried:
54.3% (339)
Marital status - Two or more races population 15 years and over
Males 44.4% Never married31.3% Now married0.0% Separated0.0% Widowed24.3% DivorcedFemales 37.2% Never married43.4% Now married0.0% Separated3.3% Widowed16.1% DivorcedWomen who gave birth in the past 12 months Now married:
0.0% (0)Unmarried:
100.0% (33)
Women who did not give birth in the past 12 months Now married:
33.7% (140)Unmarried:
66.3% (276)
Marital status - White alone, not Hispanic / Latino population 15 years and over
Males 37.1% Never married52.1% Now married0.0% Separated1.4% Widowed9.4% DivorcedFemales 23.7% Never married50.5% Now married1.2% Separated10.2% Widowed14.4% DivorcedWomen who gave birth in the past 12 months Now married:
78.3% (45)Unmarried:
21.7% (13)
Women who did not give birth in the past 12 months Now married:
47.9% (763)Unmarried:
52.1% (831)
Marital status - Hispanic or Latino population 15 years and over
Males 45.7% Never married47.0% Now married3.1% Separated0.0% Widowed4.2% DivorcedFemales 36.2% Never married38.4% Now married8.1% Separated6.1% Widowed11.2% DivorcedWomen who gave birth in the past 12 months Now married:
71.6% (66)Unmarried:
28.4% (26)
Women who did not give birth in the past 12 months Now married:
43.1% (724)Unmarried:
56.9% (956)
Ancestries in Woodbridge
702 6.1% Irish589 5.2% Italian543 4.8% Polish282 2.5% American249 2.2% Hungarian247 2.2% German193 1.7% Haitian186 1.6% African107 0.9% Egyptian91 0.8% Portuguese91 0.8% Ukrainian76 0.7% Turkish75 0.7% Jamaican66 0.6% Czechoslovakian61 0.5% European61 0.5% Nigerian39 0.3% Iranian31 0.3% Russian28 0.2% Brazilian28 0.2% Slovak27 0.2% British27 0.2% Scottish26 0.2% Pennsylvania German14 0.1% Greek12 0.1% Armenian12 0.1% Finnish12 0.1% Guyanese10 0.09% Eastern European10 0.09% Norwegian9 0.08% Danish3 0.03% Scotch-Irish
Geographical mobility in Woodbridge Same house 1 year ago 8,513 90.1% White (Caucasian)2,499 87.0% Black or African American10 96.6% American Indian / Alaska Native3,326 89.6% Asian2,310 84.0% Other race1,346 76.8% Two or more races7,647 93.7% White alone, not Hispanic / Latino4,512 76.6% Hispanic or LatinoMoved within same county 545 5.8% White / Caucasian355 12.4% Black or African American175 4.7% Asian229 8.3% Other race263 15.0% Two or more races218 2.7% White alone, not Hispanic / Latino838 14.2% Hispanic or LatinoMoved within same state 209 2.2% White / Caucasian46 1.6% Black or African American50 1.3% Asian6 0.2% Other race10 0.5% Two or more races138 1.7% White alone, not Hispanic / Latino107 1.8% Hispanic or LatinoMoved from different state 151 1.6% White / Caucasian5 0.1% Asian27 1.6% Two or more races178 2.2% White alone, not Hispanic / Latino68 1.2% Hispanic or LatinoMoved from abroad 168 4.5% Asian125 4.6% Other race90 1.5% Hispanic or Latino
Children Nativity (place of birth) in Woodbridge
Children under 6 years - Living with two parents Both parents native 628 100.0% NativeBoth parents foreign-born 399 72.6% Native151 27.4% Foreign-bornOne native, one foreign-born parent 166 100.0% NativeChildren under 6 years - Living with one parent Native parent 330 100.0% NativeForeign-born parent 79 100.0% NativeChildren 6 to 17 years - Living with two parents Both parents native 830 100.0% NativeBoth parents foreign-born 543 72.3% Native208 27.7% Foreign-bornOne native, one foreign-born parent 274 100.0% NativeChildren 6 to 17 years - Living with one parent Native parent 512 100.0% NativeForeign-born parent 452 57.4% Native336 42.6% Foreign-born
Grandparents responsible for own grandchildren in Woodbridge
Grandparents (30 to 59 years) White / Caucasian 23 70.8% Responsible for grandchildren10 29.2% Not responsible for grandchildrenBlack or African American 6 24.3% Responsible for grandchildren20 75.7% Not responsible for grandchildrenAsian 12 100.0% Not responsible for grandchildrenOther race 19 100.0% Not responsible for grandchildrenHispanic or Latino 46 55.6% Responsible for grandchildren36 44.4% Not responsible for grandchildrenGrandparents (60 years and over) White / Caucasian 35 57.2% Responsible for grandchildren26 42.8% Not responsible for grandchildrenBlack or African American 36 100.0% Not responsible for grandchildrenAsian 98 100.0% Not responsible for grandchildrenOther race 7 100.0% Not responsible for grandchildrenHispanic or Latino 23 27.0% Responsible for grandchildren61 73.0% Not responsible for grandchildren