Jump to a detailed profile or search site with Google Custom Search

Williston, VT (Vermont) Houses and Residents

Estimated median house or condo value in 2022: $493,112 (it was $159,200 in 2000)
Williston:

$493,112
Vermont:

$304,700
Lower value quartile - upper value quartile: $350,686 - $717,786

Total population: 8,698 (Urban population: 3,589, Rural population: 4,061 (30 farm, 4,031 nonfarm))

Houses: 3,036 (2,921 occupied: 2,478 owner occupied, 443 renter occupied)

% of renters here:

15%
State:

26%

Housing density: 100 houses/condos per square mile

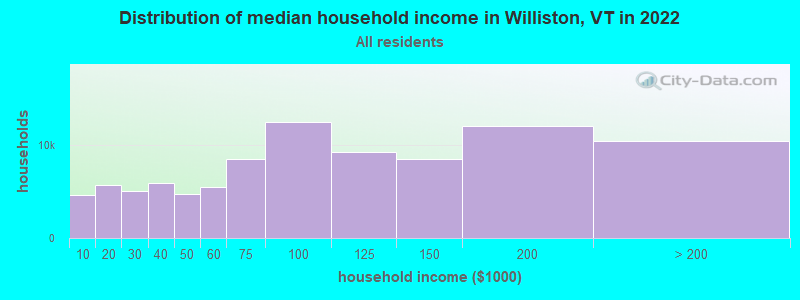
Median price asked for vacant for-sale houses and condos in 2022 in this county: $706,355.

Median contract rent in 2022: $1,682 (lower quartile is $1,195, upper quartile is over $2,000)


Median rent asked for vacant for-rent units in 2022: $1,377


Median gross rent in Williston, VT in 2022: $1,737

Housing units in Williston with a mortgage: 1,508 (38 second mortgage, 185 home equity loan, 0 both second mortgage and home equity loan)
Houses without a mortgage: 334

Compare current foreclosures near Williston, VT:

Check out more offers near Williston, VT.
Powered by Foreclosure.com


Latest news about housing in Williston, VT collected exclusively by city-data.com from local newspapers, TV, and radio stations

Williston, Vermont Age and Sex of Residents

Household type by relationship:

Households: 146,750
  • In family households: 109,943 (24,793 male householders, 11,789 female householders)
    28,660 spouses, 37,454 children (34,847 natural, 1,395 adopted, 1,212 stepchildren), 1,289 grandchildren, 800 brothers or sisters, 735 parents, foster children, 675 other relatives, 3,212 non-relatives
  • In nonfamily households: 36,807 (11,423 male householders (7,248 living alone)), 13,822 female householders (9,861 living alone)), 11,562 nonrelatives
  • In group quarters: 9,795 (1,163 institutionalized population)

25,754 married couples with children.
6,932 single-parent households (1,683 men, 5,249 women).

93.7% of residents of Williston speak English at home.
1.1% of residents speak Spanish at home (42% speak English very well, 43% speak English well, 16% speak English not well).
4.8% of residents speak other Indo-European language at home (86% speak English very well, 11% speak English well, 3% speak English not well).
0.3% of residents speak Asian or Pacific Island language at home (100% speak English very well).
0.1% of residents speak other language at home (100% speak English very well).

Foreign born population: 699 (7.9%)
(64.8% of them are naturalized citizens)

Median number of rooms in houses and condos:
Here:

6.3
State:

6.4

Median number of rooms in apartments
Here:

4.9
State:

3.9

Owner-occupied Renter-occupied
Bedrooms in owner-occupied houses and condos in Williston, Vermont
  • Bedrooms in owner-occupied houses and condos in Williston, Vermont
  • 9no bedroom
  • 361 bedroom
  • 4742 bedrooms
  • 1,1743 bedrooms
  • 7444 bedrooms
  • 415+ bedrooms
Bedrooms in renter-occupied apartments in Williston, Vermont
  • Bedrooms in renter-occupied apartments in Williston, Vermont
  • 9no bedroom
  • 1361 bedroom
  • 1382 bedrooms
  • 1433 bedrooms
  • 84 bedrooms
  • 95+ bedrooms
Owner-occupied Renter-occupied
Cars and other vehicles available in Williston in owner-occupied houses/condos
  • Cars and other vehicles available in Williston in owner-occupied houses/condos
  • 7no vehicle
  • 5981 vehicle
  • 1,3732 vehicles
  • 4013 vehicles
  • 564 vehicles
  • 435+ vehicles
Cars and other vehicles available in Williston in renter-occupied apartments
  • Cars and other vehicles available in Williston in renter-occupied apartments
  • 9no vehicle
  • 2351 vehicle
  • 1392 vehicles
  • 513 vehicles
  • 04 vehicles
  • 95+ vehicles
Owner-occupied Renter-occupied
Rooms in owner-occupied houses in Williston, Vermont
  • Rooms in owner-occupied houses in Williston, Vermont
  • 01 room
  • 02 rooms
  • 553 rooms
  • 1954 rooms
  • 3815 rooms
  • 5186 rooms
  • 5557 rooms
  • 4488 rooms
  • 3269+ rooms
Rooms in renter-occupied apartments in Williston, Vermont
  • Rooms in renter-occupied apartments in Williston, Vermont
  • 91 room
  • 92 rooms
  • 1433 rooms
  • 1064 rooms
  • 935 rooms
  • 466 rooms
  • 07 rooms
  • 98 rooms
  • 289+ rooms
Year house built
Breakdown of mean house values by ages of householders
Owners and renters by unit type in Williston, VT
  • Williston, VT household income distribution

  • Distribution of median household income in Williston, VT in 2022
  • 4,607Less than $10,000
  • 5,702$10,000 to $19,999
  • 5,116$20,000 to $29,999
  • 5,906$30,000 to $39,999
  • 4,781$40,000 to $49,999
  • 5,531$50,000 to $59,999
  • 8,561$60,000 to $74,999
  • 12,530$75,000 to $99,999
  • 9,254$100,000 to $124,999
  • 8,485$125,000 to $149,999
  • 12,048$150,000 to $199,999
  • 10,449$200,000 or more

Percentage of workers working in this county: 91.6%
Number of people working at home: 844 (16.9% of all workers)

Travel time to work (commute)

  • Less than 5 minutes: 130
  • 5 to 9 minutes: 496
  • 10 to 14 minutes: 810
  • 15 to 19 minutes: 993
  • 20 to 24 minutes: 657
  • 25 to 29 minutes: 233
  • 30 to 34 minutes: 206
  • 35 to 39 minutes: 58
  • 40 to 44 minutes: 44
  • 45 to 59 minutes: 81
  • 60 to 89 minutes: 68
  • 90 or more minutes: 62

Means of transportation to work:

  • Drove a car alone: 3,478 (85.2%)
  • Carpooled: 279 (6.8%)
  • Bicycle: 12 (0.3%)
  • Walked: 43 (1.1%)
  • Other means: 26 (0.6%)
  • Worked at home: 243 (6.0%)
Class of Workers in 2000
Year of entry for the foreign-born population in Williston, Vermont
  • Year of entry for the foreign-born population in Williston, Vermont
  • 1311995 to March 2000
  • 571990 to 1994
  • 141985 to 1989
  • 291980 to 1984
  • 161975 to 1979
  • 131970 to 1974
  • 401965 to 1969
  • 170Before 1965
Ancestries in Williston, VT

First ancestries reported:

  • English: 1,383 (16.2%)
  • Irish: 1,286 (15.0%)
  • French: 1,050 (12.3%)
  • French Canadian: 921 (10.8%)
  • German: 806 (9.4%)
  • United States: 748 (8.7%)
  • Other: 542 (6.3%)
  • Italian: 430 (5.0%)
  • Scottish: 245 (2.9%)
  • Polish: 230 (2.7%)
  • Russian: 156 (1.8%)
  • Scotch-Irish: 123 (1.4%)
  • Swedish: 93 (1.1%)
  • Welsh: 87 (1.0%)
  • Danish: 67 (0.8%)
  • Arab: 59 (0.7%)
  • Dutch: 57 (0.7%)
  • Greek: 56 (0.7%)
  • Hungarian: 47 (0.5%)
  • Portuguese: 31 (0.4%)
  • Czech: 29 (0.3%)
  • Lithuanian: 27 (0.3%)
  • Swiss: 27 (0.3%)
  • Norwegian: 21 (0.2%)
  • Subsaharan African: 21 (0.2%)
  • Slovak: 15 (0.2%)

Most common places of birth for foreign-born residents (%):

Canada
Williston:

52.6% (247)
Vermont:

34.0% (7,912)

United Kingdom
Williston:

14.5% (68)
Vermont:

7.5% (1,744)

Vietnam
Williston:

6.0% (28)
Vermont:

3.4% (796)

France
Williston:

5.3% (25)
Vermont:

1.7% (400)

Other Northern Europe
Williston:

3.8% (18)
Vermont:

1.2% (268)

Indonesia
Williston:

3.0% (14)
Vermont:

0.3% (80)

Cuba
Williston:

2.8% (13)
Vermont:

0.2% (48)

Germany
Williston:

2.1% (10)
Vermont:

7.2% (1,669)

Hong Kong
Williston:

2.1% (10)
Vermont:

0.4% (84)

Ireland
Williston:

1.7% (8)
Vermont:

1.0% (226)

Poland
Williston:

1.7% (8)
Vermont:

1.6% (381)

India
Williston:

1.7% (8)
Vermont:

2.5% (585)

Place of birth for U.S.-born residents:

  • This state: 4,087
  • Other state: 3,049
  • Northeast: 2,078
  • Midwest: 353
  • South: 432
  • West: 186

56% of Williston residents lived in the same house 5 years ago.
   Out of people who lived in different houses, 56% lived in this county.
   Out of people who lived in different counties, 16% lived in Vermont.

Education attainment for males 25 years and older:

  • No schooling: 5
  • Nursery to 4th grade: 0
  • 5th and 6th grade: 13
  • 7th and 8th grade: 75
  • 9th grade: 41
  • 10th grade: 24
  • 11th grade: 13
  • 12th grade, no diploma: 91
  • High school graduate (or equivalency): 596
  • Less than 1 year of college: 55
  • Some college more than 1 year, no degree: 176
  • Associate degree: 242
  • Bachelor's degree: 555
  • Master's degree: 293
  • Professional school degree: 148
  • Doctorate degree: 122
Educational Attainment for Males

Education attainment for females 25 years and older:

  • No schooling: 0
  • Nursery to 4th grade: 0
  • 5th and 6th grade: 0
  • 7th and 8th grade: 13
  • 9th grade: 8
  • 10th grade: 35
  • 11th grade: 49
  • 12th grade, no diploma: 58
  • High school graduate (or equivalency): 609
  • Less than 1 year of college: 127
  • Some college more than 1 year, no degree: 340
  • Associate degree: 338
  • Bachelor's degree: 787
  • Master's degree: 312
  • Professional school degree: 66
  • Doctorate degree: 41
Educational Attainment for Females
Williston marital status for males
Williston marital status for females

Housing units in structures:

  • One, detached: 2,006
  • One, attached: 384
  • Two: 125
  • 3 or 4: 137
  • 5 to 9: 37
  • 10 to 19: 18
  • 20 to 49: 9
  • 50 or more: 117
  • Mobile homes: 203

Median worth of mobile homes: $122,466

Housing units lacking complete plumbing facilities: 0.5%

Housing units lacking complete kitchen facilities: 0.5%
Year householders moved into residence in Williston
Houses and condos Apartments
Most commonly used house heating fuel in houses and condos in Williston, VT
  • 49.7%Fuel oil, kerosene, etc.
  • 33.9%Utility gas
  • 12.4%Bottled, tank, or LP gas
  • 3.0%Wood
  • 0.6%Electricity
  • 0.3%Coal or coke
Most commonly used house heating fuel in apartments in Williston, VT
  • 50.8%Utility gas
  • 43.6%Fuel oil, kerosene, etc.
  • 3.6%Bottled, tank, or LP gas
  • 2.0%Electricity

Private vs. public school enrollment:

Students in private schools in grades 1 to 8 (elementary and middle school): 147
Here:

14.4%
Vermont:

7.2%

Students in private schools in grades 9 to 12 (high school): 139
Here:

30.7%
Vermont:

10.4%

Students in private undergraduate colleges: 69
Here:

38.8%
Vermont:

37.7%
School Enrollment by Level of School for Male Students
School Enrollment by Level of School for Female Students
Age and Sex of Sensory-Disabled Noninstitutionalized Residents
Age and Sex of Physically-Disabled Noninstitutionalized Residents
Age and Sex of Mentally-Disabled Noninstitutionalized Residents
Age and Sex of Self-Care Disabled Noninstitutionalized Residents
Age and Sex of Go-Outside-Home Disabled Noninstitutionalized Residents
Age and Sex of Noninstitutionalized Residents with Employment Disability