Races in Williston, Vermont (VT) Detailed Stats
Ancestries, Foreign-born residents, place of birth

Recent posts about races in Williston, Vermont on our local forum with over 2,400,000 registered users:
 | South Burlington vs Shelburne vs Williston (0 replies) |
| Your Thoughts On Basing F-35 Jets In South Burlington (55 replies) |
| Rethinking Vermont- Cost of Living? (46 replies) |
| Rural and affordable near Burlington? (5 replies) |
| Hinesburg or Williston? (16 replies) |
| Williston Schools and CVU (4 replies) |
Latest news about races in Williston, VT collected exclusively by city-data.com from local newspapers, TV, and radio stations
6.1% of Williston, VT residents are foreign-born (3.2% born in North America, 1.9% born in Europe, 0.8% born in Asia), which is 34.9% greater than the foreign-born rate of 4.0% across the entire state of Vermont.
Race distribution in Williston

- 7,39296.6%White alone
- 921.2%Asian alone
- 731.0%Hispanic
- 430.6%Two or more races
- 350.5%Black alone
- 110.1%American Indian alone
- 30.04%Other race alone
- 10.01%Native Hawaiian and Other
Pacific Islander alone

2000
2022
-
- 585,43196.2%White alone
- 6,8091.1%Two or more races
- 5,5040.9%Hispanic
- 5,1600.8%Asian alone
- 2,9210.5%Black alone
- 2,3250.4%American Indian alone
- 5570.09%Other race alone
- 1200.02%Native Hawaiian and Other
Pacific Islander alone

-
- 583,54690.2%White alone
- 27,3404.2%Two or more races
- 14,7702.3%Hispanic
- 11,5121.8%Asian alone
- 6,2641.0%Black alone
- 2,5210.4%Other race alone
- 1,0520.2%American Indian alone
- 590.01%Native Hawaiian and Other
Pacific Islander alone

Income and house value in Williston
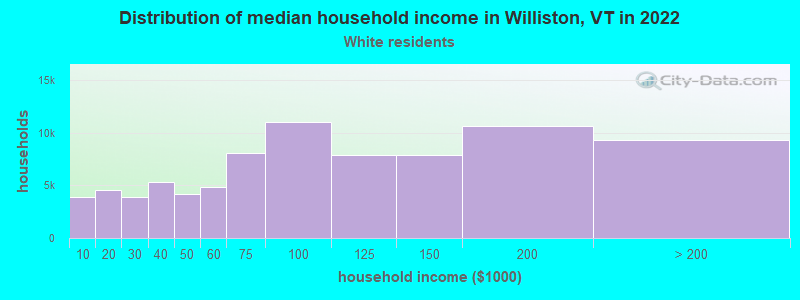
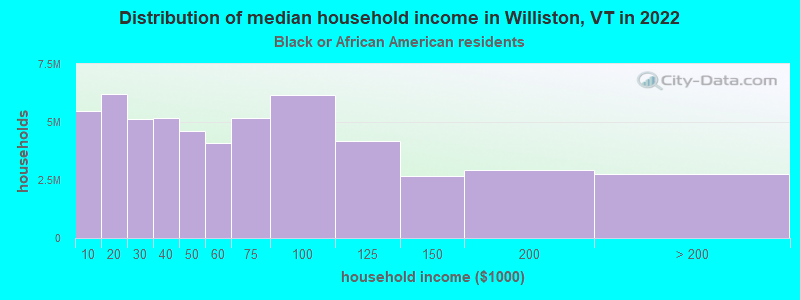
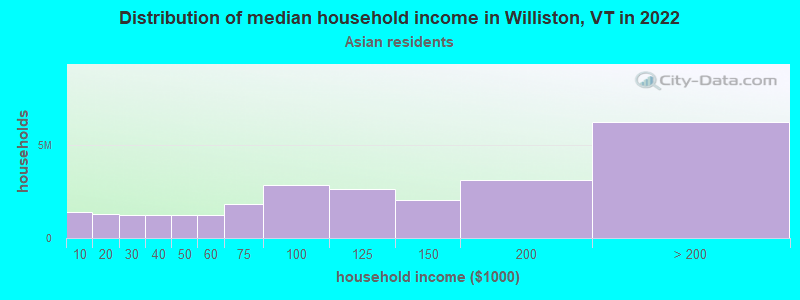
- Median household income in 2022
- $111,256White non-Hispanic householders
- $188,404Black householders
- over $200,000Asian householders
- over $200,000Hispanic or Latino race householders
- Median 2022 house value
- $495,589White Non-Hispanic householders
- over $1,000,000Black or African American householders
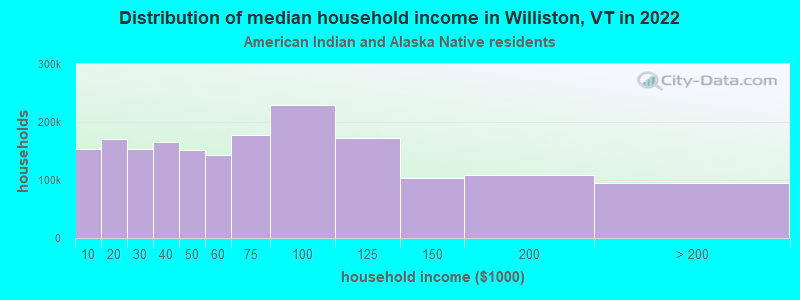
- $201,333American Indian or Alaska Native householders
- over $1,000,000Asian householders
- $580,769Hispanic or Latino householders
Household income for White non-Hispanic householders
Household income for Black householders
Household income for American Indian and Alaska Native householders
Household income for Asian householders
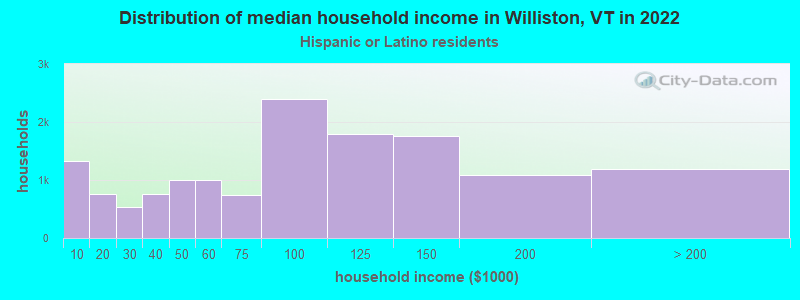
Household income for Hispanic or Latino race householders
Foreign-born residents in Williston
470 residents are foreign born (3.2% North America, 1.9% Europe, 0.8% Asia).
| This city: | 6.1% |
| Vermont: | 3.8% |
Ancestries in Williston

- 1,38316.2%English
- 1,28615.0%Irish
- 1,05012.3%French
- 92110.8%French Canadian
- 8069.4%German
- 7488.7%United States
- 5426.3%Other
- 4305.0%Italian
- 2452.9%Scottish
- 2302.7%Polish
- 1561.8%Russian
- 1231.4%Scotch-Irish
- 931.1%Swedish
- 871.0%Welsh
- 670.8%Danish
- 590.7%Arab
- 570.7%Dutch
- 560.7%Greek
- 470.5%Hungarian
- 310.4%Portuguese
- 290.3%Czech
- 270.3%Lithuanian
- 270.3%Swiss
- 210.2%Norwegian
- 210.2%Subsaharan African
- 150.2%Slovak

Zip codes: 05495.