Williamsport, PA (Pennsylvania) Houses and Residents
| Williamsport: | $145,518 |
| Pennsylvania: | $245,500 |
Total population: 29,197 (All urban)
Houses: 13,096 (10,868 occupied: 4,854 owner occupied, 6,265 renter occupied)
| % of renters here: | 56% |
| State: | 31% |
Housing density: 1,474 houses/condos per square mile
Median price asked for vacant for-sale houses and condos in 2022: $104,236.
Median contract rent in 2022: $623 (lower quartile is $503, upper quartile is $770)
Median rent asked for vacant for-rent units in 2022: $615
Median gross rent in Williamsport, PA in 2022: $738
Housing units in Williamsport with a mortgage: 3,258 (464 second mortgage, 15 home equity loan, 404 both second mortgage and home equity loan)
Houses without a mortgage: 149
Median household income for houses/condos with a mortgage: $88,566
Median household income for apartments without a mortgage: $68,287
Median monthly housing costs: $846
Compare current foreclosures in Williamsport, PA:
| Photo | Address | Area | Beds / Baths | Price | Details |
|---|---|---|---|---|---|

|
#1
Manleys Ln
Williamsport, PA 17702
|
1,120 sq. feet
|
2 baths 2 beds |
$26,000
|
show details |

|
#2
Vesta Ave
Williamsport, PA 17701
|
768 sq. feet
|
1 baths 2 beds |
$147,000
|
show details |

|
#3
Riverside Dr
Williamsport, PA 17702
|
1,776 sq. feet
|
1 baths 3 beds |
$202,500
|
show details |

|
#4
Lower Barbours Rd
Williamsport, PA 17701
|
1,680 sq. feet
|
1 baths 3 beds |
show details | |

|
#5
W Front St
Williamsport, PA 17702
|
1,190 sq. feet
|
1 baths 2 beds |
show details | |

|
#6
Freedom Rd
Williamsport, PA 17701
|
840 sq. feet
|
1 baths 2 beds |
show details | |

|
#7
Adams St
Williamsport, PA 17701
|
1,622 sq. feet
|
2 baths 3 beds |
show details | |

|
#8
W Mountain Ave
Williamsport, PA 17702
|
2,842 sq. feet
|
1 baths 3 beds |
show details | |

|
#9
Royal Ave
Williamsport, PA 17701
|
1,456 sq. feet
|
1 baths 3 beds |
show details | |

|
#10
Catherine St
Williamsport, PA 17701
|
2,749 sq. feet
|
2 baths 3 beds |
show details |
| Photo | Address | Area | Beds / Baths | Price | Details |
|---|---|---|---|---|---|

|
#11
W Front St
Williamsport, PA 17702
|
1,190 sq. feet
|
1 baths 2 beds |
show details | |

|
#12
2nd St
Williamsport, PA 17701
|
1,392 sq. feet
|
1 baths 4 beds |
show details | |

|
#13
W Southern Ave
Williamsport, PA 17702
|
896 sq. feet
|
1 baths 2 beds |
show details | |

|
#14
W Southern Ave
Williamsport, PA 17702
|
896 sq. feet
|
1 baths 2 beds |
show details | |

|
#15
Windfield Dr
Williamsport, PA 17701
|
3,842 sq. feet
|
3 baths 3 beds |
show details | |

|
#16
Terrace Ln
Williamsport, PA 17701
|
1,134 sq. feet
|
1 baths 3 beds |
show details | |

|
#17
Tucker St
Williamsport, PA 17701
|
696 sq. feet
|
1 baths 1 beds |
show details | |

|
#18
Newberry St
Williamsport, PA 17701
|
1,600 sq. feet
|
1 baths 3 beds |
show details | |

|
#19
Garden St
Williamsport, PA 17701
|
600 sq. feet
|
1 baths 2 beds |
show details | |

|
#20
Webb St
Williamsport, PA 17701
|
1,414 sq. feet
|
1 baths 3 beds |
show details |
| Photo | Address | Area | Beds / Baths | Price | Details |
|---|---|---|---|---|---|

|
#21
Franklin St
Williamsport, PA 17701
|
2,406 sq. feet
|
1 baths 3 beds |
show details | |

|
#22
Euclid Ave
Williamsport, PA 17702
|
2,315 sq. feet
|
1 baths 2 beds |
show details | |

|
#23
Grimesville Rd
Williamsport, PA 17701
|
960 sq. feet
|
1 baths 2 beds |
show details | |

|
#24
Dewey Ave
Williamsport, PA 17701
|
1,370 sq. feet
|
1 baths 3 beds |
show details | |

|
#25
Fredna Ave
Williamsport, PA 17701
|
1,868 sq. feet
|
2 baths 3 beds |
show details | |

|
#26
Mulberry St
Williamsport, PA 17701
|
1,390 sq. feet
|
1 baths 3 beds |
show details | |

|
#27
Lincoln Dr
Williamsport, PA 17701
|
1,039 sq. feet
|
1 baths 2 beds |
show details | |

|
#28
Cottage Ave
Williamsport, PA 17701
|
1,260 sq. feet
|
1 baths 2 beds |
show details | |

|
#29
Riverside Dr
Williamsport, PA 17702
|
1,184 sq. feet
|
1 baths 2 beds |
show details | |

|
#30
E Central Ave
Williamsport, PA 17702
|
1,614 sq. feet
|
1 baths 3 beds |
show details |
| Photo | Address | Area | Beds / Baths | Price | Details |
|---|---|---|---|---|---|

|
#31
Memorial Ave
Williamsport, PA 17701
|
1,296 sq. feet
|
1 baths 3 beds |
show details | |

|
#32
Casey Dr
Williamsport, PA 17701
|
2,194 sq. feet
|
1 baths 3 beds |
show details | |

|
#33
Lowmiller Rd
Williamsport, PA 17701
|
- sq. feet
|
- baths - beds |
show details | |

|
#34
W 4th St
Williamsport, PA 17701
|
- sq. feet
|
- baths - beds |
show details | |

|
#35
Scott St
Williamsport, PA 17701
|
- sq. feet
|
- baths - beds |
show details | |

|
#36
Main St
Williamsport, PA 17702
|
- sq. feet
|
- baths - beds |
show details | |

|
#37
Washington Blvd
Williamsport, PA 17701
|
- sq. feet
|
- baths - beds |
show details | |

|
#38
Hazel Dr
Williamsport, PA 17701
|
- sq. feet
|
- baths - beds |
show details | |

|
#39
W Southern Ave
Williamsport, PA 17702
|
- sq. feet
|
- baths - beds |
show details | |

|
#40
W Southern Ave Apt 2
Williamsport, PA 17702
|
- sq. feet
|
- baths - beds |
show details |
| Photo | Address | Area | Beds / Baths | Price | Details |
|---|---|---|---|---|---|

|
#41
W Southern Ave
Williamsport, PA 17702
|
- sq. feet
|
- baths - beds |
show details | |

|
#42
W 4th St
Williamsport, PA 17701
|
- sq. feet
|
- baths - beds |
show details | |

|
Check over 1 million property listings on Foreclosure.com!
|
browse all offers | |||

Latest news about housing in Williamsport, PA collected exclusively by city-data.com from local newspapers, TV, and radio stations

 | Lancaster, Easton, Williamsport - please compare (34 replies) |
| Houses for rent in Williamsport PA area? (10 replies) |
| Living in/near Cogan Station (North of Williamsport) (2 replies) |
| Williamsport ??? (5 replies) |
| PA Location: Rental Houses, Woods, Many Jobs? (3 replies) |
| Affordable "small" towns with beautiful houses and downtowns? (58 replies) |

Median year apartment built: 1947
Household type by relationship:
Households: 27,531- Male householders: 4,994 (1,934 living alone), Female householders: 5,784 (2,113 living alone)
3,133 spouses (3,127 opposite-sex spouses), 1,350 unmarried partners, (1,261 opposite-sex unmarried partners), 6,757 children (6,351 natural, 120 adopted, 285 stepchildren), 379 grandchildren, 190 brothers or sisters, 203 parents, 54 foster children, 200 other relatives, 1,008 non-relatives
- In group quarters: 3,474
Size of family households: 2,390 2-persons, 1,318 3-persons, 1,207 4-persons, 390 5-persons, 129 6-persons, 127 7-or-more-persons.
Size of nonfamily households: 4,394 1-person, 873 2-persons, 229 3-persons, 55 4-persons, 7 5-persons.
1,973 married couples with children.
2,819 single-parent households (566 men, 2,253 women).
94.6% of residents of Williamsport speak English at home.
1.9% of residents speak Spanish at home (80% speak English very well, 12% speak English well, 8% speak English not well).
1.9% of residents speak other Indo-European language at home (61% speak English very well, 39% speak English well).
0.6% of residents speak Asian or Pacific Island language at home (78% speak English very well, 22% speak English well).
0.3% of residents speak other language at home (100% speak English very well).
Foreign born population: 564 (2.0%)
(41.8% of them are naturalized citizens)
| Here: | 6.8 |
| State: | 6.8 |
| Here: | 4.1 |
| State: | 4.3 |

- Bedrooms in owner-occupied houses and condos in Williamsport, Pennsylvania
- 14no bedroom
- 991 bedroom
- 5362 bedrooms
- 3,0453 bedrooms
- 9054 bedrooms
- 2565+ bedrooms

- Bedrooms in renter-occupied apartments in Williamsport, Pennsylvania
- 518no bedroom
- 1,9901 bedroom
- 1,7932 bedrooms
- 1,5433 bedrooms
- 3594 bedrooms
- 615+ bedrooms

- Cars and other vehicles available in Williamsport in owner-occupied houses/condos
- 58no vehicle
- 1,6711 vehicle
- 2,0592 vehicles
- 7143 vehicles
- 2494 vehicles
- 1035+ vehicles

- Cars and other vehicles available in Williamsport in renter-occupied apartments
- 2,285no vehicle
- 2,5251 vehicle
- 1,1402 vehicles
- 2203 vehicles
- 594 vehicles
- 365+ vehicles

- Rooms in owner-occupied houses in Williamsport, Pennsylvania
- 141 room
- 02 rooms
- 193 rooms
- 3434 rooms
- 5575 rooms
- 1,2526 rooms
- 9697 rooms
- 7138 rooms
- 9889+ rooms

- Rooms in renter-occupied apartments in Williamsport, Pennsylvania
- 5071 room
- 3202 rooms
- 1,1713 rooms
- 1,4064 rooms
- 9235 rooms
- 9316 rooms
- 4627 rooms
- 2788 rooms
- 2679+ rooms


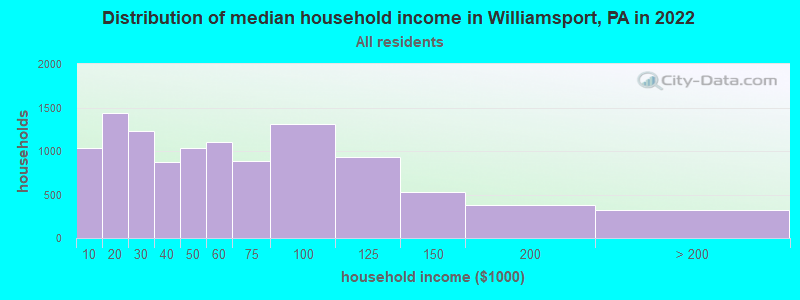
Williamsport, PA household income distribution

- 1,031Less than $10,000
- 1,438$10,000 to $19,999
- 1,225$20,000 to $29,999
- 879$30,000 to $39,999
- 1,034$40,000 to $49,999
- 1,107$50,000 to $59,999
- 886$60,000 to $74,999
- 1,307$75,000 to $99,999
- 928$100,000 to $124,999
- 532$125,000 to $149,999
- 379$150,000 to $199,999
- 324$200,000 or more
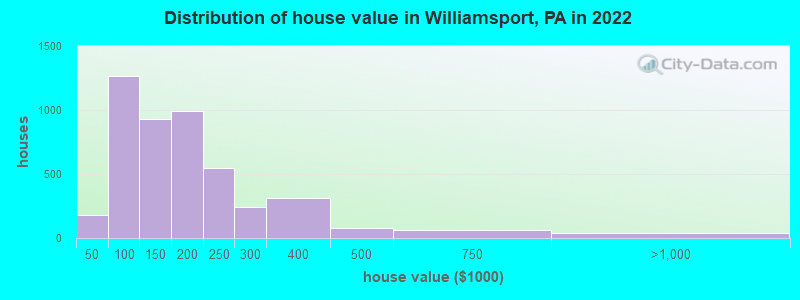
Home value of owner - occupied houses in 2022 in Williamsport, PA
-
- 43Less than $10,000
- 25$15,000 to $19,999
- 13$20,000 to $24,999
- 7$25,000 to $29,999
- 88$40,000 to $49,999
- 114$50,000 to $59,999
- 352$60,000 to $69,999
- 140$70,000 to $79,999
- 250$80,000 to $89,999
- 314$90,000 to $99,999
- 583$100,000 to $124,999
- 346$125,000 to $149,999
- 664$150,000 to $174,999
- 325$175,000 to $199,999
- 550$200,000 to $249,999
- 240$250,000 to $299,999
- 311$300,000 to $399,999
- 76$400,000 to $499,999
- 65$500,000 to $749,999
- 21$750,000 to $999,999
- 14$1,000,000 to $1,499,999
Rent paid by renters in 2022 in Williamsport, PA
-
- 88Less than $100
- 356$100 to $149
- 94$150 to $199
- 67$200 to $249
- 151$250 to $299
- 21$300 to $349
- 67$350 to $399
- 101$400 to $449
- 223$450 to $499
- 897$500 to $549
- 430$550 to $599
- 754$600 to $649
- 687$650 to $699
- 610$700 to $749
- 207$750 to $799
- 768$800 to $899
- 222$900 to $999
- 343$1,000 to $1,249
- 39$1,250 to $1,499
- 3$1,500 to $1,999
- 109$2,000 to $2,499
- 30$3,000 to $3,499
- 178No cash rent


Percentage of workers working in this county: 87.3%
Number of people working at home: 1,330 (10.5% of all workers)
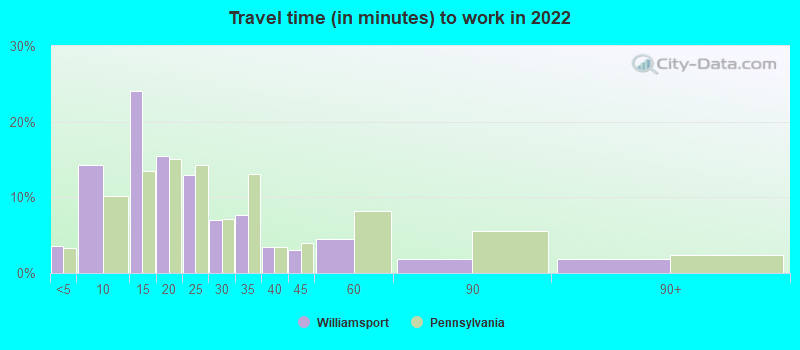
Travel time to work (commute)
- Less than 5 minutes: 637
- 5 to 9 minutes: 2,463
- 10 to 14 minutes: 2,789
- 15 to 19 minutes: 1,785
- 20 to 24 minutes: 1,256
- 25 to 29 minutes: 517
- 30 to 34 minutes: 571
- 35 to 39 minutes: 130
- 40 to 44 minutes: 347
- 45 to 59 minutes: 268
- 60 to 89 minutes: 191
- 90 or more minutes: 184
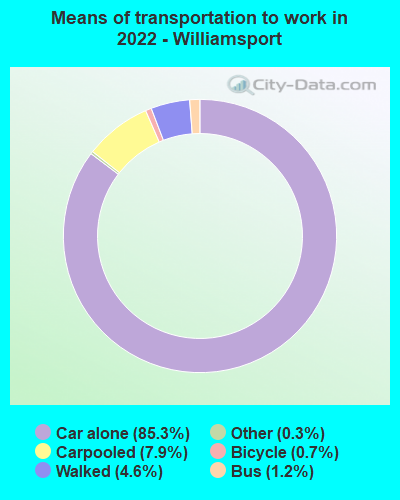
Means of transportation to work:
- Drove a car alone: 17,446 (79.4%)
- Carpooled: 1,710 (7.8%)
- Bus: 263 (1.2%)
- Taxi: 103 (0.5%)
- Bicycle: 95 (0.4%)
- Walked: 739 (3.4%)
- Worked at home: 1,330 (6.1%)

- Unemployment by race in 2022
- Unemployment rate for White non-Hispanic residents
- 3.6%Males
- 3.3%Females
- Unemployment rate for Black residents
- 15.1%Males
- 12.2%Females
- Unemployment rate for American Indian and Alaska Native residents
- 12.5%Males
- Unemployment rate for two or more race residents
- 17.7%Males
- 14.9%Females
- Unemployment rate for Hispanic or Latino residents
- 18.4%Males
- 4.5%Females

- Year of entry for the foreign-born population in Williamsport, Pennsylvania
- 3392010 or later
- 1882000 to 2009
- 671990 to 1999
- 1171980 to 1989
- 661970 to 1979
- 134Before 1970

First ancestries reported:
- German: 2,505 (22.6%)
- Italian: 1,019 (9.2%)
- American: 872 (7.9%)
- Irish: 838 (7.6%)
- English: 746 (6.7%)
- Polish: 221 (2.0%)
- European: 217 (2.0%)
- Pennsylvania German: 181 (1.6%)
- Haitian: 138 (1.2%)
- Scottish: 131 (1.2%)
- French: 114 (1.0%)
- Slovak: 59 (0.5%)
- Dutch: 53 (0.5%)
- Nigerian: 44 (0.4%)
- Scotch-Irish: 40 (0.4%)
- Welsh: 40 (0.4%)
- Liberian: 33 (0.3%)
- Belizean: 33 (0.3%)
- Russian: 31 (0.3%)
- African: 31 (0.3%)
- Greek: 27 (0.2%)
- Latvian: 26 (0.2%)
- West Indian: 25 (0.2%)
- Eastern European: 23 (0.2%)
- Hungarian: 21 (0.2%)
- Canadian: 18 (0.2%)
- Norwegian: 18 (0.2%)
- Swiss: 18 (0.2%)
- Bahamian: 16 (0.1%)
- French Canadian: 15 (0.1%)
- Northern European: 13 (0.1%)
- Portuguese: 10 (0.09%)
- Danish: 9 (0.08%)
- Ukrainian: 9 (0.08%)
- Jamaican: 9 (0.08%)
- Syrian: 8 (0.07%)
- British: 8 (0.07%)
- Austrian: 6 (0.05%)
- Trinidadian and Tobagonian: 5 (0.05%)
- Kenyan: 4 (0.04%)
Most common places of birth for foreign-born residents (%):
| Williamsport: | 16.5% (116) |
| Pennsylvania: | 1.6% (15,224) |
| Williamsport: | 12.9% (91) |
| Pennsylvania: | 7.2% (67,704) |
| Williamsport: | 11.1% (78) |
| Pennsylvania: | 2.2% (21,039) |
| Williamsport: | 8.7% (61) |
| Pennsylvania: | 1.9% (18,065) |
| Williamsport: | 5.0% (35) |
| Pennsylvania: | 0.2% (2,004) |
| Williamsport: | 4.4% (31) |
| Pennsylvania: | 1.2% (11,211) |
| Williamsport: | 4.0% (28) |
| Pennsylvania: | 1.4% (12,910) |
| Williamsport: | 3.1% (22) |
| Pennsylvania: | 0.1% (564) |
| Williamsport: | 3.0% (21) |
| Pennsylvania: | 0.4% (4,113) |
| Williamsport: | 2.6% (18) |
| Pennsylvania: | 0.8% (7,224) |
| Williamsport: | 1.7% (12) |
| Pennsylvania: | 0.2% (1,557) |
Place of birth for U.S.-born residents:
- This state: 21,961
- Other state: 4,833
- Northeast: 2,251
- Midwest: 380
- South: 1,878
- West: 335
83.3% of Williamsport residents lived in the same house 1 years ago.
Out of people who lived in different houses, 32.7% lived in this county.
Out of people who lived in different counties, 60.4% lived in Pennsylvania.
| Williamsport: | 83.3% |
| State average: | 89.3% |
Education attainment for males 25 years and older:
- No schooling: 30
- Nursery to 4th grade: 0
- 5th and 6th grade: 0
- 7th and 8th grade: 84
- 9th grade: 50
- 10th grade: 202
- 11th grade: 178
- 12th grade, no diploma: 199
- High school graduate (or equivalency): 2,861
- Less than 1 year of college: 282
- Some college more than 1 year, no degree: 1,001
- Associate degree: 895
- Bachelor's degree: 1,276
- Master's degree: 455
- Professional school degree: 148
- Doctorate degree: 168

Education attainment for females 25 years and older:
- No schooling: 185
- Nursery to 4th grade: 0
- 5th and 6th grade: 75
- 7th and 8th grade: 63
- 9th grade: 123
- 10th grade: 188
- 11th grade: 232
- 12th grade, no diploma: 155
- High school graduate (or equivalency): 2,962
- Less than 1 year of college: 441
- Some college more than 1 year, no degree: 732
- Associate degree: 970
- Bachelor's degree: 1,268
- Master's degree: 756
- Professional school degree: 203
- Doctorate degree: 110


Housing units in structures:
- One, detached: 5,809
- One, attached: 1,900
- Two: 1,463
- 3 or 4: 1,188
- 5 to 9: 1,023
- 10 to 19: 546
- 20 to 49: 634
- 50 or more: 516
- Mobile homes: 15
Housing units lacking complete kitchen facilities in 2022: 5.2%
House/condo owner moved in on average 12 years ago
Renter moved in on average 2 years ago

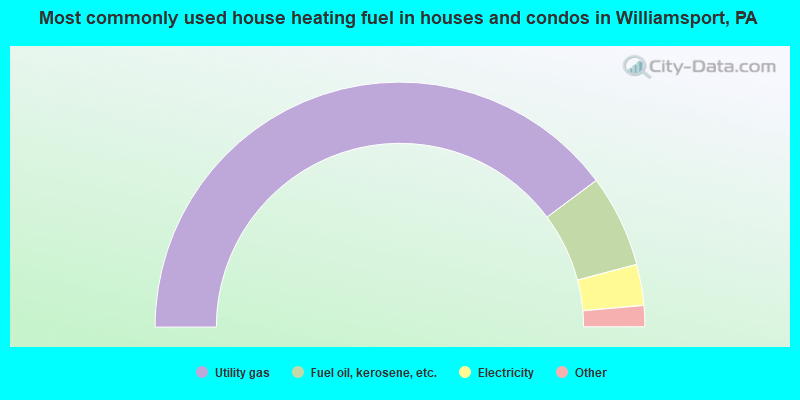
- 79.6%Utility gas
- 12.2%Fuel oil, kerosene, etc.
- 5.4%Electricity
- 0.7%Other fuel
- 0.7%Bottled, tank, or LP gas
- 0.6%Coal or coke
- 0.5%No fuel used
- 0.3%Wood
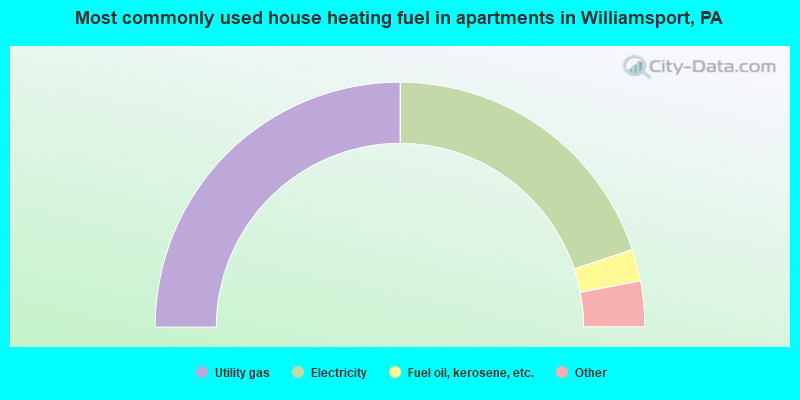
- 50.0%Utility gas
- 39.7%Electricity
- 4.2%Fuel oil, kerosene, etc.
- 3.2%Bottled, tank, or LP gas
- 1.5%No fuel used
- 0.9%Coal or coke
- 0.3%Wood
Private vs. public school enrollment:
| Here: | 6.4% |
| Pennsylvania: | 15.7% |
| Here: | 22.7% |
| Pennsylvania: | 13.4% |
| Here: | 41.5% |
| Pennsylvania: | 39.8% |


