Races in Williamsport, Pennsylvania (PA) Detailed Stats
Data:
Races - White alone (%)
Races - White alone (% change since 2000)
Races - Black alone (%)
Races - Black alone (% change since 2000)
Races - American Indian alone (%)
Races - American Indian alone (% change since 2000)
Races - Asian alone (%)
Races - Asian alone (% change since 2000)
Races - Hispanic (%)
Races - Hispanic (% change since 2000)
Races - Native Hawaiian and Other Pacific Islander alone (%)
Races - Native Hawaiian and Other Pacific Islander alone (% change since 2000)
Races - Two or more races(%)
Races - Two or more races(% change since 2000)
Races - Other race alone (%)
Races - Other race alone (% change since 2000)
Racial diversity
Place of birth - Born in state of residence (%)
Place of birth - Born in state of residence (%) - White
Place of birth - Born in state of residence (%) - Black or African American
Place of birth - Born in state of residence (%) - Asian
Place of birth - Born in state of residence (%) - Hispanic or Latino
Place of birth - Born in state of residence (%) - American Indian and Alaska Native
Place of birth - Born in state of residence (%) - Multirace
Place of birth - Born in state of residence (%) - Other Race
Place of birth - Born in other state (%)
Place of birth - Born in other state (%) - White
Place of birth - Born in other state (%) - Black or African American
Place of birth - Born in other state (%) - Asian
Place of birth - Born in other state (%) - Hispanic or Latino
Place of birth - Born in other state (%) - American Indian and Alaska Native
Place of birth - Born in other state (%) - Multirace
Place of birth - Born in other state (%) - Other Race
Place of birth - Native, outside of US (%)
Place of birth - Native, outside of US (%) - White
Place of birth - Native, outside of US (%) - Black or African American
Place of birth - Native, outside of US (%) - Asian
Place of birth - Native, outside of US (%) - Hispanic or Latino
Place of birth - Native, outside of US (%) - American Indian and Alaska Native
Place of birth - Native, outside of US (%) - Multirace
Place of birth - Native, outside of US (%) - Other Race
Place of birth - Foreign born (%)
Place of birth - Foreign born (%) - White
Place of birth - Foreign born (%) - Black or African American
Place of birth - Foreign born (%) - Asian
Place of birth - Foreign born (%) - Hispanic or Latino
Place of birth - Foreign born (%) - American Indian and Alaska Native
Place of birth - Foreign born (%) - Multirace
Place of birth - Foreign born (%) - Other Race
Residents speaking English at home (%)
Residents speaking English at home - Born in the United States (%)
Residents speaking English at home - Native, born elsewhere (%)
Residents speaking English at home - Foreign born (%)
Residents speaking Spanish at home (%)
Residents speaking Spanish at home - Born in the United States (%)
Residents speaking Spanish at home - Native, born elsewhere (%)
Residents speaking Spanish at home - Foreign born (%)
Residents speaking other language at home (%)
Residents speaking other language at home - Born in the United States (%)
Residents speaking other language at home - Native, born elsewhere (%)
Residents speaking other language at home - Foreign born (%)
Marital status - Never married (%)
Marital status - Now married (%)
Marital status - Separated (%)
Marital status - Widowed (%)
Marital status - Divorced (%)
Ancestries Reported - Arab (%)
Ancestries Reported - Czech (%)
Ancestries Reported - Danish (%)
Ancestries Reported - Dutch (%)
Ancestries Reported - English (%)
Ancestries Reported - French (%)
Ancestries Reported - French Canadian (%)
Ancestries Reported - German (%)
Ancestries Reported - Greek (%)
Ancestries Reported - Hungarian (%)
Ancestries Reported - Irish (%)
Ancestries Reported - Italian (%)
Ancestries Reported - Lithuanian (%)
Ancestries Reported - Norwegian (%)
Ancestries Reported - Polish (%)
Ancestries Reported - Portuguese (%)
Ancestries Reported - Russian (%)
Ancestries Reported - Scotch-Irish (%)
Ancestries Reported - Scottish (%)
Ancestries Reported - Slovak (%)
Ancestries Reported - Subsaharan African (%)
Ancestries Reported - Swedish (%)
Ancestries Reported - Swiss (%)
Ancestries Reported - Ukrainian (%)
Ancestries Reported - United States (%)
Ancestries Reported - Welsh (%)
Ancestries Reported - West Indian (%)
Ancestries Reported - Other (%)
Geographical mobility - Same house 1 year ago (%)
Geographical mobility - Same house 1 year ago (%) - White
Geographical mobility - Same house 1 year ago (%) - Black or African American
Geographical mobility - Same house 1 year ago (%) - Asian
Geographical mobility - Same house 1 year ago (%) - Hispanic or Latino
Geographical mobility - Same house 1 year ago (%) - American Indian and Alaska Native
Geographical mobility - Same house 1 year ago (%) - Multirace
Geographical mobility - Same house 1 year ago (%) - Other Race
Geographical mobility - Moved within same county (%)
Geographical mobility - Moved within same county (%) - White
Geographical mobility - Moved within same county (%) - Black or African American
Geographical mobility - Moved within same county (%) - Asian
Geographical mobility - Moved within same county (%) - Hispanic or Latino
Geographical mobility - Moved within same county (%) - American Indian and Alaska Native
Geographical mobility - Moved within same county (%) - Multirace
Geographical mobility - Moved within same county (%) - Other Race
Geographical mobility - Moved from different county within same state (%)
Geographical mobility - Moved from different county within same state (%) - White
Geographical mobility - Moved from different county within same state (%) - Black or African American
Geographical mobility - Moved from different county within same state (%) - Asian
Geographical mobility - Moved from different county within same state (%) - Hispanic or Latino
Geographical mobility - Moved from different county within same state (%) - American Indian and Alaska Native
Geographical mobility - Moved from different county within same state (%) - Multirace
Geographical mobility - Moved from different county within same state (%) - Other Race
Geographical mobility - Moved from different state (%)
Geographical mobility - Moved from different state (%) - White
Geographical mobility - Moved from different state (%) - Black or African American
Geographical mobility - Moved from different state (%) - Asian
Geographical mobility - Moved from different state (%) - Hispanic or Latino
Geographical mobility - Moved from different state (%) - American Indian and Alaska Native
Geographical mobility - Moved from different state (%) - Multirace
Geographical mobility - Moved from different state (%) - Other Race
Geographical mobility - Moved from abroad (%)
Geographical mobility - Moved from abroad (%) - White
Geographical mobility - Moved from abroad (%) - Black or African American
Geographical mobility - Moved from abroad (%) - Asian
Geographical mobility - Moved from abroad (%) - Hispanic or Latino
Geographical mobility - Moved from abroad (%) - American Indian and Alaska Native
Geographical mobility - Moved from abroad (%) - Multirace
Geographical mobility - Moved from abroad (%) - Other Race
Place of birth for the foreign-born population - Ireland (%)
Place of birth for the foreign-born population - Denmark (%)
Place of birth for the foreign-born population - Norway (%)
Place of birth for the foreign-born population - Sweden (%)
Place of birth for the foreign-born population - United Kingdom (%)
Place of birth for the foreign-born population - England (%)
Place of birth for the foreign-born population - Scotland (%)
Place of birth for the foreign-born population - Other Northern Europe (%)
Place of birth for the foreign-born population - Austria (%)
Place of birth for the foreign-born population - Belgium (%)
Place of birth for the foreign-born population - France (%)
Place of birth for the foreign-born population - Germany (%)
Place of birth for the foreign-born population - Netherlands (%)
Place of birth for the foreign-born population - Switzerland (%)
Place of birth for the foreign-born population - Other Western Europe (%)
Place of birth for the foreign-born population - Greece (%)
Place of birth for the foreign-born population - Italy (%)
Place of birth for the foreign-born population - Portugal (%)
Place of birth for the foreign-born population - Spain (%)
Place of birth for the foreign-born population - Other Southern Europe (%)
Place of birth for the foreign-born population - Albania (%)
Place of birth for the foreign-born population - Belarus (%)
Place of birth for the foreign-born population - Bosnia and Herzegovina (%)
Place of birth for the foreign-born population - Bulgaria (%)
Place of birth for the foreign-born population - Croatia (%)
Place of birth for the foreign-born population - Czechoslovakia (%)
Place of birth for the foreign-born population - Hungary (%)
Place of birth for the foreign-born population - Latvia (%)
Place of birth for the foreign-born population - Lithuania (%)
Place of birth for the foreign-born population - North Macedonia (Macedonia) (%)
Place of birth for the foreign-born population - Moldova (%)
Place of birth for the foreign-born population - Poland (%)
Place of birth for the foreign-born population - Romania (%)
Place of birth for the foreign-born population - Russia (%)
Place of birth for the foreign-born population - Serbia (%)
Place of birth for the foreign-born population - Ukraine (%)
Place of birth for the foreign-born population - Other Eastern Europe (%)
Place of birth for the foreign-born population - China (%)
Place of birth for the foreign-born population - Hong Kong (%)
Place of birth for the foreign-born population - Taiwan (%)
Place of birth for the foreign-born population - Japan (%)
Place of birth for the foreign-born population - Korea (%)
Place of birth for the foreign-born population - Other Eastern Asia (%)
Place of birth for the foreign-born population - Afghanistan (%)
Place of birth for the foreign-born population - Bangladesh (%)
Place of birth for the foreign-born population - India (%)
Place of birth for the foreign-born population - Iran (%)
Place of birth for the foreign-born population - Kazakhstan (%)
Place of birth for the foreign-born population - Nepal (%)
Place of birth for the foreign-born population - Pakistan (%)
Place of birth for the foreign-born population - Sri Lanka (%)
Place of birth for the foreign-born population - Uzbekistan (%)
Place of birth for the foreign-born population - Other South Central Asia (%)
Place of birth for the foreign-born population - Burma (%)
Place of birth for the foreign-born population - Cambodia (%)
Place of birth for the foreign-born population - Indonesia (%)
Place of birth for the foreign-born population - Laos (%)
Place of birth for the foreign-born population - Malaysia (%)
Place of birth for the foreign-born population - Philippines (%)
Place of birth for the foreign-born population - Singapore (%)
Place of birth for the foreign-born population - Thailand (%)
Place of birth for the foreign-born population - Vietnam (%)
Place of birth for the foreign-born population - Other South Eastern Asia (%)
Place of birth for the foreign-born population - Armenia (%)
Place of birth for the foreign-born population - Iraq (%)
Place of birth for the foreign-born population - Israel (%)
Place of birth for the foreign-born population - Jordan (%)
Place of birth for the foreign-born population - Kuwait (%)
Place of birth for the foreign-born population - Lebanon (%)
Place of birth for the foreign-born population - Saudi Arabia (%)
Place of birth for the foreign-born population - Syria (%)
Place of birth for the foreign-born population - Turkey (%)
Place of birth for the foreign-born population - Yemen (%)
Place of birth for the foreign-born population - Other Western Asia (%)
Place of birth for the foreign-born population - Eritrea (%)
Place of birth for the foreign-born population - Ethiopia (%)
Place of birth for the foreign-born population - Kenya (%)
Place of birth for the foreign-born population - Somalia (%)
Place of birth for the foreign-born population - Uganda (%)
Place of birth for the foreign-born population - Zimbabwe (%)
Place of birth for the foreign-born population - Other Eastern Africa (%)
Place of birth for the foreign-born population - Cameroon (%)
Place of birth for the foreign-born population - Congo (%)
Place of birth for the foreign-born population - Democratic Republic of Congo (Zaire) (%)
Place of birth for the foreign-born population - Other Middle Africa (%)
Place of birth for the foreign-born population - Egypt (%)
Place of birth for the foreign-born population - Morocco (%)
Place of birth for the foreign-born population - Sudan (%)
Place of birth for the foreign-born population - Other Northern Africa (%)
Place of birth for the foreign-born population - South Africa (%)
Place of birth for the foreign-born population - Other Southern Africa (%)
Place of birth for the foreign-born population - Cabo Verde (%)
Place of birth for the foreign-born population - Ghana (%)
Place of birth for the foreign-born population - Liberia (%)
Place of birth for the foreign-born population - Nigeria (%)
Place of birth for the foreign-born population - Senegal (%)
Place of birth for the foreign-born population - Sierra Leone (%)
Place of birth for the foreign-born population - Other Western Africa (%)
Place of birth for the foreign-born population - Australia (%)
Place of birth for the foreign-born population - New Zealand (%)
Place of birth for the foreign-born population - Fiji (%)
Place of birth for the foreign-born population - Micronesia (%)
Place of birth for the foreign-born population - Bahamas (%)
Place of birth for the foreign-born population - Barbados (%)
Place of birth for the foreign-born population - Cuba (%)
Place of birth for the foreign-born population - Dominica (%)
Place of birth for the foreign-born population - Dominican Republic (%)
Place of birth for the foreign-born population - Grenada (%)
Place of birth for the foreign-born population - Haiti (%)
Place of birth for the foreign-born population - Jamaica (%)
Place of birth for the foreign-born population - St. Vincent and the Grenadines (%)
Place of birth for the foreign-born population - Trinidad and Tobago (%)
Place of birth for the foreign-born population - West Indies (%)
Place of birth for the foreign-born population - Other Caribbean (%)
Place of birth for the foreign-born population - Belize (%)
Place of birth for the foreign-born population - Costa Rica (%)
Place of birth for the foreign-born population - El Salvador (%)
Place of birth for the foreign-born population - Guatemala (%)
Place of birth for the foreign-born population - Honduras (%)
Place of birth for the foreign-born population - Mexico (%)
Place of birth for the foreign-born population - Nicaragua (%)
Place of birth for the foreign-born population - Panama (%)
Place of birth for the foreign-born population - Other Central America (%)
Place of birth for the foreign-born population - Argentina (%)
Place of birth for the foreign-born population - Bolivia (%)
Place of birth for the foreign-born population - Brazil (%)
Place of birth for the foreign-born population - Chile (%)
Place of birth for the foreign-born population - Colombia (%)
Place of birth for the foreign-born population - Ecuador (%)
Place of birth for the foreign-born population - Guyana (%)
Place of birth for the foreign-born population - Peru (%)
Place of birth for the foreign-born population - Uruguay (%)
Place of birth for the foreign-born population - Venezuela (%)
Place of birth for the foreign-born population - Other South America (%)
Place of birth for the foreign-born population - Canada (%)
Place of birth for the foreign-born population - Other Northern America (%)
Place of birth for the foreign-born population - Other (%)
Latest news about races in Williamsport, PA collected exclusively by city-data.com from local newspapers, TV, and radio stations
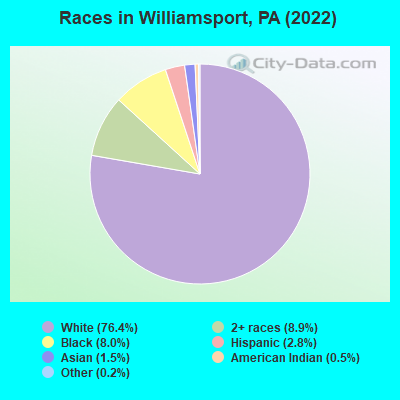
According to 2022 data, the most numerous races in Williamsport, PA are White alone (21,047 residents), Black alone (2,191 residents), and Hispanic (770 residents). 95.0% of Williamsport residents speak English at home. 2.6% of Williamsport, PA residents are foreign-born (0.9% born in Latin America, 0.9% born in Asia, 0.6% born in Europe), which is 173.8% less than the foreign-born rate of 7.0% across the entire state of Pennsylvania.
Race distribution in Williamsport
2000 2022
10,322,455 84.1% White alone 1,202,437 9.8% Black alone 394,088 3.2% Hispanic 218,296 1.8% Asian alone 113,097 0.9% Two or more races 13,086 0.1% Other race alone 14,904 0.1% American Indian alone 2,691 0.02% Native Hawaiian and Other
9,487,228 73.1% White alone 1,311,581 10.1% Black alone 1,115,997 8.6% Hispanic 493,942 3.8% Two or more races 487,124 3.8% Asian alone 63,582 0.5% Other race alone 10,130 0.08% American Indian alone 2,424 0.02% Native Hawaiian and Other
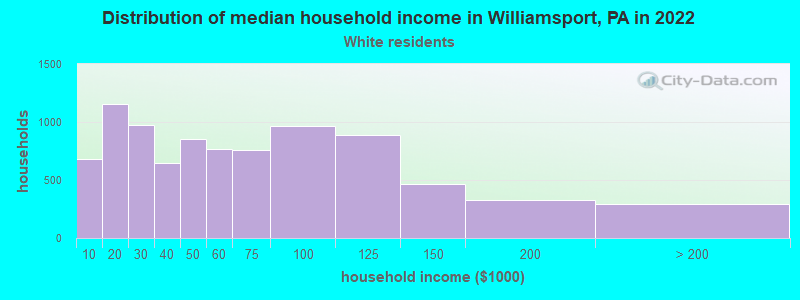
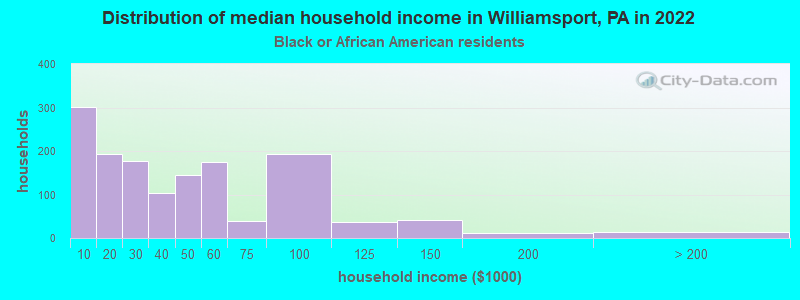
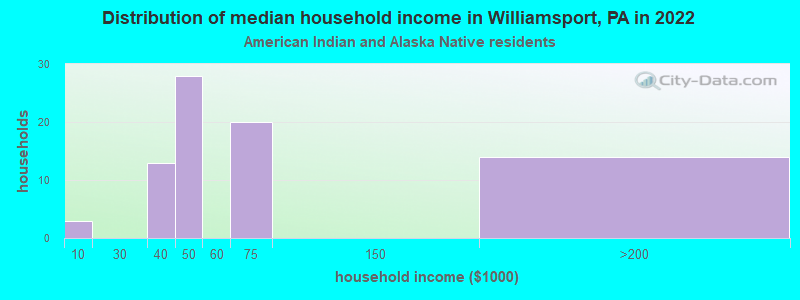
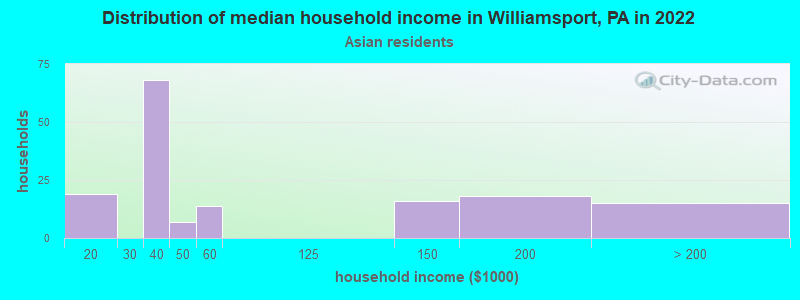
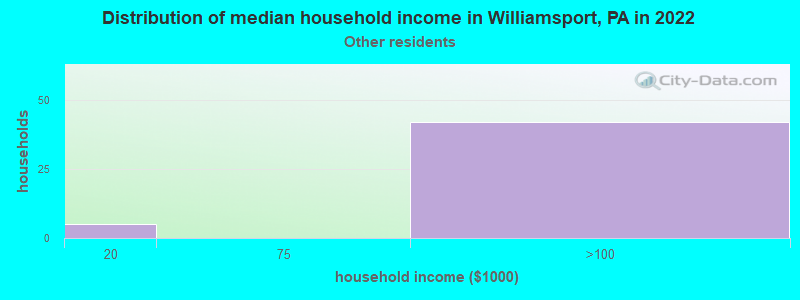
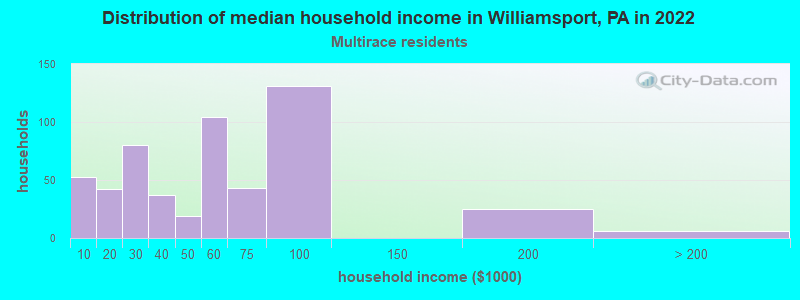
Income and house value in Williamsport Median household income in 2022 $50,078 White non-Hispanic householders$39,012 Black householders$45,735 Two or more races householdersMedian 2022 house value $145,303 White Non-Hispanic householders$126,873 Black or African American householders$151,733 American Indian or Alaska Native householders $96,440 Asian householders$160,734 Some other race householders$174,236 Two or more races householders$160,734 Hispanic or Latino householders
Median age by race in Williamsport
32.6 Median age for White residents31.7 34.5 43.1 Median age for Black or African American residents47.7 31.9 30.0 Median age for American Indian / Alaska Native residents31.3 32.9 23.4 Median age for Asian residents23.1 40.5 -680,432,644.4 Median age for Native Hawaiian / Pacific Islander residents-666,666,666.0 -747,474,746.7 20.9 Median age for Other race residents36.4 13.3 21.2 Median age for Two or more races residents16.6 18.6 32.6 Median age for White alone residents31.7 34.7 20.7 Median age for Hispanic or Latino residents22.7 19.0
Owner/renter occupied households by race in Williamsport
House owners and renters - White residents 4,244 48.3% Owner occupied4,536 51.7% Renter occupiedHouse owners and renters - Black or African American residents 221 14.4% Owner occupied1,313 85.6% Renter occupiedHouse owners and renters - American Indian / Alaska Native residents 86 78.6% Owner occupied23 21.4% Renter occupiedHouse owners and renters - Asian residents 45 31.9% Owner occupied95 68.1% Renter occupiedHouse owners and renters - Other race residents 47 89.3% Owner occupied6 10.7% Renter occupiedHouse owners and renters - Two or more races residents 241 37.9% Owner occupied395 62.1% Renter occupiedHouse owners and renters - White alone residents 4,236 48.1% Owner occupied4,572 51.9% Renter occupiedHouse owners and renters - Hispanic or Latino residents 68 36.5% Owner occupied118 63.5% Renter occupied
Language usage in Williamsport
English speakers - Total 95.0% of residents of Williamsport speak English at home.
1.8% of residents speak Spanish at home 382 80.1% Speak English very well95 19.9% Speak English less than very well2.8% of residents speak other language at home 499 69.1% Speak English very well223 30.9% Speak English less than very well
English speakers - Born in the United States 92.8% of residents of Williamsport speak English at home.
5.0% of residents speak Spanish at home 186 76.5% Speak English very well57 23.5% Speak English less than very well2.0% of residents speak other language at home 96 100.0% Speak English very well
English speakers - Native, born elsewhere 84.5% of residents of Williamsport speak English at home.
20.0% of residents speak Spanish at home 13 41.9% Speak English very well18 58.1% Speak English less than very well
English speakers - Foreign-born 34.0% of residents of Williamsport speak English at home.
12.2% of residents speak Spanish at home 71 82.6% Speak English very well15 17.4% Speak English less than very well51.9% of residents speak other language at home 149 40.7% Speak English very well217 59.3% Speak English less than very well
White (Caucasian) - Speak only English Native:
98.0% (19,784)Foreign-born:
47.2% (73)
White (Caucasian) - Speak another language Native:
2.0% (400)Foreign-born:
28.8% (45)
Black or African American - Speak only English Native:
96.1% (2,955)Foreign-born:
36.4% (80)
Black or African American - Speak another language Native:
3.9% (121)Foreign-born:
61.4% (135)
Asian - Speak only English Native:
47.2% (72)Foreign-born:
33.6% (80)
Asian - Speak another language Native:
52.7% (80)Foreign-born:
66.6% (159)
Other race - Speak another language Native:
22.4% (36)Foreign-born:
100.0% (10)
Two or more races - Speak another language Native:
5.9% (108)Foreign-born:
100.0% (13)
White alone - Speak only English Native:
98.2% (19,734)Foreign-born:
100.0% (62)
White alone - Speak another language Native:
1.7% (335)Foreign-born:
56.1% (35)
Hispanic or Latino - Speak another language Native:
30.3% (181)Foreign-born:
100.0% (73)
Foreign-born residents in Williamsport 704 residents are foreign born (0.9% Latin America , 0.9% Asia , 0.6% Europe ).
This city:
2.6%Pennsylvania:
7.3%
Marital status for residents in Williamsport Marital status - White (Caucasian) population 15 years and over
Males 55.1% Never married30.8% Now married1.9% Separated1.7% Widowed10.5% DivorcedFemales 45.5% Never married30.1% Now married2.4% Separated9.4% Widowed12.7% DivorcedWomen who gave birth in the past 12 months Now married:
43.5% (128)Unmarried:
56.5% (166)
Women who did not give birth in the past 12 months Now married:
22.8% (1,188)Unmarried:
77.2% (4,020)
Marital status - Black or African American population 15 years and over
Males 62.9% Never married22.0% Now married7.6% Separated1.5% Widowed6.0% DivorcedFemales 60.0% Never married20.0% Now married9.0% Separated2.8% Widowed8.3% DivorcedWomen who gave birth in the past 12 months Now married:
0.0% (0)Unmarried:
100.0% (115)
Women who did not give birth in the past 12 months Now married:
30.9% (277)Unmarried:
69.1% (618)
Marital status - American Indian / Alaska Native population 15 years and over
Males 66.1% Never married33.9% Now married0.0% Separated0.0% Widowed0.0% DivorcedFemales 71.6% Never married28.4% Now married0.0% Separated0.0% Widowed0.0% DivorcedWomen who gave birth in the past 12 months Now married:
0.0% (0)Unmarried:
100.0% (27)
Women who did not give birth in the past 12 months Now married:
7.7% (5)Unmarried:
92.3% (66)
Marital status - Asian population 15 years and over
Males 85.0% Never married15.0% Now married0.0% Separated0.0% Widowed0.0% DivorcedFemales 28.7% Never married39.2% Now married0.0% Separated32.2% Widowed0.0% DivorcedWomen who did not give birth in the past 12 months Now married:
59.6% (64)Unmarried:
40.4% (43)
Marital status - Other race population 15 years and over
Males 35.4% Never married24.0% Now married36.5% Separated0.0% Widowed4.2% DivorcedFemales 100.0% Never married0.0% Now married0.0% Separated0.0% Widowed0.0% DivorcedWomen who did not give birth in the past 12 months Now married:
0.0% (0)Unmarried:
100.0% (24)
Marital status - Two or more races population 15 years and over
Males 71.4% Never married9.5% Now married0.0% Separated0.0% Widowed19.2% DivorcedFemales 82.3% Never married15.9% Now married0.8% Separated0.0% Widowed1.0% DivorcedWomen who gave birth in the past 12 months Now married:
0.0% (0)Unmarried:
100.0% (11)
Women who did not give birth in the past 12 months Now married:
12.9% (76)Unmarried:
87.1% (512)
Marital status - White alone, not Hispanic / Latino population 15 years and over
Males 54.9% Never married31.1% Now married1.9% Separated1.6% Widowed10.5% DivorcedFemales 45.3% Never married30.2% Now married2.3% Separated9.5% Widowed12.7% DivorcedWomen who gave birth in the past 12 months Now married:
43.5% (129)Unmarried:
56.5% (168)
Women who did not give birth in the past 12 months Now married:
22.9% (1,185)Unmarried:
77.1% (3,991)
Marital status - Hispanic or Latino population 15 years and over
Males 76.2% Never married16.7% Now married0.0% Separated3.7% Widowed3.4% DivorcedFemales 61.3% Never married16.1% Now married6.1% Separated0.0% Widowed16.5% DivorcedWomen who did not give birth in the past 12 months Now married:
8.8% (15)Unmarried:
91.2% (155)
Ancestries in Williamsport
2,505 22.6% German1,019 9.2% Italian872 7.9% American838 7.6% Irish746 6.7% English221 2.0% Polish217 2.0% European181 1.6% Pennsylvania German138 1.2% Haitian131 1.2% Scottish114 1.0% French59 0.5% Slovak53 0.5% Dutch44 0.4% Nigerian40 0.4% Scotch-Irish40 0.4% Welsh33 0.3% Liberian33 0.3% Belizean31 0.3% Russian31 0.3% African27 0.2% Greek26 0.2% Latvian25 0.2% West Indian23 0.2% Eastern European21 0.2% Hungarian18 0.2% Canadian18 0.2% Norwegian18 0.2% Swiss16 0.1% Bahamian15 0.1% French Canadian13 0.1% Northern European10 0.09% Portuguese9 0.08% Danish9 0.08% Ukrainian9 0.08% Jamaican8 0.07% Syrian8 0.07% British6 0.05% Austrian5 0.05% Trinidadian and Tobagonian4 0.04% Kenyan
Geographical mobility in Williamsport Same house 1 year ago 18,029 86.2% White (Caucasian)2,539 72.4% Black or African American376 99.6% American Indian / Alaska Native385 94.2% Asian130 73.5% Other race1,539 66.2% Two or more races17,895 86.1% White alone, not Hispanic / Latino592 77.6% Hispanic or LatinoMoved within same county 1,188 5.7% White / Caucasian519 14.8% Black or African American16 3.9% Asian34 19.4% Other race389 16.7% Two or more races1,185 5.7% White alone, not Hispanic / Latino49 6.4% Hispanic or LatinoMoved within same state 988 4.7% White / Caucasian96 2.8% Black or African American5 2.6% Other race76 3.3% Two or more races1,013 4.9% White alone, not Hispanic / Latino72 9.4% Hispanic or LatinoMoved from different state 157 0.8% White / Caucasian241 6.9% Black or African American309 13.3% Two or more races142 0.7% White alone, not Hispanic / Latino42 5.5% Hispanic or LatinoMoved from abroad 22 0.1% White44 1.3% Black or African American13 3.3% Asian22 0.1% White alone, not Hispanic / Latino
Children Nativity (place of birth) in Williamsport
Children under 6 years - Living with two parents Both parents native 603 100.0% NativeBoth parents foreign-born 23 100.0% NativeOne native, one foreign-born parent 21 100.0% NativeChildren under 6 years - Living with one parent Native parent 1,282 100.0% NativeChildren 6 to 17 years - Living with two parents Both parents native 1,257 96.7% Native42 3.3% Foreign-bornBoth parents foreign-born 26 67.5% Native12 32.5% Foreign-bornOne native, one foreign-born parent 48 100.0% NativeChildren 6 to 17 years - Living with one parent Native parent 1,834 100.0% NativeForeign-born parent 147 52.6% Native132 47.4% Foreign-born
Grandparents responsible for own grandchildren in Williamsport
Grandparents (30 to 59 years) White / Caucasian 52 36.7% Responsible for grandchildren89 63.3% Not responsible for grandchildrenBlack or African American 9 38.0% Responsible for grandchildren14 62.0% Not responsible for grandchildrenTwo or more races 34 100.0% Responsible for grandchildrenWhite alone, not Hispanic / Latino 52 36.7% Responsible for grandchildren89 63.3% Not responsible for grandchildrenGrandparents (60 years and over) White / Caucasian 40 26.4% Responsible for grandchildren110 73.6% Not responsible for grandchildrenBlack or African American 39 100.0% Not responsible for grandchildrenWhite alone, not Hispanic / Latino 39 28.3% Responsible for grandchildren100 71.7% Not responsible for grandchildren