Wake Forest, NC (North Carolina) Houses and Residents
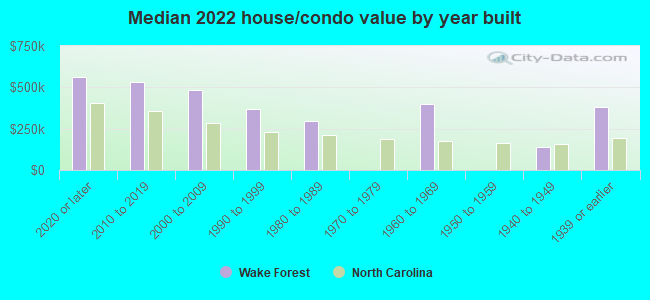
Estimated median house or condo value in 2022: $484,444 (it was $142,100 in 2000 )
Wake Forest:
$484,444North Carolina:
$280,600
Lower value quartile - upper value quartile: $378,902 - $592,709Total population: 36,693 (Urban population: 12,352, Rural population: 198 (all nonfarm) )
Houses: 18,760 (17,764 occupied: 12,784 owner occupied, 4,610 renter occupied )
% of renters here:
27%State:
33%
Housing density: 2,406 houses/condos per square mile
Median price asked for vacant for-sale houses and condos in 2022: $203,041.
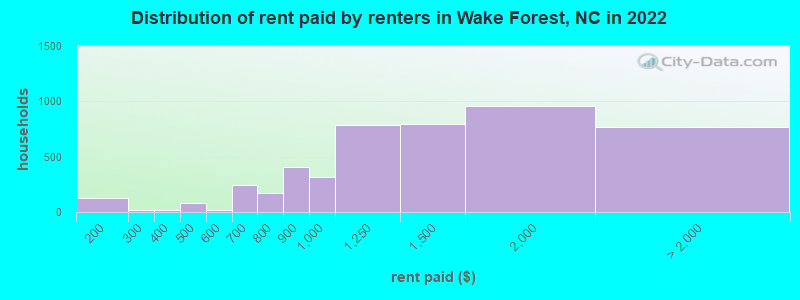
Median contract rent in 2022: $1,287 (lower quartile is $959, upper quartile is $1,754)
Median rent asked for vacant for-rent units in 2022: $2,111
Median gross rent in Wake Forest, NC in 2022: $1,400
Housing units in Wake Forest with a mortgage: 9,892 (1,325 second mortgage, 31 home equity loan, 1,138 both second mortgage and home equity loan )Houses without a mortgage: 52
Median household income for houses/condos with a mortgage: $137,739
Median household income for apartments without a mortgage: $81,251
Median monthly housing costs: $1,722
Data:
Median house or condo value ($)
Median house or condo value ($ change since 2000)
Median house or condo value ($) - White
Median house or condo value ($) - Black or African American
Median house or condo value ($) - Asian
Median house or condo value ($) - Hispanic or Latino
Median house or condo value ($) - American Indian and Alaska Native
Median house or condo value ($) - Multirace
Median house or condo value ($) - Other Race
Median price asked for mobile homes ($)
Household density (households per square mile)
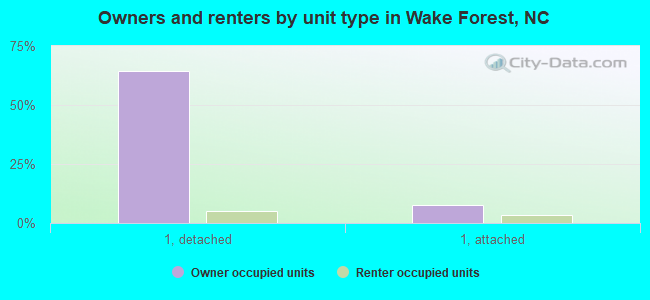
Mean house or condo value by units in structure - 1, detached ($)
Mean house or condo value by units in structure - 1, attached ($)
Mean house or condo value by units in structure - 2 ($)
Mean house or condo value by units in structure by units in structure - 3 or 4 ($)
Mean house or condo value by units in structure - 5 or more ($)
Mean house or condo value by units in structure - Boat, RV, van, etc. ($)
Mean house or condo value by units in structure - Mobile home ($)
Median contract rent ($)
Median contract rent - Lower quartile ($)
Median contract rent - Upper quartile ($)
Median gross rent ($)
Urban houses (%)
Rural houses (%)
Houses occupied (%)
Houses occupied (% change since 2000)
Houses owner occupied (%)
Houses owner occupied (% change since 2000)
Houses renter occupied (%)
Houses renter occupied (% change since 2000)
Vacant housing units - For rent (%)
Vacant housing units - For rent (% change since 2000)
Vacant housing units - For sale only (%)
Vacant housing units - For sale only (% change since 2000)
Vacant housing units - Rented or sold, not occupied (%)
Vacant housing units - Rented or sold, not occupied (% change since 2000)
Vacant housing units - For seasonal, recreational, or occasional use (%)
Vacant housing units - For seasonal, recreational, or occasional use (% change since 2000)
Vacant housing units - For migrant workers (%)
Vacant housing units - For migrant workers (% change since 2000)
Vacant housing units - Other vacant (%)
Vacant housing units - Other vacant (% change since 2000)
Median monthly housing costs ($)
Median household income for houses/condos with a mortgage ($)
Median household income for houses/condos without a mortgage ($)
Median household income ($)
Median household income ($) - White
Median household income ($) - Black or African American
Median household income ($) - Asian
Median household income ($) - Hispanic or Latino
Median household income ($) - American Indian and Alaska Native
Median household income ($) - Multirace
Median household income ($) - Other Race
Mortgage status - with mortgage (%)
Mortgage status - with second mortgage (%)
Mortgage status - with home equity loan (%)
Mortgage status - with both second mortgage and home equity loan (%)
Mortgage status - without a mortgage (%)
Median year house/condo built
Median year apartment built
Household type by relationship - Male householder living alone (%)
Household type by relationship - Male householder not living alone (%)
Household type by relationship - Female householder living alone (%)
Household type by relationship - Female householder not living alone (%)
Household type by relationship - Opposite-Sex spouse (%)
Household type by relationship - Same-Sex spouse (%)
Household type by relationship - Opposite-Sex unmarried partner (%)
Household type by relationship - Same-Sex unmarried partner (%)
Household type by relationship - In group quarters (%)
Size of family households - 2-person household (%)
Size of family households - 3-person household (%)
Size of family households - 4-person household (%)
Size of family households - 5-person household (%)
Size of family households - 6-person household (%)
Size of family households - 7-or-more-person household (%)
Size of nonfamily households - 1-person household (%)
Size of nonfamily households - 2-person household (%)
Size of nonfamily households - 3-person household (%)
Size of nonfamily households - 4-person household (%)
Size of nonfamily households - 5-person household (%)
Size of nonfamily households - 6-person household (%)
Size of nonfamily households - 7-or-moreperson household (%)
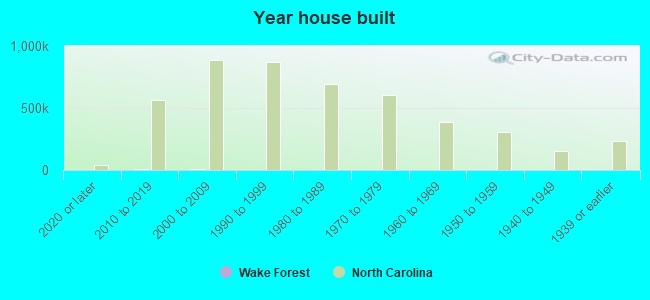
Year house built - Built 2010 or later (%)
Year house built - Built 2000 to 2009 (%)
Year house built - Built 1990 to 1999 (%)
Year house built - Built 1980 to 1989 (%)
Year house built - Built 1970 to 1979 (%)
Year house built - Built 1960 to 1969 (%)
Year house built - Built 1950 to 1959 (%)
Year house built - Built 1940 to 1949 (%)
Year house built - Built 1939 or earlier (%)
Median number of rooms in houses and condos
Median number of rooms in apartments
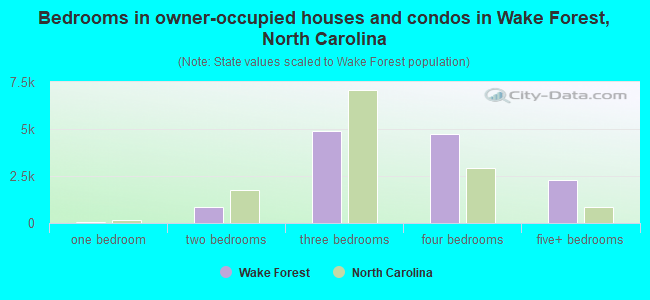
Median number of bedrooms in owner occupied houses
Mean number of bedrooms in owner occupied houses
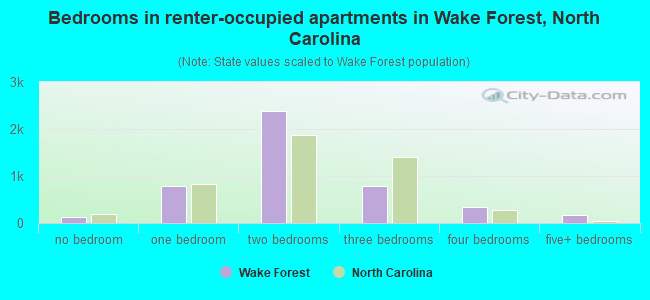
Median number of bedrooms in renter occupied houses
Mean number of bedrooms in renter occupied houses
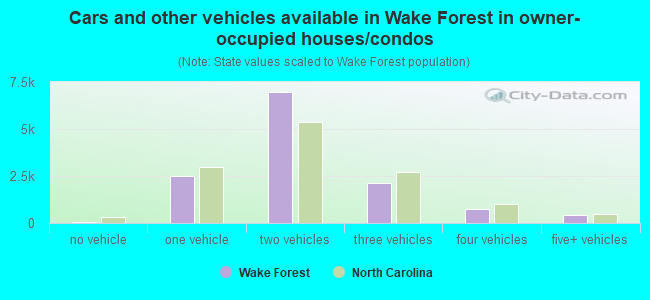
Median number of vehichles in owner occupied houses
Mean number of vehichles in owner occupied houses
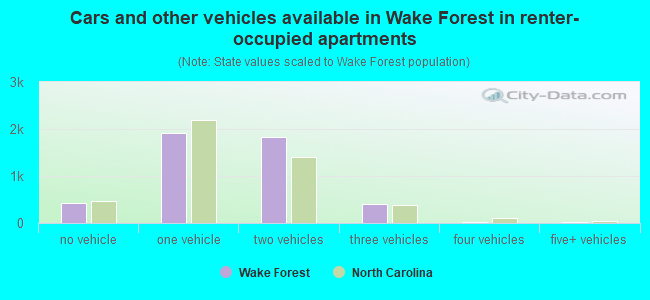
Median number of vehichles in renter occupied houses
Mean number of vehichles in renter occupied houses
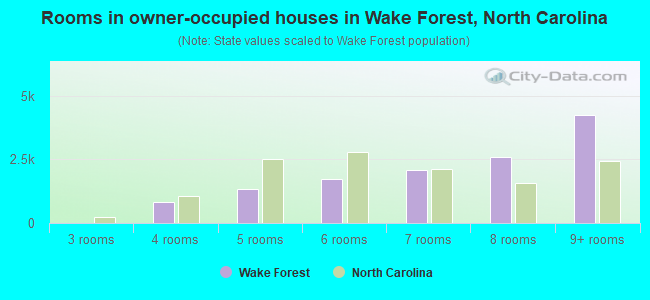
Rooms in owner-occupied houses - 1 room (%)
Rooms in owner-occupied houses - 2 rooms (%)
Rooms in owner-occupied houses - 3 rooms (%)
Rooms in owner-occupied houses - 4 rooms (%)
Rooms in owner-occupied houses - 5 rooms (%)
Rooms in owner-occupied houses - 6 rooms (%)
Rooms in owner-occupied houses - 7 rooms (%)
Rooms in owner-occupied houses - 8 rooms (%)
Rooms in owner-occupied houses - 9+ rooms (%)
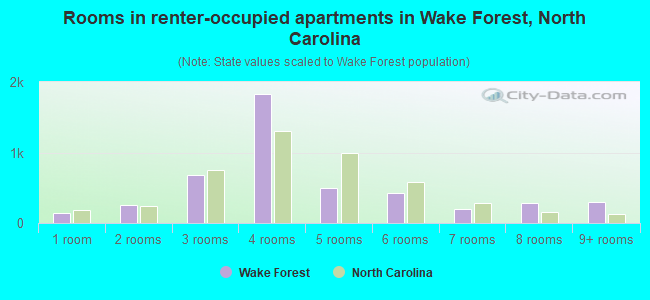
Rooms in renter-occupied houses - 1 room (%)
Rooms in renter-occupied houses - 2 rooms (%)
Rooms in renter-occupied houses - 3 rooms (%)
Rooms in renter-occupied houses - 4 rooms (%)
Rooms in renter-occupied houses - 5 rooms (%)
Rooms in renter-occupied houses - 6 rooms (%)
Rooms in renter-occupied houses - 7 rooms (%)
Rooms in renter-occupied houses - 8 rooms (%)
Rooms in renter-occupied houses - 9+ rooms (%)
Bedrooms in owner-occupied houses - no bedrooms (%)
Bedrooms in owner-occupied houses - 1 bedroom (%)
Bedrooms in owner-occupied houses - 2 bedrooms (%)
Bedrooms in owner-occupied houses - 3 bedrooms (%)
Bedrooms in owner-occupied houses - 4 bedrooms (%)
Bedrooms in owner-occupied houses - 5+ bedrooms (%)
Bedrooms in renter-occupied houses - no bedrooms (%)
Bedrooms in renter-occupied houses - 1 bedroom (%)
Bedrooms in renter-occupied houses - 2 bedrooms (%)
Bedrooms in renter-occupied houses - 3 bedrooms (%)
Bedrooms in renter-occupied houses - 4 bedrooms (%)
Bedrooms in renter-occupied houses - 5+ bedrooms (%)
Vehicles available in owner-occupied houses - no vehicle available (%)
Vehicles available in owner-occupied houses - 1 vehicle available(%)
Vehicles available in owner-occupied houses - 2 Vehicles available (%)
Vehicles available in owner-occupied houses - 3 Vehicles available (%)
Vehicles available in owner-occupied houses - 4 Vehicles available (%)
Vehicles available in owner-occupied houses - 5+ Vehicles available (%)
Vehicles available in renter-occupied houses - no vehicle available (%)
Vehicles available in renter-occupied houses - 1 vehicle available (%)
Vehicles available in renter-occupied houses - 2 Vehicles available (%)
Vehicles available in renter-occupied houses - 3 Vehicles available (%)
Vehicles available in renter-occupied houses - 4 Vehicles available (%)
Vehicles available in renter-occupied houses - 5+ Vehicles available (%)
Housing units in structures - 1, detached (%)
Housing units in structures - 1, attached (%)
Housing units in structures - 2 (%)
Housing units in structures - 3 or 4 (%)
Housing units in structures - 5 to 9 (%)
Housing units in structures - 10 to 19 (%)
Housing units in structures - 20 to 49 (%)
Housing units in structures - 50 or more (%)
Housing units in structures - Mobile home (%)
Housing units in structures - Boat, RV, van, etc. (%)
Housing units in structures - Owners - 1, detached (%)
Housing units in structures - Owners - 1, attached (%)
Housing units in structures - Owners - 2 (%)
Housing units in structures - Owners - 3 or 4 (%)
Housing units in structures - Owners - 5 to 9 (%)
Housing units in structures - Owners - 10 to 19 (%)
Housing units in structures - Owners - 20 to 49 (%)
Housing units in structures - Owners - 50 or more (%)
Housing units in structures - Owners - Mobile home (%)
Housing units in structures - Owners - Boat, RV, van, etc. (%)
Housing units in structures - Renters - 1, detached (%)
Housing units in structures - Renters - 1, attached (%)
Housing units in structures - Renters - 2 (%)
Housing units in structures - Renters - 3 or 4 (%)
Housing units in structures - Renters - 5 to 9 (%)
Housing units in structures - Renters - 10 to 19 (%)
Housing units in structures - Renters - 20 to 49 (%)
Housing units in structures - Renters - 50 or more (%)
Housing units in structures - Renters - Mobile home (%)
Housing units in structures - Renters - Boat, RV, van, etc. (%)
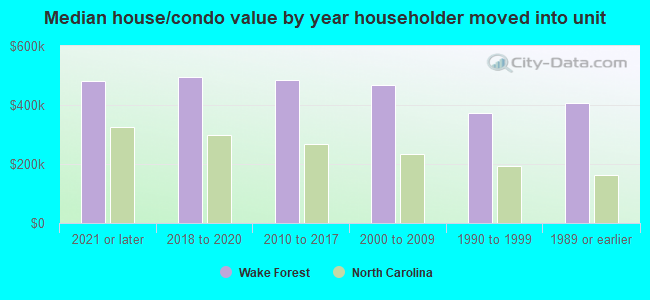
House/condo owner moved in on average (years ago)
Renter moved in on average (years ago)
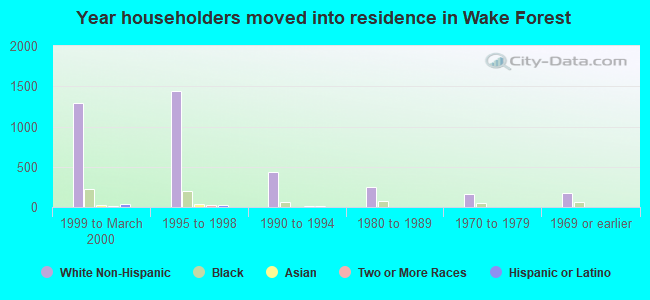
Year householder moved into unit - Moved in 1999 to March 2000 (%)
Year householder moved into unit - Moved in 1999 to March 2000 (%) - White
Year householder moved into unit - Moved in 1999 to March 2000 (%) - Black or African American
Year householder moved into unit - Moved in 1999 to March 2000 (%) - Asian
Year householder moved into unit - Moved in 1999 to March 2000 (%) - Hispanic or Latino
Year householder moved into unit - Moved in 1999 to March 2000 (%) - American Indian and Alaska Native
Year householder moved into unit - Moved in 1999 to March 2000 (%) - Multirace
Year householder moved into unit - Moved in 1999 to March 2000 (%) - Other Race
Year householder moved into unit - Moved in 1995 to 1998 (%)
Year householder moved into unit - Moved in 1995 to 1998 (%) - White
Year householder moved into unit - Moved in 1995 to 1998 (%) - Black or African American
Year householder moved into unit - Moved in 1995 to 1998 (%) - Asian
Year householder moved into unit - Moved in 1995 to 1998 (%) - Hispanic or Latino
Year householder moved into unit - Moved in 1995 to 1998 (%) - American Indian and Alaska Native
Year householder moved into unit - Moved in 1995 to 1998 (%) - Multirace
Year householder moved into unit - Moved in 1995 to 1998 (%) - Other Race
Year householder moved into unit - Moved in 1990 to 1994 (%)
Year householder moved into unit - Moved in 1990 to 1994 (%) - White
Year householder moved into unit - Moved in 1990 to 1994 (%) - Black or African American
Year householder moved into unit - Moved in 1990 to 1994 (%) - Asian
Year householder moved into unit - Moved in 1990 to 1994 (%) - Hispanic or Latino
Year householder moved into unit - Moved in 1990 to 1994 (%) - American Indian and Alaska Native
Year householder moved into unit - Moved in 1990 to 1994 (%) - Multirace
Year householder moved into unit - Moved in 1990 to 1994 (%) - Other Race
Year householder moved into unit - Moved in 1980 to 1989 (%)
Year householder moved into unit - Moved in 1980 to 1989 (%) - White
Year householder moved into unit - Moved in 1980 to 1989 (%) - Black or African American
Year householder moved into unit - Moved in 1980 to 1989 (%) - Asian
Year householder moved into unit - Moved in 1980 to 1989 (%) - Hispanic or Latino
Year householder moved into unit - Moved in 1980 to 1989 (%) - American Indian and Alaska Native
Year householder moved into unit - Moved in 1980 to 1989 (%) - Multirace
Year householder moved into unit - Moved in 1980 to 1989 (%) - Other Race
Year householder moved into unit - Moved in 1970 to 1979 (%)
Year householder moved into unit - Moved in 1970 to 1979 (%) - White
Year householder moved into unit - Moved in 1970 to 1979 (%) - Black or African American
Year householder moved into unit - Moved in 1970 to 1979 (%) - Asian
Year householder moved into unit - Moved in 1970 to 1979 (%) - Hispanic or Latino
Year householder moved into unit - Moved in 1970 to 1979 (%) - American Indian and Alaska Native
Year householder moved into unit - Moved in 1970 to 1979 (%) - Multirace
Year householder moved into unit - Moved in 1970 to 1979 (%) - Other Race
Year householder moved into unit - Moved in 1969 or earlier (%)
Year householder moved into unit - Moved in 1969 or earlier (%) - White
Year householder moved into unit - Moved in 1969 or earlier (%) - Black or African American
Year householder moved into unit - Moved in 1969 or earlier (%) - Asian
Year householder moved into unit - Moved in 1969 or earlier (%) - Hispanic or Latino
Year householder moved into unit - Moved in 1969 or earlier (%) - American Indian and Alaska Native
Year householder moved into unit - Moved in 1969 or earlier (%) - Multirace
Year householder moved into unit - Moved in 1969 or earlier (%) - Other Race
Housing units lacking complete plumbing facilities (%)
Housing units lacking complete kitchen facilities (%)
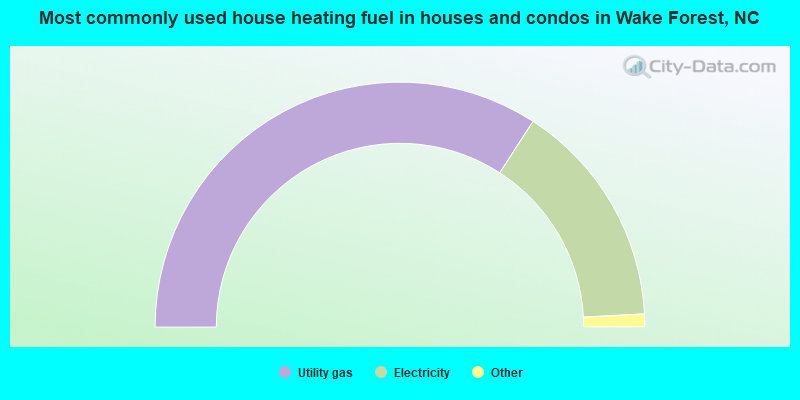
House heating fuel used in houses and condos - Utility gas (%)
House heating fuel used in houses and condos - Bottled, tank, or LP gas (%)
House heating fuel used in houses and condos - Electricity (%)
House heating fuel used in houses and condos - Fuel oil, kerosene, etc. (%)
House heating fuel used in houses and condos - Coal or coke (%)
House heating fuel used in houses and condos - Wood (%)
House heating fuel used in houses and condos - Solar energy (%)
House heating fuel used in houses and condos - Other fuel (%)
House heating fuel used in houses and condos - No fuel used (%)
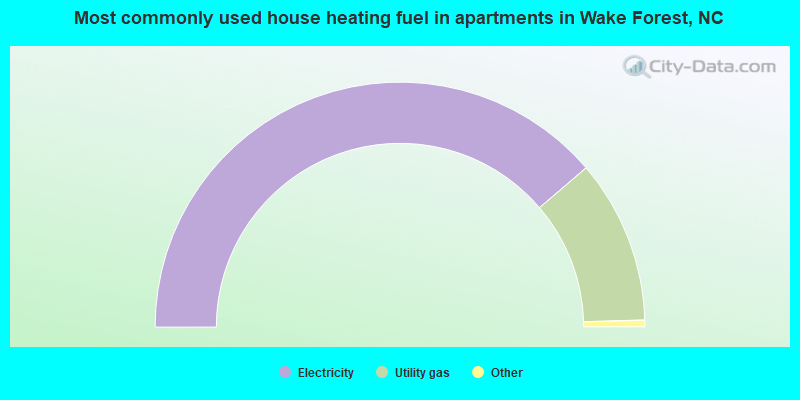
House heating fuel used in apartments - Utility gas (%)
House heating fuel used in apartments - Bottled, tank, or LP gas (%)
House heating fuel used in apartments - Electricity (%)
House heating fuel used in apartments - Fuel oil, kerosene, etc. (%)
House heating fuel used in apartments - Coal or coke (%)
House heating fuel used in apartments - Wood (%)
House heating fuel used in apartments - Solar energy (%)
House heating fuel used in apartments - Other fuel (%)
House heating fuel used in apartments - No fuel used (%)
Median year house/condo built: 2008Median year apartment built: 2011Household type by relationship:
Households: 49,868
Male householders: 8,478 (1,157 living alone ), Female householders: 8,969 (2,045 living alone )10,769 spouses (10,654 opposite-sex spouses ), 809 unmarried partners , (779 opposite-sex unmarried partners ), 16,402 children (14,851 natural , 535 adopted , 1,015 stepchildren ), 1,065 grandchildren , 765 brothers or sisters , 749 parents , 0 foster children , 445 other relatives , 745 non-relatives In group quarters: 667
Size of family households: 5,810 2-persons , 3,077 3-persons , 2,882 4-persons , 1,210 5-persons , 317 6-persons , 153 7-or-more-persons .
Size of nonfamily households: 3,233 1-person , 622 2-persons , 36 3-persons , 5 4-persons , 39 5-persons .
10,028 married couples with children. single-parent households (506 men , 1,637 women ).
89.3% of residents of Wake Forest speak English at home. of residents speak Spanish at home (74% speak English very well , 16% speak English well , 7% speak English not well , 2% don't speak English at all ).of residents speak other Indo-European language at home (91% speak English very well , 7% speak English well , 1% speak English not well ).of residents speak Asian or Pacific Island language at home (72% speak English very well , 16% speak English well , 10% speak English not well , 2% don't speak English at all ).of residents speak other language at home (100% speak English very well ).
Foreign born population: 3,776 (7.6%)of them are naturalized citizens )
Median number of rooms in houses and condos:
Median number of rooms in apartments
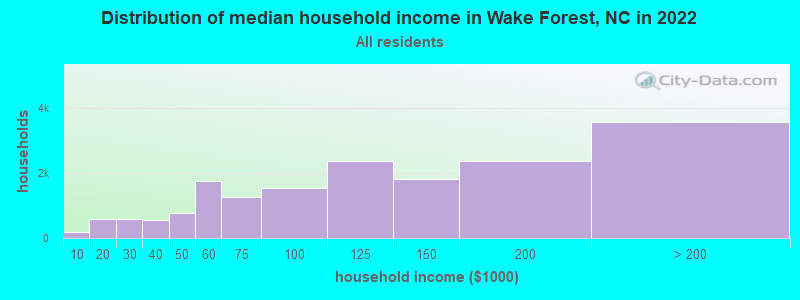
Wake Forest, NC household income distribution 189 Less than $10,000589 $10,000 to $19,999601 $20,000 to $29,999564 $30,000 to $39,999768 $40,000 to $49,9991,748 $50,000 to $59,9991,257 $60,000 to $74,9991,547 $75,000 to $99,9992,366 $100,000 to $124,9991,825 $125,000 to $149,9992,368 $150,000 to $199,9993,579 $200,000 or more
Home value of owner - occupied houses in 2022 in Wake Forest, NC 32 Less than $10,00032 $15,000 to $19,99919 $20,000 to $24,99950 $30,000 to $34,99926 $35,000 to $39,99942 $40,000 to $49,99954 $70,000 to $79,99913 $80,000 to $89,99915 $90,000 to $99,99923 $100,000 to $124,99960 $125,000 to $149,999151 $150,000 to $174,999141 $175,000 to $199,999471 $200,000 to $249,999877 $250,000 to $299,9992,794 $300,000 to $399,9993,675 $400,000 to $499,9993,465 $500,000 to $749,999867 $750,000 to $999,99942 $1,000,000 to $1,499,99945 $2,000,000 or moreRent paid by renters in 2022 in Wake Forest, NC 122 $100 to $1492 $150 to $19916 $200 to $24918 $300 to $34935 $400 to $44947 $450 to $49917 $500 to $54991 $600 to $649151 $650 to $69993 $700 to $74975 $750 to $799406 $800 to $899316 $900 to $999786 $1,000 to $1,249791 $1,250 to $1,499956 $1,500 to $1,999468 $2,000 to $2,499156 $2,500 to $2,99927 $3,000 to $3,499115 No cash rent
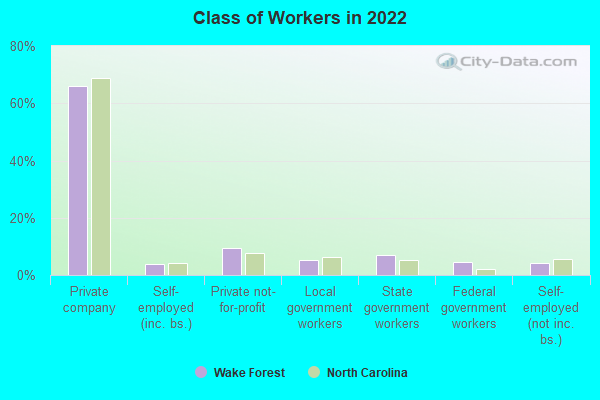
Percentage of workers working in this county: 79.8%Number of people working at home: 7,218 (28.7% of all workers )
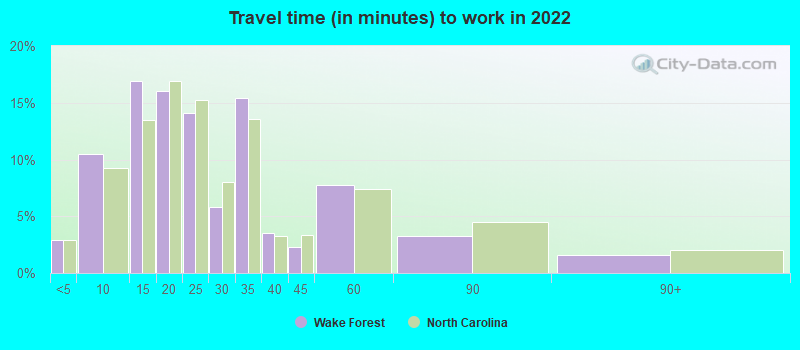
Travel time to work (commute)
Less than 5 minutes: 3145 to 9 minutes: 1,43310 to 14 minutes: 1,44715 to 19 minutes: 1,46320 to 24 minutes: 2,16325 to 29 minutes: 1,25130 to 34 minutes: 2,86035 to 39 minutes: 1,15340 to 44 minutes: 1,37745 to 59 minutes: 2,50460 to 89 minutes: 1,25090 or more minutes: 226
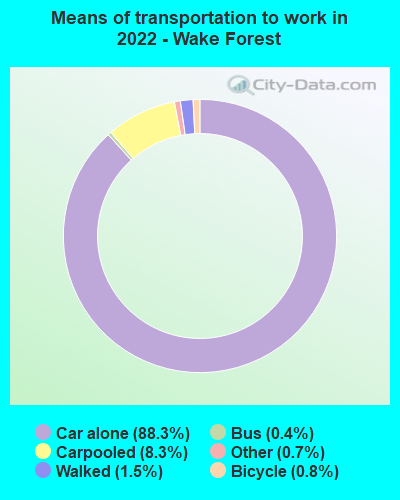
Means of transportation to work:
Drove a car alone: 12,657 (59.4%)Carpooled: 1,266 (5.9%)Bus : 44 (0.2%)Taxi: 146 (0.7%)Bicycle: 172 (0.8%)Walked: 297 (1.4%)Worked at home: 7,218 (33.9%)
Unemployment by race in 2022
Unemployment rate for White non-Hispanic residents 1.5% Males1.1% FemalesUnemployment rate for Black residents 16.7% Males3.2% FemalesUnemployment rate for Asian residents 1.6% Males
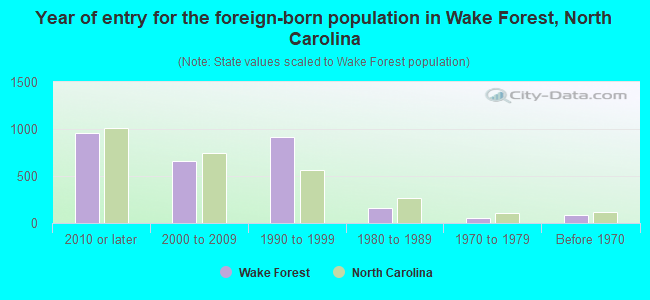
Year of entry for the foreign-born population in Wake Forest, North Carolina
962 2010 or later 657 2000 to 2009 910 1990 to 1999 162 1980 to 1989 55 1970 to 1979 80 Before 1970
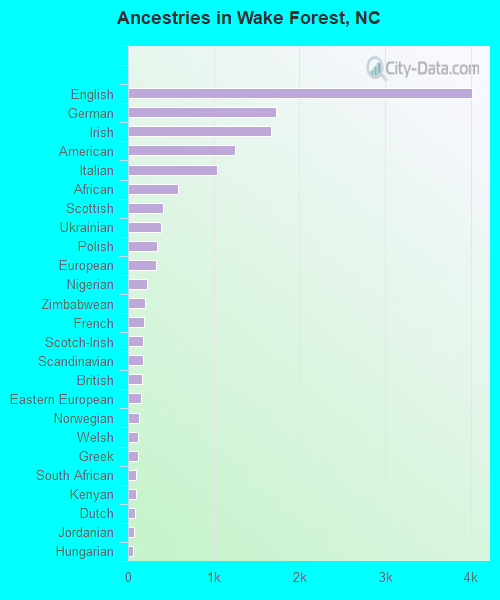
First ancestries reported:
English: 4,012 (16.8%)
German: 1,729 (7.3%)
Irish: 1,674 (7.0%)
American: 1,247 (5.2%)
Italian: 1,039 (4.4%)
African: 581 (2.4%)
Scottish: 414 (1.7%)
Ukrainian: 390 (1.6%)
Polish: 339 (1.4%)
European: 329 (1.4%)
Nigerian: 221 (0.9%)
Zimbabwean: 195 (0.8%)
French: 184 (0.8%)
Scotch-Irish: 179 (0.8%)
Scandinavian: 171 (0.7%)
British: 167 (0.7%)
Eastern European: 156 (0.7%)
Norwegian: 124 (0.5%)
Welsh: 119 (0.5%)
Greek: 117 (0.5%)
South African: 97 (0.4%)
Kenyan: 94 (0.4%)
Dutch: 87 (0.4%)
Jordanian: 72 (0.3%)
Hungarian: 59 (0.2%)
West Indian: 59 (0.2%)
Portuguese: 58 (0.2%)
Swedish: 58 (0.2%)
Slovak: 44 (0.2%)
Czechoslovakian: 39 (0.2%)
Croatian: 28 (0.1%)
Slavic: 27 (0.1%)
Russian: 25 (0.1%)
Czech: 24 (0.1%)
Pennsylvania German: 23 (0.10%)
French Canadian: 22 (0.09%)
Northern European: 17 (0.07%)
Lithuanian: 16 (0.07%)
Haitian: 14 (0.06%)
Serbian: 10 (0.04%)
Lebanese: 10 (0.04%)
Egyptian: 9 (0.04%)
Ethiopian: 9 (0.04%)
Swiss: 8 (0.03%)
Brazilian: 6 (0.03%)
Belgian: 6 (0.03%)
Most common places of birth for foreign-born residents (%): India Wake Forest:
13.9% (499)North Carolina:
9.3% (80,594)
Mexico Wake Forest:
10.2% (367)North Carolina:
24.7% (214,776)
Zimbabwe Wake Forest:
7.2% (258)North Carolina:
0.2% (1,323)
Canada Wake Forest:
7.1% (254)North Carolina:
2.1% (18,105)
Colombia Wake Forest:
6.5% (235)North Carolina:
2.1% (18,275)
Ukraine Wake Forest:
5.9% (213)North Carolina:
0.8% (6,645)
Nigeria Wake Forest:
4.3% (154)North Carolina:
1.1% (9,173)
Cuba Wake Forest:
3.2% (116)North Carolina:
1.0% (9,005)
Philippines Wake Forest:
2.9% (104)North Carolina:
2.4% (20,695)
Germany Wake Forest:
2.9% (103)North Carolina:
1.8% (15,534)
Russia Wake Forest:
2.8% (101)North Carolina:
0.9% (8,067)
Other South America Wake Forest:
2.7% (97)North Carolina:
0.1% (713)
Vietnam Wake Forest:
2.6% (92)North Carolina:
2.9% (24,965)
Nepal Wake Forest:
2.6% (92)North Carolina:
0.6% (5,372)
Dominican Republic Wake Forest:
2.1% (77)North Carolina:
1.7% (15,135)
Thailand Wake Forest:
2.1% (75)North Carolina:
0.7% (6,161)
England Wake Forest:
2.0% (71)North Carolina:
1.2% (10,140)
United Kingdom, excluding England and Scotland Wake Forest:
1.9% (68)North Carolina:
1.1% (9,831)
El Salvador Wake Forest:
1.9% (67)North Carolina:
3.8% (33,379)
Korea Wake Forest:
1.8% (65)North Carolina:
1.8% (15,988)
South Africa Wake Forest:
1.6% (59)North Carolina:
0.5% (4,673)
Kenya Wake Forest:
1.6% (58)North Carolina:
0.5% (4,309)
Place of birth for U.S.-born residents:
This state: 17,926Other state: 27,538Northeast: 9,906Midwest: 5,333South: 10,164West: 2,104 84.1% of Wake Forest residents lived in the same house 1 years ago.
Out of people who lived in different houses, 35.8% lived in this county.
Out of people who lived in different counties, 44.8% lived in North Carolina.
Wake Forest:
84.1%State average:
87.3%
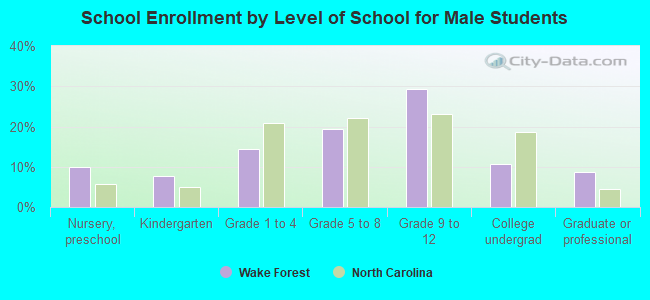
Education attainment for males 25 years and older:
No schooling: 231Nursery to 4th grade: 05th and 6th grade: 07th and 8th grade: 779th grade: 5710th grade: 11311th grade: 2912th grade, no diploma: 41High school graduate (or equivalency): 2,282Less than 1 year of college: 558Some college more than 1 year, no degree: 1,479Associate degree: 1,618Bachelor's degree: 5,922Master's degree: 2,684Professional school degree: 373Doctorate degree: 482
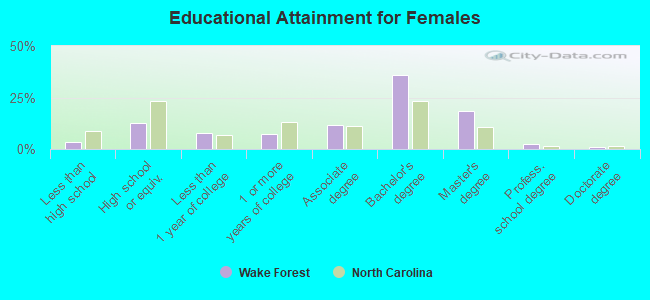
Education attainment for females 25 years and older:
No schooling: 103Nursery to 4th grade: 05th and 6th grade: 57th and 8th grade: 1039th grade: 7410th grade: 6811th grade: 8412th grade, no diploma: 150High school graduate (or equivalency): 2,241Less than 1 year of college: 1,372Some college more than 1 year, no degree: 1,255Associate degree: 2,081Bachelor's degree: 6,351Master's degree: 3,236Professional school degree: 438Doctorate degree: 143
Housing units in structures:
One, detached: 12,596One, attached: 2,144Two: 4923 or 4: 2715 to 9: 1,01710 to 19: 78320 to 49: 81250 or more: 336Mobile homes: 299Boats, RVs, vans, etc.: 7Median worth of mobile homes: $157,677
Housing units lacking complete plumbing facilities in 2022: 0.5%Housing units lacking complete kitchen facilities in 2022: 0.7%House/condo owner moved in on average 7 years ago
Renter moved in on average 1 years ago
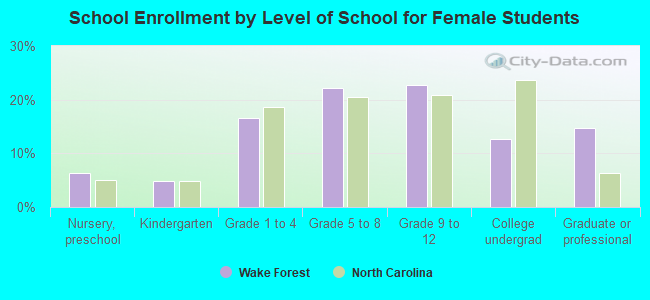
Private vs. public school enrollment:
Students in private schools in grades 1 to 8 (elementary and middle school): 1,216 Here:
23.2%North Carolina:
13.8%
Students in private schools in grades 9 to 12 (high school): 542 Here:
14.7%North Carolina:
11.9%
Students in private undergraduate colleges: 217 Here:
13.0%North Carolina:
19.3%