Races in Wake Forest, North Carolina (NC) Detailed Stats
Data:
Races - White alone (%)
Races - White alone (% change since 2000)
Races - Black alone (%)
Races - Black alone (% change since 2000)
Races - American Indian alone (%)
Races - American Indian alone (% change since 2000)
Races - Asian alone (%)
Races - Asian alone (% change since 2000)
Races - Hispanic (%)
Races - Hispanic (% change since 2000)
Races - Native Hawaiian and Other Pacific Islander alone (%)
Races - Native Hawaiian and Other Pacific Islander alone (% change since 2000)
Races - Two or more races(%)
Races - Two or more races(% change since 2000)
Races - Other race alone (%)
Races - Other race alone (% change since 2000)
Racial diversity
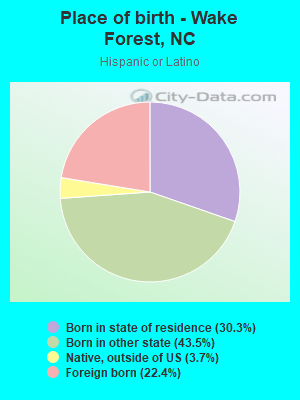
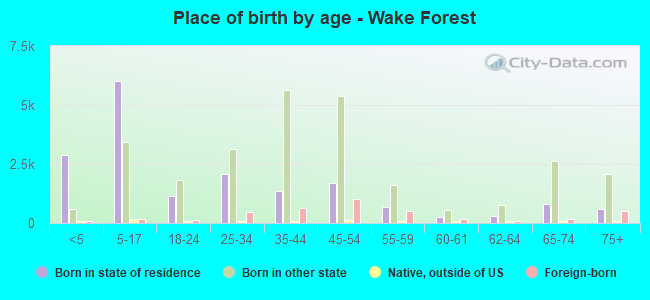
Place of birth - Born in state of residence (%)
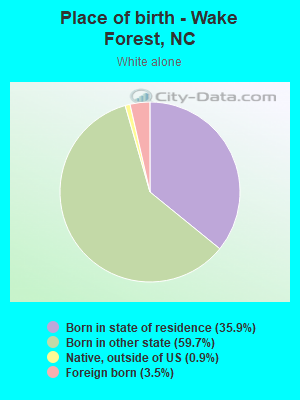
Place of birth - Born in state of residence (%) - White
Place of birth - Born in state of residence (%) - Black or African American
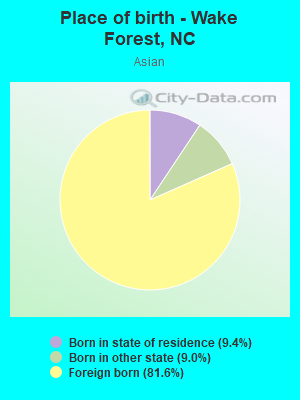
Place of birth - Born in state of residence (%) - Asian
Place of birth - Born in state of residence (%) - Hispanic or Latino
Place of birth - Born in state of residence (%) - American Indian and Alaska Native
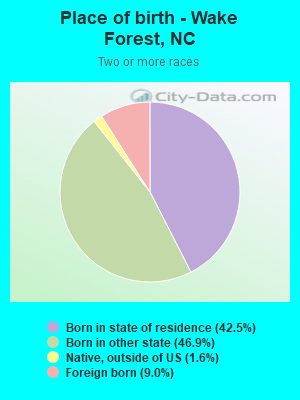
Place of birth - Born in state of residence (%) - Multirace
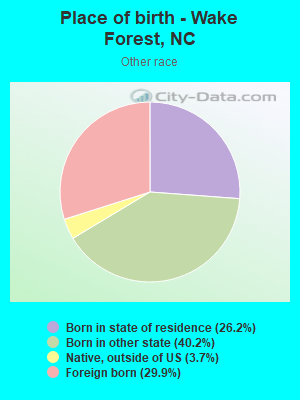
Place of birth - Born in state of residence (%) - Other Race
Place of birth - Born in other state (%)
Place of birth - Born in other state (%) - White
Place of birth - Born in other state (%) - Black or African American
Place of birth - Born in other state (%) - Asian
Place of birth - Born in other state (%) - Hispanic or Latino
Place of birth - Born in other state (%) - American Indian and Alaska Native
Place of birth - Born in other state (%) - Multirace
Place of birth - Born in other state (%) - Other Race
Place of birth - Native, outside of US (%)
Place of birth - Native, outside of US (%) - White
Place of birth - Native, outside of US (%) - Black or African American
Place of birth - Native, outside of US (%) - Asian
Place of birth - Native, outside of US (%) - Hispanic or Latino
Place of birth - Native, outside of US (%) - American Indian and Alaska Native
Place of birth - Native, outside of US (%) - Multirace
Place of birth - Native, outside of US (%) - Other Race
Place of birth - Foreign born (%)
Place of birth - Foreign born (%) - White
Place of birth - Foreign born (%) - Black or African American
Place of birth - Foreign born (%) - Asian
Place of birth - Foreign born (%) - Hispanic or Latino
Place of birth - Foreign born (%) - American Indian and Alaska Native
Place of birth - Foreign born (%) - Multirace
Place of birth - Foreign born (%) - Other Race
Residents speaking English at home (%)
Residents speaking English at home - Born in the United States (%)
Residents speaking English at home - Native, born elsewhere (%)
Residents speaking English at home - Foreign born (%)
Residents speaking Spanish at home (%)
Residents speaking Spanish at home - Born in the United States (%)
Residents speaking Spanish at home - Native, born elsewhere (%)
Residents speaking Spanish at home - Foreign born (%)
Residents speaking other language at home (%)
Residents speaking other language at home - Born in the United States (%)
Residents speaking other language at home - Native, born elsewhere (%)
Residents speaking other language at home - Foreign born (%)
Marital status - Never married (%)
Marital status - Now married (%)
Marital status - Separated (%)
Marital status - Widowed (%)
Marital status - Divorced (%)
Ancestries Reported - Arab (%)
Ancestries Reported - Czech (%)
Ancestries Reported - Danish (%)
Ancestries Reported - Dutch (%)
Ancestries Reported - English (%)
Ancestries Reported - French (%)
Ancestries Reported - French Canadian (%)
Ancestries Reported - German (%)
Ancestries Reported - Greek (%)
Ancestries Reported - Hungarian (%)
Ancestries Reported - Irish (%)
Ancestries Reported - Italian (%)
Ancestries Reported - Lithuanian (%)
Ancestries Reported - Norwegian (%)
Ancestries Reported - Polish (%)
Ancestries Reported - Portuguese (%)
Ancestries Reported - Russian (%)
Ancestries Reported - Scotch-Irish (%)
Ancestries Reported - Scottish (%)
Ancestries Reported - Slovak (%)
Ancestries Reported - Subsaharan African (%)
Ancestries Reported - Swedish (%)
Ancestries Reported - Swiss (%)
Ancestries Reported - Ukrainian (%)
Ancestries Reported - United States (%)
Ancestries Reported - Welsh (%)
Ancestries Reported - West Indian (%)
Ancestries Reported - Other (%)
Geographical mobility - Same house 1 year ago (%)
Geographical mobility - Same house 1 year ago (%) - White
Geographical mobility - Same house 1 year ago (%) - Black or African American
Geographical mobility - Same house 1 year ago (%) - Asian
Geographical mobility - Same house 1 year ago (%) - Hispanic or Latino
Geographical mobility - Same house 1 year ago (%) - American Indian and Alaska Native
Geographical mobility - Same house 1 year ago (%) - Multirace
Geographical mobility - Same house 1 year ago (%) - Other Race
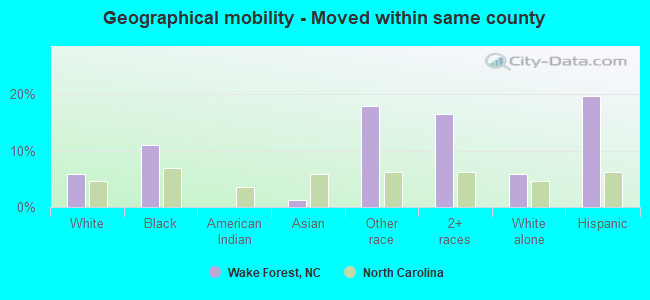
Geographical mobility - Moved within same county (%)
Geographical mobility - Moved within same county (%) - White
Geographical mobility - Moved within same county (%) - Black or African American
Geographical mobility - Moved within same county (%) - Asian
Geographical mobility - Moved within same county (%) - Hispanic or Latino
Geographical mobility - Moved within same county (%) - American Indian and Alaska Native
Geographical mobility - Moved within same county (%) - Multirace
Geographical mobility - Moved within same county (%) - Other Race
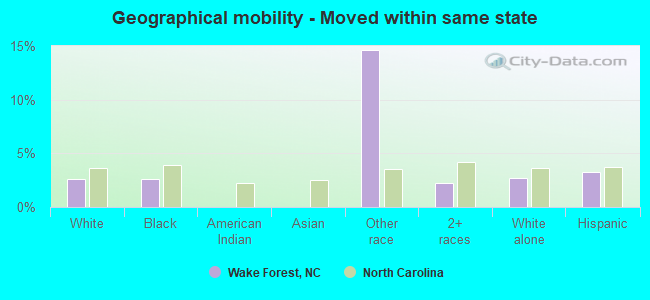
Geographical mobility - Moved from different county within same state (%)
Geographical mobility - Moved from different county within same state (%) - White
Geographical mobility - Moved from different county within same state (%) - Black or African American
Geographical mobility - Moved from different county within same state (%) - Asian
Geographical mobility - Moved from different county within same state (%) - Hispanic or Latino
Geographical mobility - Moved from different county within same state (%) - American Indian and Alaska Native
Geographical mobility - Moved from different county within same state (%) - Multirace
Geographical mobility - Moved from different county within same state (%) - Other Race
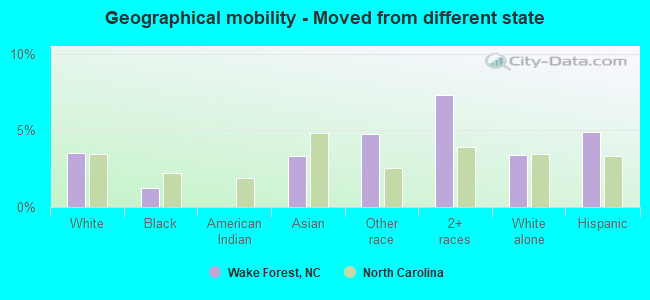
Geographical mobility - Moved from different state (%)
Geographical mobility - Moved from different state (%) - White
Geographical mobility - Moved from different state (%) - Black or African American
Geographical mobility - Moved from different state (%) - Asian
Geographical mobility - Moved from different state (%) - Hispanic or Latino
Geographical mobility - Moved from different state (%) - American Indian and Alaska Native
Geographical mobility - Moved from different state (%) - Multirace
Geographical mobility - Moved from different state (%) - Other Race
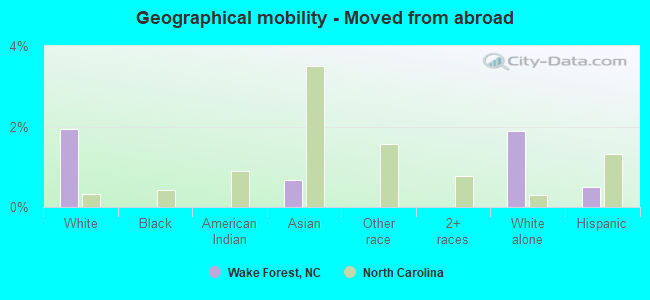
Geographical mobility - Moved from abroad (%)
Geographical mobility - Moved from abroad (%) - White
Geographical mobility - Moved from abroad (%) - Black or African American
Geographical mobility - Moved from abroad (%) - Asian
Geographical mobility - Moved from abroad (%) - Hispanic or Latino
Geographical mobility - Moved from abroad (%) - American Indian and Alaska Native
Geographical mobility - Moved from abroad (%) - Multirace
Geographical mobility - Moved from abroad (%) - Other Race
Place of birth for the foreign-born population - Ireland (%)
Place of birth for the foreign-born population - Denmark (%)
Place of birth for the foreign-born population - Norway (%)
Place of birth for the foreign-born population - Sweden (%)
Place of birth for the foreign-born population - United Kingdom (%)
Place of birth for the foreign-born population - England (%)
Place of birth for the foreign-born population - Scotland (%)
Place of birth for the foreign-born population - Other Northern Europe (%)
Place of birth for the foreign-born population - Austria (%)
Place of birth for the foreign-born population - Belgium (%)
Place of birth for the foreign-born population - France (%)
Place of birth for the foreign-born population - Germany (%)
Place of birth for the foreign-born population - Netherlands (%)
Place of birth for the foreign-born population - Switzerland (%)
Place of birth for the foreign-born population - Other Western Europe (%)
Place of birth for the foreign-born population - Greece (%)
Place of birth for the foreign-born population - Italy (%)
Place of birth for the foreign-born population - Portugal (%)
Place of birth for the foreign-born population - Spain (%)
Place of birth for the foreign-born population - Other Southern Europe (%)
Place of birth for the foreign-born population - Albania (%)
Place of birth for the foreign-born population - Belarus (%)
Place of birth for the foreign-born population - Bosnia and Herzegovina (%)
Place of birth for the foreign-born population - Bulgaria (%)
Place of birth for the foreign-born population - Croatia (%)
Place of birth for the foreign-born population - Czechoslovakia (%)
Place of birth for the foreign-born population - Hungary (%)
Place of birth for the foreign-born population - Latvia (%)
Place of birth for the foreign-born population - Lithuania (%)
Place of birth for the foreign-born population - North Macedonia (Macedonia) (%)
Place of birth for the foreign-born population - Moldova (%)
Place of birth for the foreign-born population - Poland (%)
Place of birth for the foreign-born population - Romania (%)
Place of birth for the foreign-born population - Russia (%)
Place of birth for the foreign-born population - Serbia (%)
Place of birth for the foreign-born population - Ukraine (%)
Place of birth for the foreign-born population - Other Eastern Europe (%)
Place of birth for the foreign-born population - China (%)
Place of birth for the foreign-born population - Hong Kong (%)
Place of birth for the foreign-born population - Taiwan (%)
Place of birth for the foreign-born population - Japan (%)
Place of birth for the foreign-born population - Korea (%)
Place of birth for the foreign-born population - Other Eastern Asia (%)
Place of birth for the foreign-born population - Afghanistan (%)
Place of birth for the foreign-born population - Bangladesh (%)
Place of birth for the foreign-born population - India (%)
Place of birth for the foreign-born population - Iran (%)
Place of birth for the foreign-born population - Kazakhstan (%)
Place of birth for the foreign-born population - Nepal (%)
Place of birth for the foreign-born population - Pakistan (%)
Place of birth for the foreign-born population - Sri Lanka (%)
Place of birth for the foreign-born population - Uzbekistan (%)
Place of birth for the foreign-born population - Other South Central Asia (%)
Place of birth for the foreign-born population - Burma (%)
Place of birth for the foreign-born population - Cambodia (%)
Place of birth for the foreign-born population - Indonesia (%)
Place of birth for the foreign-born population - Laos (%)
Place of birth for the foreign-born population - Malaysia (%)
Place of birth for the foreign-born population - Philippines (%)
Place of birth for the foreign-born population - Singapore (%)
Place of birth for the foreign-born population - Thailand (%)
Place of birth for the foreign-born population - Vietnam (%)
Place of birth for the foreign-born population - Other South Eastern Asia (%)
Place of birth for the foreign-born population - Armenia (%)
Place of birth for the foreign-born population - Iraq (%)
Place of birth for the foreign-born population - Israel (%)
Place of birth for the foreign-born population - Jordan (%)
Place of birth for the foreign-born population - Kuwait (%)
Place of birth for the foreign-born population - Lebanon (%)
Place of birth for the foreign-born population - Saudi Arabia (%)
Place of birth for the foreign-born population - Syria (%)
Place of birth for the foreign-born population - Turkey (%)
Place of birth for the foreign-born population - Yemen (%)
Place of birth for the foreign-born population - Other Western Asia (%)
Place of birth for the foreign-born population - Eritrea (%)
Place of birth for the foreign-born population - Ethiopia (%)
Place of birth for the foreign-born population - Kenya (%)
Place of birth for the foreign-born population - Somalia (%)
Place of birth for the foreign-born population - Uganda (%)
Place of birth for the foreign-born population - Zimbabwe (%)
Place of birth for the foreign-born population - Other Eastern Africa (%)
Place of birth for the foreign-born population - Cameroon (%)
Place of birth for the foreign-born population - Congo (%)
Place of birth for the foreign-born population - Democratic Republic of Congo (Zaire) (%)
Place of birth for the foreign-born population - Other Middle Africa (%)
Place of birth for the foreign-born population - Egypt (%)
Place of birth for the foreign-born population - Morocco (%)
Place of birth for the foreign-born population - Sudan (%)
Place of birth for the foreign-born population - Other Northern Africa (%)
Place of birth for the foreign-born population - South Africa (%)
Place of birth for the foreign-born population - Other Southern Africa (%)
Place of birth for the foreign-born population - Cabo Verde (%)
Place of birth for the foreign-born population - Ghana (%)
Place of birth for the foreign-born population - Liberia (%)
Place of birth for the foreign-born population - Nigeria (%)
Place of birth for the foreign-born population - Senegal (%)
Place of birth for the foreign-born population - Sierra Leone (%)
Place of birth for the foreign-born population - Other Western Africa (%)
Place of birth for the foreign-born population - Australia (%)
Place of birth for the foreign-born population - New Zealand (%)
Place of birth for the foreign-born population - Fiji (%)
Place of birth for the foreign-born population - Micronesia (%)
Place of birth for the foreign-born population - Bahamas (%)
Place of birth for the foreign-born population - Barbados (%)
Place of birth for the foreign-born population - Cuba (%)
Place of birth for the foreign-born population - Dominica (%)
Place of birth for the foreign-born population - Dominican Republic (%)
Place of birth for the foreign-born population - Grenada (%)
Place of birth for the foreign-born population - Haiti (%)
Place of birth for the foreign-born population - Jamaica (%)
Place of birth for the foreign-born population - St. Vincent and the Grenadines (%)
Place of birth for the foreign-born population - Trinidad and Tobago (%)
Place of birth for the foreign-born population - West Indies (%)
Place of birth for the foreign-born population - Other Caribbean (%)
Place of birth for the foreign-born population - Belize (%)
Place of birth for the foreign-born population - Costa Rica (%)
Place of birth for the foreign-born population - El Salvador (%)
Place of birth for the foreign-born population - Guatemala (%)
Place of birth for the foreign-born population - Honduras (%)
Place of birth for the foreign-born population - Mexico (%)
Place of birth for the foreign-born population - Nicaragua (%)
Place of birth for the foreign-born population - Panama (%)
Place of birth for the foreign-born population - Other Central America (%)
Place of birth for the foreign-born population - Argentina (%)
Place of birth for the foreign-born population - Bolivia (%)
Place of birth for the foreign-born population - Brazil (%)
Place of birth for the foreign-born population - Chile (%)
Place of birth for the foreign-born population - Colombia (%)
Place of birth for the foreign-born population - Ecuador (%)
Place of birth for the foreign-born population - Guyana (%)
Place of birth for the foreign-born population - Peru (%)
Place of birth for the foreign-born population - Uruguay (%)
Place of birth for the foreign-born population - Venezuela (%)
Place of birth for the foreign-born population - Other South America (%)
Place of birth for the foreign-born population - Canada (%)
Place of birth for the foreign-born population - Other Northern America (%)
Place of birth for the foreign-born population - Other (%)
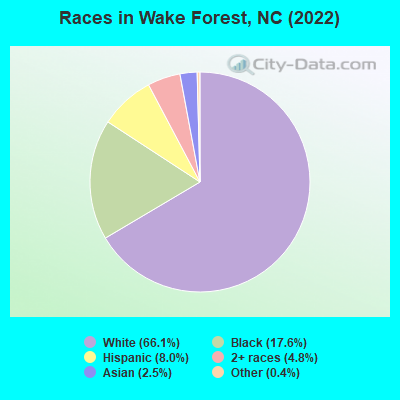
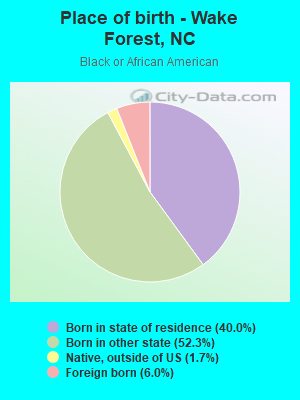
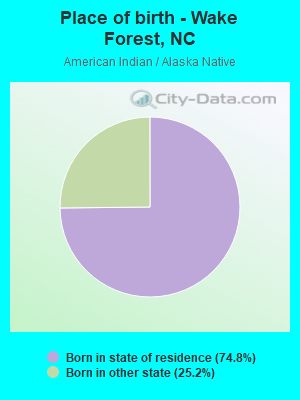
According to 2022 data, the most numerous races in Wake Forest, NC are White alone (32,946 residents), Black alone (8,778 residents), and Hispanic (3,986 residents). 89.5% of Wake Forest residents speak English at home. 7.2% of Wake Forest, NC residents are foreign-born (2.1% born in Latin America, 2.1% born in Asia, 1.4% born in Europe, 1.1% born in Africa), which is 11.0% less than the foreign-born rate of 8.0% across the entire state of North Carolina.
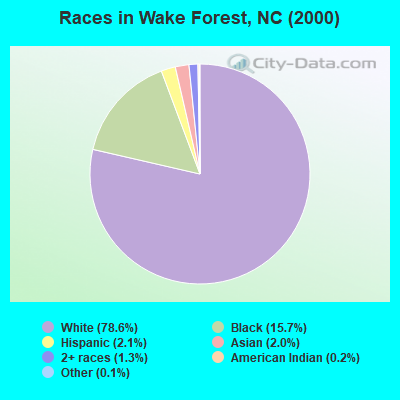
Race distribution in Wake Forest
2000 2022
5,647,155 70.2% White alone 1,723,301 21.4% Black alone 378,963 4.7% Hispanic 112,416 1.4% Asian alone 95,333 1.2% American Indian alone 79,965 1.0% Two or more races 9,015 0.1% Other race alone 3,165 0.04% Native Hawaiian and Other
6,497,519 60.7% White alone 2,155,650 20.1% Black alone 1,114,799 10.4% Hispanic 438,061 4.1% Two or more races 341,052 3.2% Asian alone 91,758 0.9% American Indian alone 50,180 0.5% Other race alone 9,954 0.09% Native Hawaiian and Other
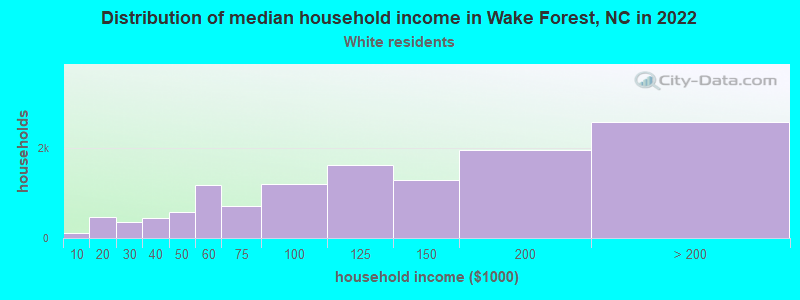
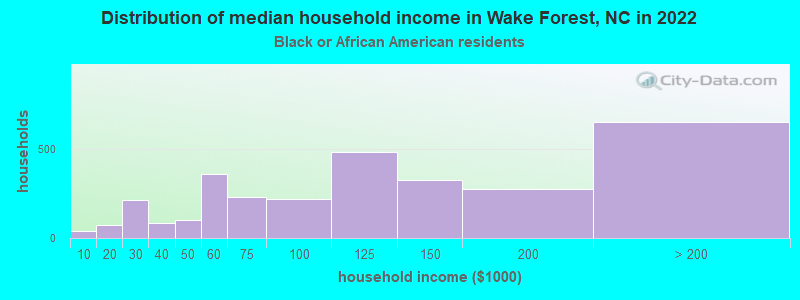
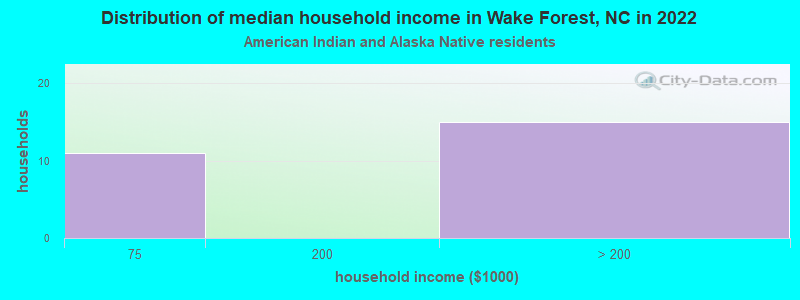
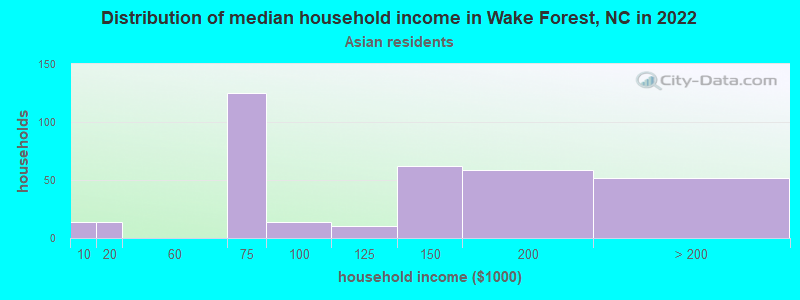
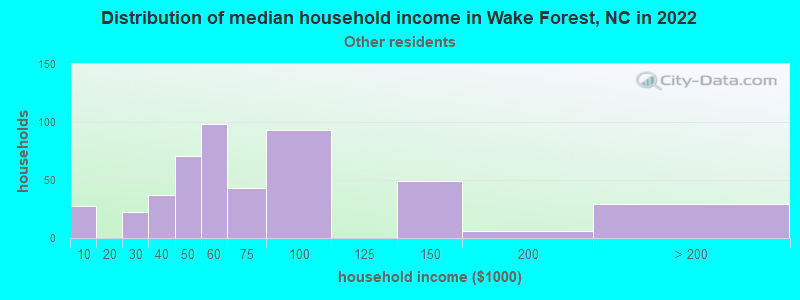
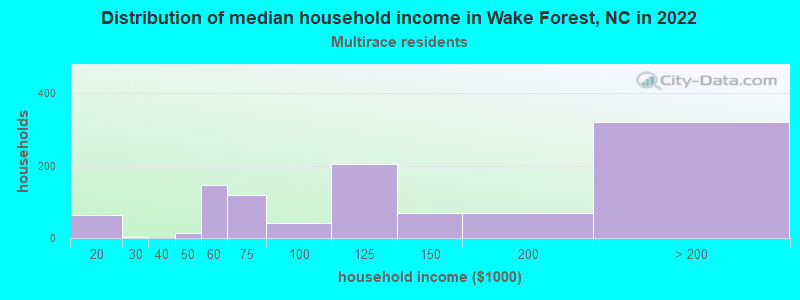
Income and house value in Wake Forest Median household income in 2022 $115,698 White non-Hispanic householders$120,090 Black householders$124,146 Asian householders$60,821 Some other race householders$119,030 Two or more races householders$74,673 Hispanic or Latino race householdersMedian 2022 house value $498,081 White Non-Hispanic householders$317,053 Black or African American householders$511,376 American Indian or Alaska Native householders $461,602 Asian householders$937,524 Native Hawaiian and other Pacific Islander householders$409,101 Some other race householders$475,921 Two or more races householders$534,218 Hispanic or Latino householders
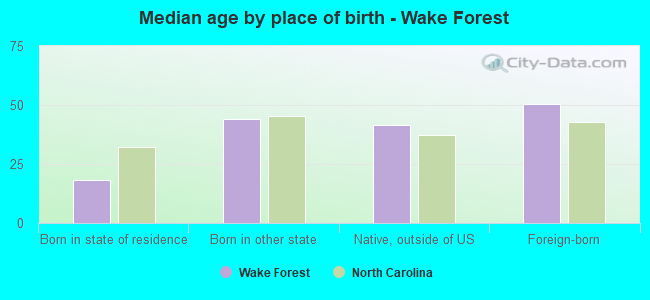
Median age by race in Wake Forest
40.5 Median age for White residents38.0 41.7 43.2 Median age for Black or African American residents44.9 41.4 32.4 Median age for American Indian / Alaska Native residents-444,444,444.0 -679,313,459.1 46.6 Median age for Asian residents49.2 41.3 -609,884,331.7 Median age for Native Hawaiian / Pacific Islander residents-611,708,482.1 -612,403,100.2 26.7 Median age for Other race residents23.5 32.2 21.6 Median age for Two or more races residents24.5 17.0 40.1 Median age for White alone residents38.2 41.2 24.2 Median age for Hispanic or Latino residents21.1 28.7
Owner/renter occupied households by race in Wake Forest
House owners and renters - White residents 9,804 78.2% Owner occupied2,732 21.8% Renter occupiedHouse owners and renters - Black or African American residents 1,629 56.3% Owner occupied1,264 43.7% Renter occupiedHouse owners and renters - American Indian / Alaska Native residents 14 100.0% Owner occupiedHouse owners and renters - Asian residents 291 84.5% Owner occupied53 15.5% Renter occupiedHouse owners and renters - Other race residents 204 39.8% Owner occupied309 60.2% Renter occupiedHouse owners and renters - Two or more races residents 839 83.5% Owner occupied166 16.5% Renter occupiedHouse owners and renters - White alone residents 9,753 78.4% Owner occupied2,689 21.6% Renter occupiedHouse owners and renters - Hispanic or Latino residents 641 63.1% Owner occupied375 36.9% Renter occupied
Language usage in Wake Forest
English speakers - Total 89.5% of residents of Wake Forest speak English at home.
4.4% of residents speak Spanish at home 1,508 74.5% Speak English very well517 25.5% Speak English less than very well5.6% of residents speak other language at home 2,258 87.6% Speak English very well319 12.4% Speak English less than very well
English speakers - Born in the United States 95.7% of residents of Wake Forest speak English at home.
2.6% of residents speak Spanish at home 645 91.7% Speak English very well58 8.3% Speak English less than very well1.3% of residents speak other language at home 338 100.0% Speak English very well
English speakers - Native, born elsewhere 78.9% of residents of Wake Forest speak English at home.
24.5% of residents speak Spanish at home 37 24.8% Speak English very well112 75.2% Speak English less than very well
English speakers - Foreign-born 24.4% of residents of Wake Forest speak English at home.
23.3% of residents speak Spanish at home 540 61.3% Speak English very well341 38.7% Speak English less than very well54.2% of residents speak other language at home 1,748 85.3% Speak English very well301 14.7% Speak English less than very well
White (Caucasian) - Speak only English Native:
98.3% (29,251)Foreign-born:
50.0% (619)
White (Caucasian) - Speak another language Native:
1.8% (549)Foreign-born:
52.6% (652)
Black or African American - Speak only English Native:
98.9% (7,860)Foreign-born:
13.1% (69)
Black or African American - Speak another language Native:
0.7% (52)Foreign-born:
91.5% (478)
Asian - Speak only English Native:
82.7% (128)Foreign-born:
8.1% (83)
Asian - Speak another language Native:
14.7% (23)Foreign-born:
91.7% (934)
Other race - Speak only English Native:
39.1% (409)Foreign-born:
3.1% (15)
Other race - Speak another language Native:
59.3% (620)Foreign-born:
96.7% (477)
Two or more races - Speak only English Native:
85.7% (2,835)Foreign-born:
35.2% (152)
Two or more races - Speak another language Native:
14.5% (479)Foreign-born:
55.9% (241)
White alone - Speak only English Native:
98.2% (28,977)Foreign-born:
53.7% (627)
White alone - Speak another language Native:
1.7% (508)Foreign-born:
46.6% (544)
Hispanic or Latino - Speak only English Native:
59.6% (1,373)Foreign-born:
8.4% (77)
Hispanic or Latino - Speak another language Native:
42.1% (971)Foreign-born:
91.4% (844)
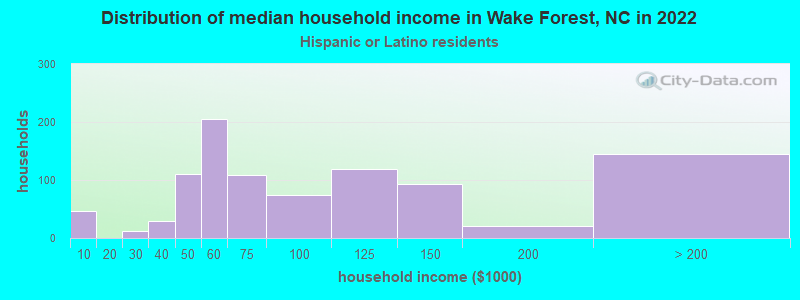
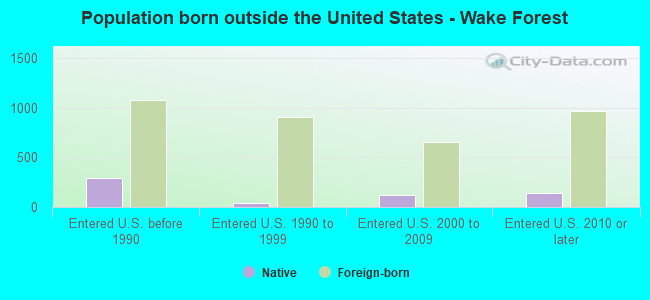
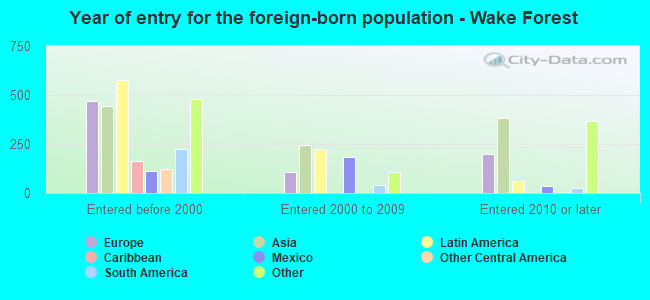
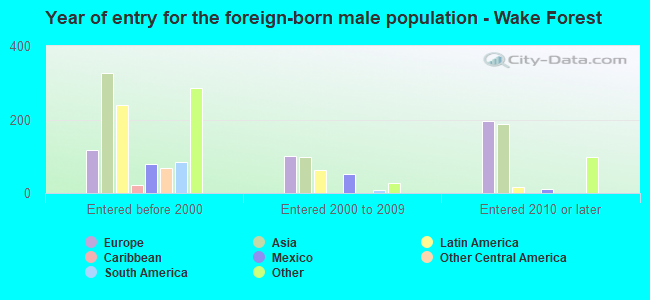
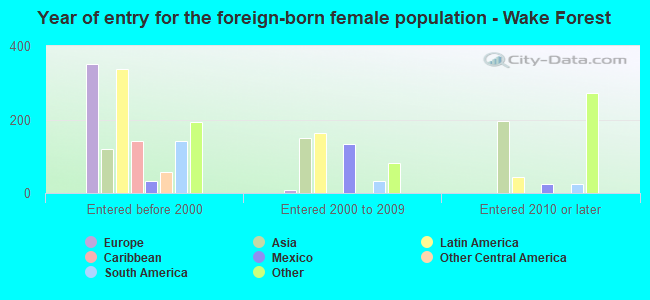
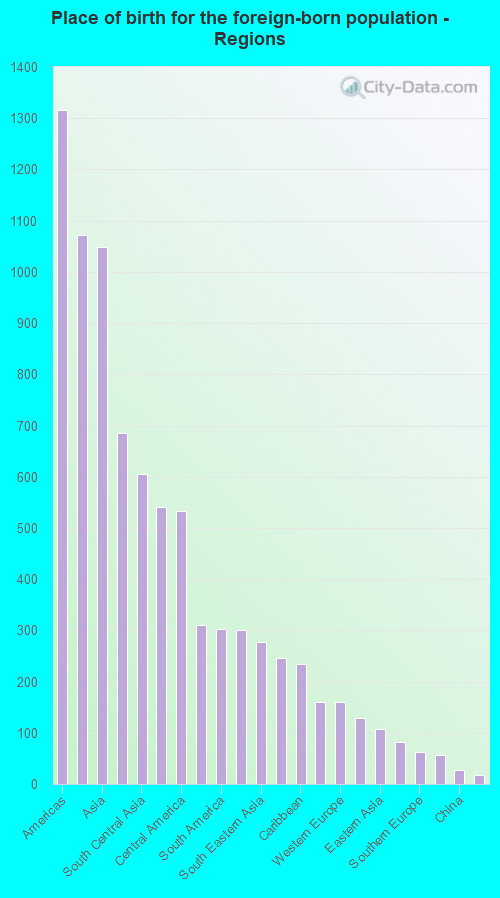
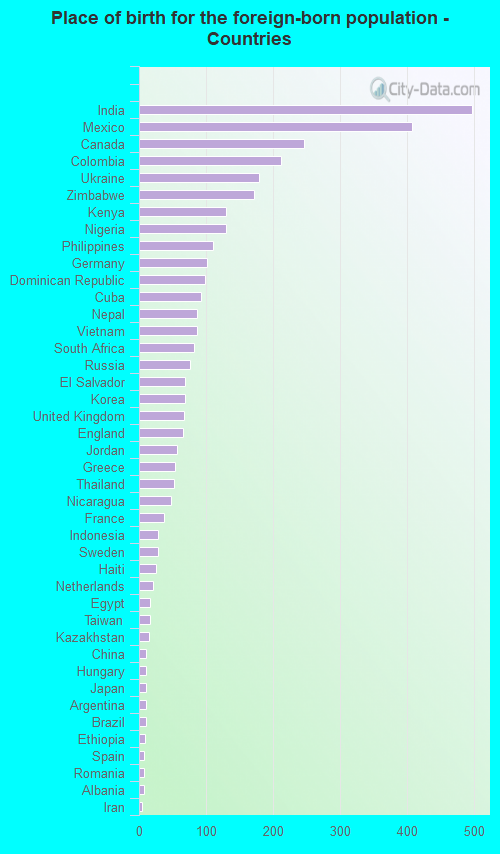
Foreign-born residents in Wake Forest 3,594 residents are foreign born (2.1% Latin America , 2.1% Asia , 1.4% Europe , 1.1% Africa ).
This city:
7.2%North Carolina:
8.3%
Marital status for residents in Wake Forest Marital status - White (Caucasian) population 15 years and over
Males 22.5% Never married67.0% Now married1.8% Separated1.0% Widowed7.7% DivorcedFemales 17.7% Never married62.1% Now married2.8% Separated7.6% Widowed9.9% DivorcedWomen who gave birth in the past 12 months Now married:
96.5% (493)Unmarried:
3.5% (18)
Women who did not give birth in the past 12 months Now married:
62.2% (4,591)Unmarried:
37.8% (2,792)
Marital status - Black or African American population 15 years and over
Males 45.9% Never married42.7% Now married4.1% Separated0.0% Widowed7.3% DivorcedFemales 35.5% Never married36.4% Now married0.4% Separated3.6% Widowed24.2% DivorcedWomen who gave birth in the past 12 months Now married:
2.6% (3)Unmarried:
97.4% (112)
Women who did not give birth in the past 12 months Now married:
28.7% (661)Unmarried:
71.3% (1,646)
Marital status - American Indian / Alaska Native population 15 years and over
Males 0.0% Never married100.0% Now married0.0% Separated0.0% Widowed0.0% DivorcedFemales 0.0% Never married100.0% Now married0.0% Separated0.0% Widowed0.0% DivorcedWomen who did not give birth in the past 12 months Now married:
100.0% (12)Unmarried:
0.0% (0)
Marital status - Asian population 15 years and over
Males 12.4% Never married54.5% Now married0.0% Separated0.0% Widowed33.1% DivorcedFemales 16.6% Never married64.9% Now married4.7% Separated11.1% Widowed2.7% DivorcedWomen who gave birth in the past 12 months Now married:
100.0% (29)Unmarried:
0.0% (0)
Women who did not give birth in the past 12 months Now married:
71.4% (181)Unmarried:
28.6% (73)
Marital status - Other race population 15 years and over
Males 50.2% Never married45.6% Now married0.0% Separated0.0% Widowed4.2% DivorcedFemales 35.3% Never married37.2% Now married9.9% Separated6.8% Widowed10.8% DivorcedWomen who gave birth in the past 12 months Now married:
100.0% (22)Unmarried:
0.0% (0)
Women who did not give birth in the past 12 months Now married:
44.3% (241)Unmarried:
55.7% (304)
Marital status - Two or more races population 15 years and over
Males 57.9% Never married41.0% Now married1.1% Separated0.0% Widowed0.0% DivorcedFemales 30.6% Never married58.9% Now married0.0% Separated7.7% Widowed2.7% DivorcedWomen who gave birth in the past 12 months Now married:
100.0% (27)Unmarried:
0.0% (0)
Women who did not give birth in the past 12 months Now married:
47.6% (377)Unmarried:
52.4% (415)
Marital status - White alone, not Hispanic / Latino population 15 years and over
Males 22.1% Never married67.2% Now married1.8% Separated1.0% Widowed7.9% DivorcedFemales 17.5% Never married62.2% Now married2.3% Separated7.8% Widowed10.3% DivorcedWomen who gave birth in the past 12 months Now married:
96.4% (487)Unmarried:
3.6% (18)
Women who did not give birth in the past 12 months Now married:
62.5% (4,545)Unmarried:
37.5% (2,726)
Marital status - Hispanic or Latino population 15 years and over
Males 35.1% Never married62.4% Now married0.0% Separated0.0% Widowed2.6% DivorcedFemales 26.5% Never married54.7% Now married9.4% Separated4.5% Widowed4.9% DivorcedWomen who gave birth in the past 12 months Now married:
44.7% (36)Unmarried:
55.3% (44)
Women who did not give birth in the past 12 months Now married:
52.8% (458)Unmarried:
47.2% (410)
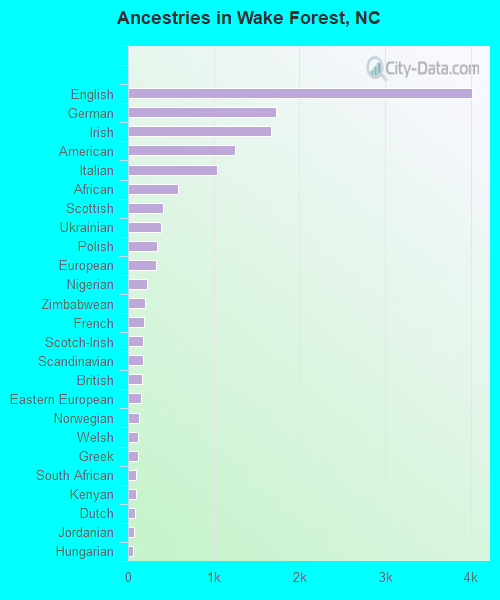
Ancestries in Wake Forest
4,012 16.8% English1,729 7.3% German1,674 7.0% Irish1,247 5.2% American1,039 4.4% Italian581 2.4% African414 1.7% Scottish390 1.6% Ukrainian339 1.4% Polish329 1.4% European221 0.9% Nigerian195 0.8% Zimbabwean184 0.8% French179 0.8% Scotch-Irish171 0.7% Scandinavian167 0.7% British156 0.7% Eastern European124 0.5% Norwegian119 0.5% Welsh117 0.5% Greek97 0.4% South African94 0.4% Kenyan87 0.4% Dutch72 0.3% Jordanian59 0.2% Hungarian59 0.2% West Indian58 0.2% Portuguese58 0.2% Swedish44 0.2% Slovak39 0.2% Czechoslovakian28 0.1% Croatian27 0.1% Slavic25 0.1% Russian24 0.1% Czech23 0.10% Pennsylvania German22 0.09% French Canadian17 0.07% Northern European16 0.07% Lithuanian14 0.06% Haitian10 0.04% Serbian10 0.04% Lebanese9 0.04% Egyptian9 0.04% Ethiopian8 0.03% Swiss6 0.03% Brazilian6 0.03% Belgian
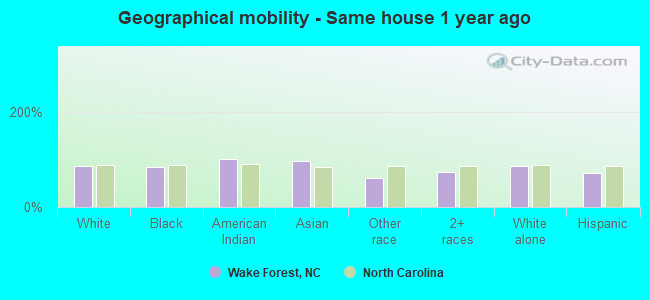
Geographical mobility in Wake Forest Same house 1 year ago 28,267 86.0% White (Caucasian)7,243 83.8% Black or African American38 100.0% American Indian / Alaska Native1,190 97.0% Asian950 60.0% Other race3,394 72.9% Two or more races28,086 86.1% White alone, not Hispanic / Latino2,814 71.5% Hispanic or LatinoMoved within same county 1,929 5.9% White / Caucasian945 10.9% Black or African American15 1.2% Asian283 17.8% Other race762 16.4% Two or more races1,903 5.8% White alone, not Hispanic / Latino774 19.7% Hispanic or LatinoMoved within same state 859 2.6% White / Caucasian223 2.6% Black or African American232 14.6% Other race104 2.2% Two or more races873 2.7% White alone, not Hispanic / Latino127 3.2% Hispanic or LatinoMoved from different state 1,160 3.5% White / Caucasian105 1.2% Black or African American41 3.3% Asian75 4.8% Other race341 7.3% Two or more races1,105 3.4% White alone, not Hispanic / Latino192 4.9% Hispanic or LatinoMoved from abroad 634 1.9% White8 0.7% Asian617 1.9% White alone, not Hispanic / Latino20 0.5% Hispanic or Latino
Children Nativity (place of birth) in Wake Forest
Children under 6 years - Living with two parents Both parents native 3,039 100.0% NativeBoth parents foreign-born 180 100.0% NativeOne native, one foreign-born parent 105 100.0% NativeChildren under 6 years - Living with one parent Native parent 614 100.0% NativeChildren 6 to 17 years - Living with two parents Both parents native 5,787 99.9% Native5 0.1% Foreign-bornBoth parents foreign-born 498 85.8% Native82 14.2% Foreign-bornOne native, one foreign-born parent 514 100.0% NativeChildren 6 to 17 years - Living with one parent Native parent 1,597 100.0% NativeForeign-born parent 287 52.0% Native265 48.0% Foreign-born
Grandparents responsible for own grandchildren in Wake Forest
Grandparents (30 to 59 years) White / Caucasian 95 47.7% Responsible for grandchildren104 52.3% Not responsible for grandchildrenBlack or African American 60 100.0% Responsible for grandchildrenWhite alone, not Hispanic / Latino 99 48.9% Responsible for grandchildren103 51.1% Not responsible for grandchildrenGrandparents (60 years and over) White / Caucasian 30 10.1% Responsible for grandchildren271 89.9% Not responsible for grandchildrenBlack or African American 66 100.0% Not responsible for grandchildrenWhite alone, not Hispanic / Latino 31 9.6% Responsible for grandchildren293 90.4% Not responsible for grandchildren