Valley Falls, RI (Rhode Island) Houses and Residents
| Valley Falls: | $374,885 |
| Rhode Island: | $383,900 |
Mean price in 2022:
Detached houses: $365,637
Here: $365,637 State: $445,354 Townhouses or other attached units: $297,847
Here: $297,847 State: $371,092 In 2-unit structures: $337,736
Here: $337,736 State: $317,098 In 3-to-4-unit structures: $267,078
Here: $267,078 State: $315,052
Total population: 11,547 (Urban population: 11,537, Rural population: 0)
Houses: 5,147 (4,955 occupied: 3,604 owner occupied, 1,517 renter occupied)
| % of renters here: | 30% |
| State: | 37% |
Housing density: 1,451 houses/condos per square mile
Median price asked for vacant for-sale houses and condos in 2022 in this county: $275,451.
Median contract rent in 2022: $1,014 (lower quartile is $647, upper quartile is $1,297)
Median rent asked for vacant for-rent units in 2022: $1,099
Median gross rent in Valley Falls, RI in 2022: $1,125
Housing units in Valley Falls with a mortgage: 2,489 (459 second mortgage, 0 home equity loan, 330 both second mortgage and home equity loan)
Houses without a mortgage: 87
Median household income for houses/condos with a mortgage: $128,158
Median household income for apartments without a mortgage: $78,588
Median monthly housing costs: $1,346
Compare current foreclosures near Valley Falls, RI:
| Photo | Address | Area | Beds / Baths | Price | Details |
|---|---|---|---|---|---|

|
#1
Whittier Ave
Providence, RI 02909
|
3 sq. feet
|
3 baths 6 beds |
$109,900
|
show details |

|
#2
Somerset Ave
Taunton, MA 02780
|
3,196 sq. feet
|
3 baths 4 beds |
$754,900
|
show details |

|
#3
Mount Pleasant Rd
Harrisville, RI 02830
|
1,232 sq. feet
|
1 baths 3 beds |
$449,900
|
show details |

|
#4
Loomis St
North Attleboro, MA 02760
|
2,294 sq. feet
|
2 baths 4 beds |
$700,000
|
show details |

|
#5
Cook Rd
Cumberland, RI 02864
|
2,050 sq. feet
|
2 baths 4 beds |
$724,900
|
show details |

|
#6
Pequot Ave
Warwick, RI 02889
|
1,858 sq. feet
|
2 baths 3 beds |
$290,000
|
show details |

|
#7
Broadway
North Attleboro, MA 02760
|
2,602 sq. feet
|
3 baths 5 beds |
show details | |

|
#8
Post Rd
Warwick, RI 02888
|
6,746 sq. feet
|
3 baths 7 beds |
show details | |

|
#9
Valley Green Court
Providence, RI 02904
|
1,440 sq. feet
|
3 baths 2 beds |
show details | |

|
#10
Ashland St
Taunton, MA 02780
|
1,680 sq. feet
|
2 baths 4 beds |
show details |
| Photo | Address | Area | Beds / Baths | Price | Details |
|---|---|---|---|---|---|

|
#11
Suburban Pkwy
Warwick, RI 02889
|
1,872 sq. feet
|
3 baths 5 beds |
show details | |

|
#12
Verndale St
Warwick, RI 02889
|
1,206 sq. feet
|
1 baths 2 beds |
show details | |

|
#13
Hillwood St
Cranston, RI 02920
|
1,800 sq. feet
|
2 baths 4 beds |
show details | |

|
#14
What Cheer Ave
Providence, RI 02909
|
2,280 sq. feet
|
2 baths 3 beds |
show details | |

|
#15
N Main St
Pascoag, RI 02859
|
- sq. feet
|
- baths - beds |
$100,000
|
show details |

|
#16
Woburn St
Cranston, RI 02910
|
1,212 sq. feet
|
1 baths 4 beds |
show details | |

|
#17
Bishop Hill Rd
Johnston, RI 02919
|
1,248 sq. feet
|
1 baths 3 beds |
show details | |

|
#18
Bishop Hill Rd
Johnston, RI 02919
|
1,648 sq. feet
|
1 baths 3 beds |
show details | |

|
#19
Scranton Ave
Warwick, RI 02888
|
1,524 sq. feet
|
2 baths 3 beds |
show details | |

|
#20
Pond St
Franklin, MA 02038
|
1,100 sq. feet
|
1 baths 3 beds |
show details |
| Photo | Address | Area | Beds / Baths | Price | Details |
|---|---|---|---|---|---|

|
#21
Woodland Ave
Seekonk, MA 02771
|
4,611 sq. feet
|
4 baths 4 beds |
show details | |

|
#22
Chace Ave
Warren, RI 02885
|
1,224 sq. feet
|
1 baths 2 beds |
show details | |

|
#23
Riverside Rd
Franklin, MA 02038
|
3,093 sq. feet
|
2 baths 4 beds |
show details | |

|
#24
Wood St
Providence, RI 02909
|
2,839 sq. feet
|
3 baths 8 beds |
show details | |

|
#25
Dwinell Rd
Taunton, MA 02780
|
1,632 sq. feet
|
2 baths 4 beds |
show details | |

|
#26
Mayo Dr
Warren, RI 02885
|
1,739 sq. feet
|
1 baths 3 beds |
show details | |

|
#27
Follett St
East Providence, RI 02914
|
1,584 sq. feet
|
2 baths 4 beds |
show details | |

|
#28
Edgemere Ave
Providence, RI 02909
|
1,328 sq. feet
|
2 baths 4 beds |
show details | |

|
#29
Pinnery Ave
Warwick, RI 02886
|
1,299 sq. feet
|
1 baths 3 beds |
show details | |

|
#30
Detroit Ave
Warren, RI 02885
|
1,518 sq. feet
|
1 baths 3 beds |
show details |
| Photo | Address | Area | Beds / Baths | Price | Details |
|---|---|---|---|---|---|

|
#31
Spooner Ave
Warwick, RI 02886
|
1,777 sq. feet
|
2 baths 4 beds |
show details | |

|
#32
Blanding Ave
East Providence, RI 02914
|
1,165 sq. feet
|
1 baths 3 beds |
show details | |

|
#33
Guertin St
West Warwick, RI 02893
|
1,338 sq. feet
|
2 baths 4 beds |
show details | |

|
#34
Pridemark Ln
Attleboro, MA 02703
|
1,340 sq. feet
|
1 baths 2 beds |
show details | |

|
#35
Atwood Ave
Johnston, RI 02919
|
1,792 sq. feet
|
2 baths 4 beds |
show details | |

|
#36
Bracken St
Cranston, RI 02920
|
1,248 sq. feet
|
1 baths 4 beds |
show details | |

|
#37
Berkshire Ave
Sharon, MA 02067
|
1,289 sq. feet
|
2 baths 3 beds |
show details | |

|
#38
Atwood Ave
Johnston, RI 02919
|
1,792 sq. feet
|
1 baths 4 beds |
show details | |

|
#39
Hawthorne Ave # 2
Cranston, RI 02910
|
2,123 sq. feet
|
2 baths 4 beds |
show details | |

|
#40
Vinnicum Rd
Swansea, MA 02777
|
1,867 sq. feet
|
1 baths 2 beds |
show details |
| Photo | Address | Area | Beds / Baths | Price | Details |
|---|---|---|---|---|---|

|
#41
Oak St
Norton, MA 02766
|
1,652 sq. feet
|
1 baths 3 beds |
show details | |

|
#42
Ironstone St
Millville, MA 01529
|
924 sq. feet
|
1 baths 4 beds |
show details | |

|
#43
Pratt St
Mansfield, MA 02048
|
1,804 sq. feet
|
1 baths 1 beds |
show details | |

|
#44
Providence St
Mendon, MA 01756
|
2,608 sq. feet
|
2 baths 4 beds |
show details | |

|
#45
Elmhurst Dr
Greenville, RI 02828
|
1,808 sq. feet
|
2 baths 3 beds |
show details | |

|
#46
Whitney St
Providence, RI 02907
|
2,990 sq. feet
|
2 baths 8 beds |
show details | |

|
#47
Crane St
Norton, MA 02766
|
2,488 sq. feet
|
3 baths 4 beds |
show details | |

|
#48
Foote St # 2
Barrington, RI 02806
|
1,365 sq. feet
|
2 baths 4 beds |
show details | |

|
#49
May St
Blackstone, MA 01504
|
1,529 sq. feet
|
2 baths 4 beds |
show details | |

|
Check over 1 million property listings on Foreclosure.com!
|
browse all offers | |||


 | Another shooting/stabbing. (2066 replies) |
| Moving from South to RI-Need Local Input (36 replies) |
| Vision: 45 Minute Train ride Providence - Boston (17 replies) |
| Do all providence suburbs feel the same (53 replies) |
| Medfield, Mass, Barrington RI, or ??? (18 replies) |
| American wire pawtucket Rhode Island (102 replies) |

Median year apartment built: 1964
Household type by relationship:
Households: 12,059- Male householders: 2,754 (451 living alone), Female householders: 2,171 (757 living alone)
2,534 spouses (2,522 opposite-sex spouses), 334 unmarried partners, (334 opposite-sex unmarried partners), 3,447 children (3,171 natural, 134 adopted, 140 stepchildren), 44 grandchildren, 88 brothers or sisters, 146 parents, 93 foster children, 113 other relatives, 267 non-relatives
- In group quarters: 60
Size of family households: 1,730 2-persons, 857 3-persons, 632 4-persons, 148 5-persons, 18 6-persons, 6 7-or-more-persons.
Size of nonfamily households: 1,292 1-person, 370 2-persons, 35 3-persons.
1,150 married couples with children.
963 single-parent households (685 men, 278 women).
74.6% of residents of Valley Falls speak English at home.
9.7% of residents speak Spanish at home (32% speak English very well, 29% speak English well, 16% speak English not well, 22% don't speak English at all).
13.2% of residents speak other Indo-European language at home (59% speak English very well, 23% speak English well, 13% speak English not well, 6% don't speak English at all).
0.2% of residents speak Asian or Pacific Island language at home (50% speak English very well, 50% speak English well).
1.6% of residents speak other language at home (100% speak English very well).
Foreign born population: 1,850 (15.3%)
(59.8% of them are naturalized citizens)
| Here: | 6.1 |
| State: | 6.2 |
| Here: | 4.0 |
| State: | 4.1 |

- Bedrooms in owner-occupied houses and condos in Valley Falls, Rhode Island
- 0no bedroom
- 781 bedroom
- 8262 bedrooms
- 1,9043 bedrooms
- 6444 bedrooms
- 1535+ bedrooms

- Bedrooms in renter-occupied apartments in Valley Falls, Rhode Island
- 215no bedroom
- 3021 bedroom
- 7162 bedrooms
- 2853 bedrooms
- 04 bedrooms
- 05+ bedrooms

- Cars and other vehicles available in Valley Falls in owner-occupied houses/condos
- 152no vehicle
- 7701 vehicle
- 1,9782 vehicles
- 3773 vehicles
- 2584 vehicles
- 715+ vehicles

- Cars and other vehicles available in Valley Falls in renter-occupied apartments
- 245no vehicle
- 7701 vehicle
- 3212 vehicles
- 1823 vehicles
- 04 vehicles
- 05+ vehicles

- Rooms in owner-occupied houses in Valley Falls, Rhode Island
- 01 room
- 02 rooms
- 1213 rooms
- 3184 rooms
- 8705 rooms
- 7866 rooms
- 6317 rooms
- 4378 rooms
- 4439+ rooms

- Rooms in renter-occupied apartments in Valley Falls, Rhode Island
- 1841 room
- 1132 rooms
- 1863 rooms
- 5184 rooms
- 2425 rooms
- 2196 rooms
- 47 rooms
- 278 rooms
- 249+ rooms


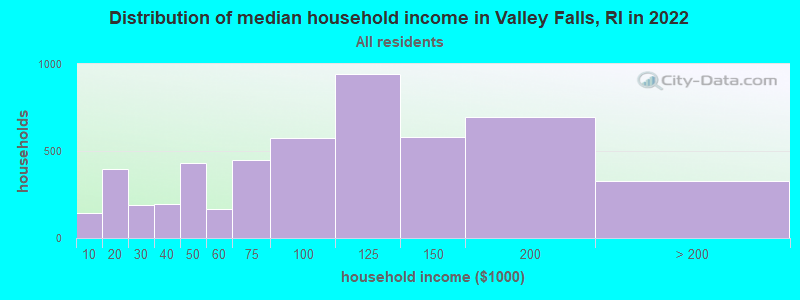
Valley Falls, RI household income distribution

- 141Less than $10,000
- 396$10,000 to $19,999
- 188$20,000 to $29,999
- 198$30,000 to $39,999
- 429$40,000 to $49,999
- 165$50,000 to $59,999
- 446$60,000 to $74,999
- 576$75,000 to $99,999
- 941$100,000 to $124,999
- 583$125,000 to $149,999
- 694$150,000 to $199,999
- 327$200,000 or more
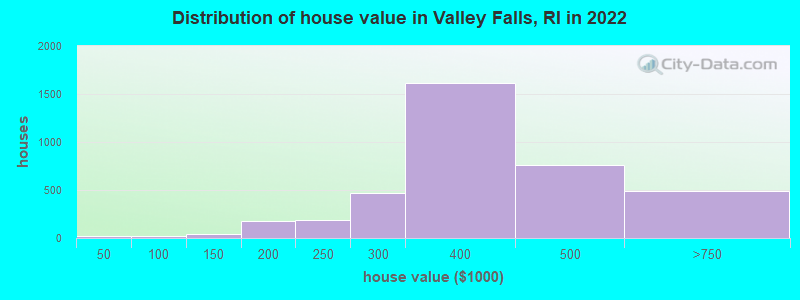
Home value of owner - occupied houses in 2022 in Valley Falls, RI
-
- 25Less than $10,000
- 26$70,000 to $79,999
- 37$100,000 to $124,999
- 137$150,000 to $174,999
- 37$175,000 to $199,999
- 191$200,000 to $249,999
- 463$250,000 to $299,999
- 1,612$300,000 to $399,999
- 756$400,000 to $499,999
- 462$500,000 to $749,999
- 17$750,000 to $999,999
- 11$1,500,000 to $1,999,999
Rent paid by renters in 2022 in Valley Falls, RI
-
- 63$250 to $299
- 22$300 to $349
- 148$400 to $449
- 83$550 to $599
- 35$650 to $699
- 16$700 to $749
- 39$750 to $799
- 131$800 to $899
- 185$900 to $999
- 211$1,000 to $1,249
- 74$1,250 to $1,499
- 329$1,500 to $1,999
- 30No cash rent


Percentage of workers working in this county: 71.6%
Number of people working at home: 502 (7.2% of all workers)
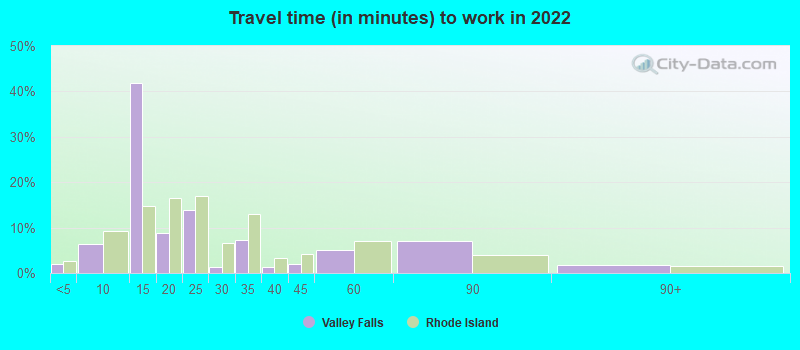
Travel time to work (commute)
- Less than 5 minutes: 134
- 5 to 9 minutes: 293
- 10 to 14 minutes: 868
- 15 to 19 minutes: 1,191
- 20 to 24 minutes: 1,244
- 25 to 29 minutes: 501
- 30 to 34 minutes: 1,142
- 35 to 39 minutes: 182
- 40 to 44 minutes: 244
- 45 to 59 minutes: 293
- 60 to 89 minutes: 109
- 90 or more minutes: 80
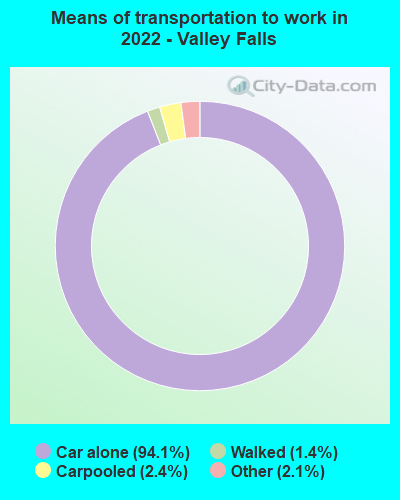
Means of transportation to work:
- Drove a car alone: 1,707 (74.7%)
- Carpooled: 48 (2.1%)
- Taxi: 61 (2.7%)
- Walked: 28 (1.2%)
- Worked at home: 502 (22.0%)

- Unemployment by race in 2022
- Unemployment rate for White non-Hispanic residents
- 1.0%Males
- 3.8%Females
- Unemployment rate for Asian residents
- 26.3%Females
- Unemployment rate for two or more race residents
- 19.7%Males

- Year of entry for the foreign-born population in Valley Falls, Rhode Island
- 3352010 or later
- 2702000 to 2009
- 2971990 to 1999
- 2721980 to 1989
- 6981970 to 1979
- 543Before 1970

First ancestries reported:
- Portuguese: 1,657 (25.1%)
- French: 694 (10.5%)
- French Canadian: 627 (9.5%)
- Irish: 599 (9.1%)
- Italian: 379 (5.7%)
- American: 339 (5.1%)
- English: 290 (4.4%)
- Polish: 158 (2.4%)
- Brazilian: 154 (2.3%)
- German: 123 (1.9%)
- Swedish: 77 (1.2%)
- Assyrian: 60 (0.9%)
- European: 56 (0.8%)
- Canadian: 52 (0.8%)
- Russian: 27 (0.4%)
- African: 23 (0.3%)
- Lebanese: 13 (0.2%)
- Nigerian: 12 (0.2%)
- Norwegian: 9 (0.1%)
- Austrian: 4 (0.06%)
- Trinidadian and Tobagonian: 1 (0.02%)
Most common places of birth for foreign-born residents (%):
| Valley Falls: | 44.7% (832) |
| Rhode Island: | 10.0% (15,766) |
| Valley Falls: | 15.8% (294) |
| Rhode Island: | 1.8% (2,826) |
| Valley Falls: | 11.6% (215) |
| Rhode Island: | 4.1% (6,520) |
| Valley Falls: | 11.1% (206) |
| Rhode Island: | 21.0% (33,163) |
| Valley Falls: | 3.1% (57) |
| Rhode Island: | 0.2% (275) |
| Valley Falls: | 2.4% (44) |
| Rhode Island: | 4.1% (6,461) |
| Valley Falls: | 2.3% (42) |
| Rhode Island: | 2.4% (3,822) |
| Valley Falls: | 1.9% (36) |
| Rhode Island: | 10.4% (16,385) |
Place of birth for U.S.-born residents:
- This state: 6,576
- Other state: 3,271
- Northeast: 2,645
- Midwest: 108
- South: 207
- West: 322
94.2% of Valley Falls residents lived in the same house 1 years ago.
Out of people who lived in different houses, 40.6% lived in this county.
Out of people who lived in different counties, 3.7% lived in Rhode Island.
| Valley Falls: | 94.2% |
| State average: | 89.3% |
Education attainment for males 25 years and older:
- No schooling: 140
- Nursery to 4th grade: 7
- 5th and 6th grade: 145
- 7th and 8th grade: 165
- 9th grade: 62
- 10th grade: 36
- 11th grade: 97
- 12th grade, no diploma: 41
- High school graduate (or equivalency): 1,276
- Less than 1 year of college: 310
- Some college more than 1 year, no degree: 380
- Associate degree: 473
- Bachelor's degree: 964
- Master's degree: 174
- Professional school degree: 25
- Doctorate degree: 30

Education attainment for females 25 years and older:
- No schooling: 87
- Nursery to 4th grade: 150
- 5th and 6th grade: 65
- 7th and 8th grade: 30
- 9th grade: 212
- 10th grade: 25
- 11th grade: 23
- 12th grade, no diploma: 89
- High school graduate (or equivalency): 1,088
- Less than 1 year of college: 373
- Some college more than 1 year, no degree: 669
- Associate degree: 376
- Bachelor's degree: 1,177
- Master's degree: 243
- Professional school degree: 59
- Doctorate degree: 28


Housing units in structures:
- One, detached: 3,395
- One, attached: 105
- Two: 522
- 3 or 4: 683
- 5 to 9: 89
- 50 or more: 350
Housing units lacking complete kitchen facilities in 2022: 3.2%
House/condo owner moved in on average 18 years ago
Renter moved in on average 3 years ago

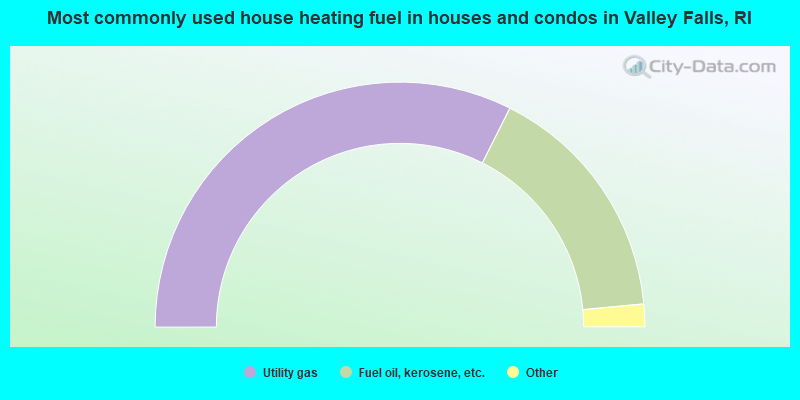
- 64.9%Utility gas
- 32.2%Fuel oil, kerosene, etc.
- 1.5%Electricity
- 1.1%Bottled, tank, or LP gas
- 0.3%Wood
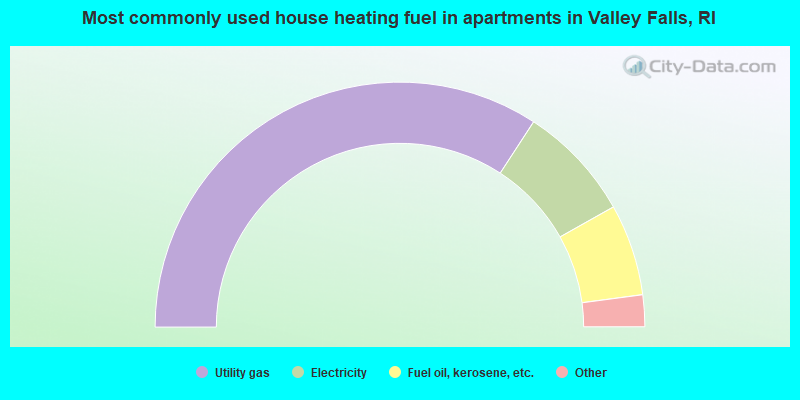
- 68.4%Utility gas
- 15.3%Electricity
- 12.1%Fuel oil, kerosene, etc.
- 2.1%Bottled, tank, or LP gas
- 2.1%No fuel used
Private vs. public school enrollment:
| Here: | 11.0% |
| Rhode Island: | 12.2% |
| Here: | 3.7% |
| Rhode Island: | 11.6% |
| Here: | 26.1% |
| Rhode Island: | 41.1% |


