Races in Valley Falls, Rhode Island (RI) Detailed Stats
Data:
Races - White alone (%)
Races - White alone (% change since 2000)
Races - Black alone (%)
Races - Black alone (% change since 2000)
Races - American Indian alone (%)
Races - American Indian alone (% change since 2000)
Races - Asian alone (%)
Races - Asian alone (% change since 2000)
Races - Hispanic (%)
Races - Hispanic (% change since 2000)
Races - Native Hawaiian and Other Pacific Islander alone (%)
Races - Native Hawaiian and Other Pacific Islander alone (% change since 2000)
Races - Two or more races(%)
Races - Two or more races(% change since 2000)
Races - Other race alone (%)
Races - Other race alone (% change since 2000)
Racial diversity
Place of birth - Born in state of residence (%)
Place of birth - Born in state of residence (%) - White
Place of birth - Born in state of residence (%) - Black or African American
Place of birth - Born in state of residence (%) - Asian
Place of birth - Born in state of residence (%) - Hispanic or Latino
Place of birth - Born in state of residence (%) - American Indian and Alaska Native
Place of birth - Born in state of residence (%) - Multirace
Place of birth - Born in state of residence (%) - Other Race
Place of birth - Born in other state (%)
Place of birth - Born in other state (%) - White
Place of birth - Born in other state (%) - Black or African American
Place of birth - Born in other state (%) - Asian
Place of birth - Born in other state (%) - Hispanic or Latino
Place of birth - Born in other state (%) - American Indian and Alaska Native
Place of birth - Born in other state (%) - Multirace
Place of birth - Born in other state (%) - Other Race
Place of birth - Native, outside of US (%)
Place of birth - Native, outside of US (%) - White
Place of birth - Native, outside of US (%) - Black or African American
Place of birth - Native, outside of US (%) - Asian
Place of birth - Native, outside of US (%) - Hispanic or Latino
Place of birth - Native, outside of US (%) - American Indian and Alaska Native
Place of birth - Native, outside of US (%) - Multirace
Place of birth - Native, outside of US (%) - Other Race
Place of birth - Foreign born (%)
Place of birth - Foreign born (%) - White
Place of birth - Foreign born (%) - Black or African American
Place of birth - Foreign born (%) - Asian
Place of birth - Foreign born (%) - Hispanic or Latino
Place of birth - Foreign born (%) - American Indian and Alaska Native
Place of birth - Foreign born (%) - Multirace
Place of birth - Foreign born (%) - Other Race
Residents speaking English at home (%)
Residents speaking English at home - Born in the United States (%)
Residents speaking English at home - Native, born elsewhere (%)
Residents speaking English at home - Foreign born (%)
Residents speaking Spanish at home (%)
Residents speaking Spanish at home - Born in the United States (%)
Residents speaking Spanish at home - Native, born elsewhere (%)
Residents speaking Spanish at home - Foreign born (%)
Residents speaking other language at home (%)
Residents speaking other language at home - Born in the United States (%)
Residents speaking other language at home - Native, born elsewhere (%)
Residents speaking other language at home - Foreign born (%)
Marital status - Never married (%)
Marital status - Now married (%)
Marital status - Separated (%)
Marital status - Widowed (%)
Marital status - Divorced (%)
Ancestries Reported - Arab (%)
Ancestries Reported - Czech (%)
Ancestries Reported - Danish (%)
Ancestries Reported - Dutch (%)
Ancestries Reported - English (%)
Ancestries Reported - French (%)
Ancestries Reported - French Canadian (%)
Ancestries Reported - German (%)
Ancestries Reported - Greek (%)
Ancestries Reported - Hungarian (%)
Ancestries Reported - Irish (%)
Ancestries Reported - Italian (%)
Ancestries Reported - Lithuanian (%)
Ancestries Reported - Norwegian (%)
Ancestries Reported - Polish (%)
Ancestries Reported - Portuguese (%)
Ancestries Reported - Russian (%)
Ancestries Reported - Scotch-Irish (%)
Ancestries Reported - Scottish (%)
Ancestries Reported - Slovak (%)
Ancestries Reported - Subsaharan African (%)
Ancestries Reported - Swedish (%)
Ancestries Reported - Swiss (%)
Ancestries Reported - Ukrainian (%)
Ancestries Reported - United States (%)
Ancestries Reported - Welsh (%)
Ancestries Reported - West Indian (%)
Ancestries Reported - Other (%)
Geographical mobility - Same house 1 year ago (%)
Geographical mobility - Same house 1 year ago (%) - White
Geographical mobility - Same house 1 year ago (%) - Black or African American
Geographical mobility - Same house 1 year ago (%) - Asian
Geographical mobility - Same house 1 year ago (%) - Hispanic or Latino
Geographical mobility - Same house 1 year ago (%) - American Indian and Alaska Native
Geographical mobility - Same house 1 year ago (%) - Multirace
Geographical mobility - Same house 1 year ago (%) - Other Race
Geographical mobility - Moved within same county (%)
Geographical mobility - Moved within same county (%) - White
Geographical mobility - Moved within same county (%) - Black or African American
Geographical mobility - Moved within same county (%) - Asian
Geographical mobility - Moved within same county (%) - Hispanic or Latino
Geographical mobility - Moved within same county (%) - American Indian and Alaska Native
Geographical mobility - Moved within same county (%) - Multirace
Geographical mobility - Moved within same county (%) - Other Race
Geographical mobility - Moved from different county within same state (%)
Geographical mobility - Moved from different county within same state (%) - White
Geographical mobility - Moved from different county within same state (%) - Black or African American
Geographical mobility - Moved from different county within same state (%) - Asian
Geographical mobility - Moved from different county within same state (%) - Hispanic or Latino
Geographical mobility - Moved from different county within same state (%) - American Indian and Alaska Native
Geographical mobility - Moved from different county within same state (%) - Multirace
Geographical mobility - Moved from different county within same state (%) - Other Race
Geographical mobility - Moved from different state (%)
Geographical mobility - Moved from different state (%) - White
Geographical mobility - Moved from different state (%) - Black or African American
Geographical mobility - Moved from different state (%) - Asian
Geographical mobility - Moved from different state (%) - Hispanic or Latino
Geographical mobility - Moved from different state (%) - American Indian and Alaska Native
Geographical mobility - Moved from different state (%) - Multirace
Geographical mobility - Moved from different state (%) - Other Race
Geographical mobility - Moved from abroad (%)
Geographical mobility - Moved from abroad (%) - White
Geographical mobility - Moved from abroad (%) - Black or African American
Geographical mobility - Moved from abroad (%) - Asian
Geographical mobility - Moved from abroad (%) - Hispanic or Latino
Geographical mobility - Moved from abroad (%) - American Indian and Alaska Native
Geographical mobility - Moved from abroad (%) - Multirace
Geographical mobility - Moved from abroad (%) - Other Race
Place of birth for the foreign-born population - Ireland (%)
Place of birth for the foreign-born population - Denmark (%)
Place of birth for the foreign-born population - Norway (%)
Place of birth for the foreign-born population - Sweden (%)
Place of birth for the foreign-born population - United Kingdom (%)
Place of birth for the foreign-born population - England (%)
Place of birth for the foreign-born population - Scotland (%)
Place of birth for the foreign-born population - Other Northern Europe (%)
Place of birth for the foreign-born population - Austria (%)
Place of birth for the foreign-born population - Belgium (%)
Place of birth for the foreign-born population - France (%)
Place of birth for the foreign-born population - Germany (%)
Place of birth for the foreign-born population - Netherlands (%)
Place of birth for the foreign-born population - Switzerland (%)
Place of birth for the foreign-born population - Other Western Europe (%)
Place of birth for the foreign-born population - Greece (%)
Place of birth for the foreign-born population - Italy (%)
Place of birth for the foreign-born population - Portugal (%)
Place of birth for the foreign-born population - Spain (%)
Place of birth for the foreign-born population - Other Southern Europe (%)
Place of birth for the foreign-born population - Albania (%)
Place of birth for the foreign-born population - Belarus (%)
Place of birth for the foreign-born population - Bosnia and Herzegovina (%)
Place of birth for the foreign-born population - Bulgaria (%)
Place of birth for the foreign-born population - Croatia (%)
Place of birth for the foreign-born population - Czechoslovakia (%)
Place of birth for the foreign-born population - Hungary (%)
Place of birth for the foreign-born population - Latvia (%)
Place of birth for the foreign-born population - Lithuania (%)
Place of birth for the foreign-born population - North Macedonia (Macedonia) (%)
Place of birth for the foreign-born population - Moldova (%)
Place of birth for the foreign-born population - Poland (%)
Place of birth for the foreign-born population - Romania (%)
Place of birth for the foreign-born population - Russia (%)
Place of birth for the foreign-born population - Serbia (%)
Place of birth for the foreign-born population - Ukraine (%)
Place of birth for the foreign-born population - Other Eastern Europe (%)
Place of birth for the foreign-born population - China (%)
Place of birth for the foreign-born population - Hong Kong (%)
Place of birth for the foreign-born population - Taiwan (%)
Place of birth for the foreign-born population - Japan (%)
Place of birth for the foreign-born population - Korea (%)
Place of birth for the foreign-born population - Other Eastern Asia (%)
Place of birth for the foreign-born population - Afghanistan (%)
Place of birth for the foreign-born population - Bangladesh (%)
Place of birth for the foreign-born population - India (%)
Place of birth for the foreign-born population - Iran (%)
Place of birth for the foreign-born population - Kazakhstan (%)
Place of birth for the foreign-born population - Nepal (%)
Place of birth for the foreign-born population - Pakistan (%)
Place of birth for the foreign-born population - Sri Lanka (%)
Place of birth for the foreign-born population - Uzbekistan (%)
Place of birth for the foreign-born population - Other South Central Asia (%)
Place of birth for the foreign-born population - Burma (%)
Place of birth for the foreign-born population - Cambodia (%)
Place of birth for the foreign-born population - Indonesia (%)
Place of birth for the foreign-born population - Laos (%)
Place of birth for the foreign-born population - Malaysia (%)
Place of birth for the foreign-born population - Philippines (%)
Place of birth for the foreign-born population - Singapore (%)
Place of birth for the foreign-born population - Thailand (%)
Place of birth for the foreign-born population - Vietnam (%)
Place of birth for the foreign-born population - Other South Eastern Asia (%)
Place of birth for the foreign-born population - Armenia (%)
Place of birth for the foreign-born population - Iraq (%)
Place of birth for the foreign-born population - Israel (%)
Place of birth for the foreign-born population - Jordan (%)
Place of birth for the foreign-born population - Kuwait (%)
Place of birth for the foreign-born population - Lebanon (%)
Place of birth for the foreign-born population - Saudi Arabia (%)
Place of birth for the foreign-born population - Syria (%)
Place of birth for the foreign-born population - Turkey (%)
Place of birth for the foreign-born population - Yemen (%)
Place of birth for the foreign-born population - Other Western Asia (%)
Place of birth for the foreign-born population - Eritrea (%)
Place of birth for the foreign-born population - Ethiopia (%)
Place of birth for the foreign-born population - Kenya (%)
Place of birth for the foreign-born population - Somalia (%)
Place of birth for the foreign-born population - Uganda (%)
Place of birth for the foreign-born population - Zimbabwe (%)
Place of birth for the foreign-born population - Other Eastern Africa (%)
Place of birth for the foreign-born population - Cameroon (%)
Place of birth for the foreign-born population - Congo (%)
Place of birth for the foreign-born population - Democratic Republic of Congo (Zaire) (%)
Place of birth for the foreign-born population - Other Middle Africa (%)
Place of birth for the foreign-born population - Egypt (%)
Place of birth for the foreign-born population - Morocco (%)
Place of birth for the foreign-born population - Sudan (%)
Place of birth for the foreign-born population - Other Northern Africa (%)
Place of birth for the foreign-born population - South Africa (%)
Place of birth for the foreign-born population - Other Southern Africa (%)
Place of birth for the foreign-born population - Cabo Verde (%)
Place of birth for the foreign-born population - Ghana (%)
Place of birth for the foreign-born population - Liberia (%)
Place of birth for the foreign-born population - Nigeria (%)
Place of birth for the foreign-born population - Senegal (%)
Place of birth for the foreign-born population - Sierra Leone (%)
Place of birth for the foreign-born population - Other Western Africa (%)
Place of birth for the foreign-born population - Australia (%)
Place of birth for the foreign-born population - New Zealand (%)
Place of birth for the foreign-born population - Fiji (%)
Place of birth for the foreign-born population - Micronesia (%)
Place of birth for the foreign-born population - Bahamas (%)
Place of birth for the foreign-born population - Barbados (%)
Place of birth for the foreign-born population - Cuba (%)
Place of birth for the foreign-born population - Dominica (%)
Place of birth for the foreign-born population - Dominican Republic (%)
Place of birth for the foreign-born population - Grenada (%)
Place of birth for the foreign-born population - Haiti (%)
Place of birth for the foreign-born population - Jamaica (%)
Place of birth for the foreign-born population - St. Vincent and the Grenadines (%)
Place of birth for the foreign-born population - Trinidad and Tobago (%)
Place of birth for the foreign-born population - West Indies (%)
Place of birth for the foreign-born population - Other Caribbean (%)
Place of birth for the foreign-born population - Belize (%)
Place of birth for the foreign-born population - Costa Rica (%)
Place of birth for the foreign-born population - El Salvador (%)
Place of birth for the foreign-born population - Guatemala (%)
Place of birth for the foreign-born population - Honduras (%)
Place of birth for the foreign-born population - Mexico (%)
Place of birth for the foreign-born population - Nicaragua (%)
Place of birth for the foreign-born population - Panama (%)
Place of birth for the foreign-born population - Other Central America (%)
Place of birth for the foreign-born population - Argentina (%)
Place of birth for the foreign-born population - Bolivia (%)
Place of birth for the foreign-born population - Brazil (%)
Place of birth for the foreign-born population - Chile (%)
Place of birth for the foreign-born population - Colombia (%)
Place of birth for the foreign-born population - Ecuador (%)
Place of birth for the foreign-born population - Guyana (%)
Place of birth for the foreign-born population - Peru (%)
Place of birth for the foreign-born population - Uruguay (%)
Place of birth for the foreign-born population - Venezuela (%)
Place of birth for the foreign-born population - Other South America (%)
Place of birth for the foreign-born population - Canada (%)
Place of birth for the foreign-born population - Other Northern America (%)
Place of birth for the foreign-born population - Other (%)
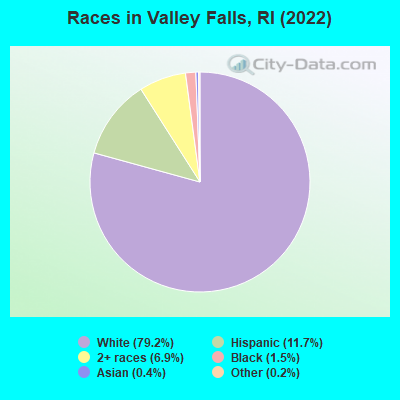
According to 2022 data, the most numerous races in Valley Falls, RI are White alone (9,546 residents), Hispanic (1,405 residents), and Two or more races (838 residents). 74.8% of Valley Falls residents speak English at home. 15.4% of Valley Falls, RI residents are foreign-born (7.6% born in Europe, 6.0% born in Latin America), which is 9.3% greater than the foreign-born rate of 14.0% across the entire state of Rhode Island.
Race distribution in Valley Falls
2000 2022
858,433 81.9% White alone 90,820 8.7% Hispanic 41,922 4.0% Black alone 23,416 2.2% Asian alone 20,816 2.0% Two or more races 8,411 0.8% Other race alone 4,181 0.4% American Indian alone 320 0.03% Native Hawaiian and Other
745,825 68.2% White alone 191,979 17.6% Hispanic 56,738 5.2% Two or more races 51,326 4.7% Black alone 37,234 3.4% Asian alone 9,514 0.9% Other race alone 978 0.09% American Indian alone 140 0.01% Native Hawaiian and Other
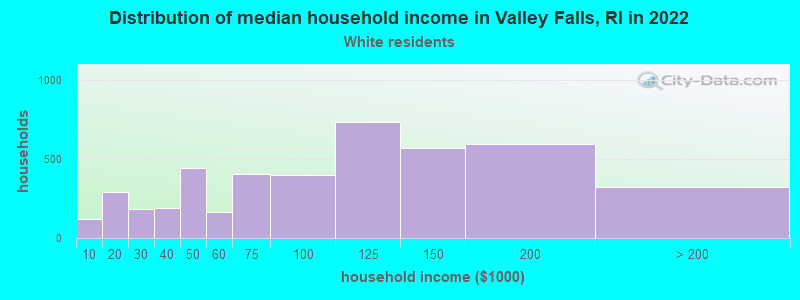
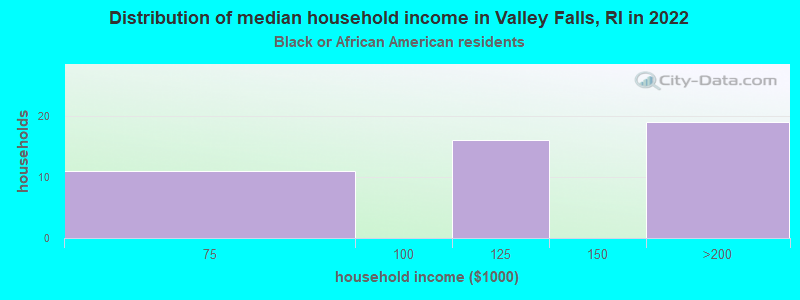
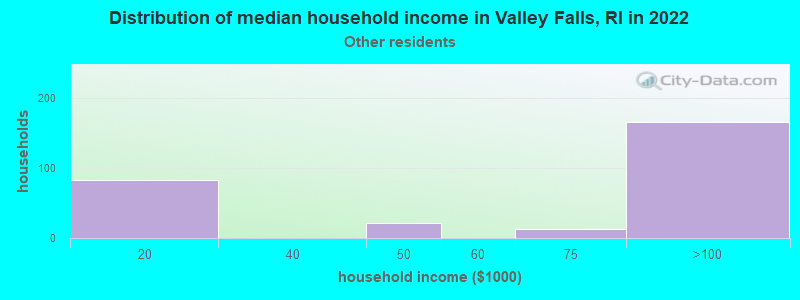
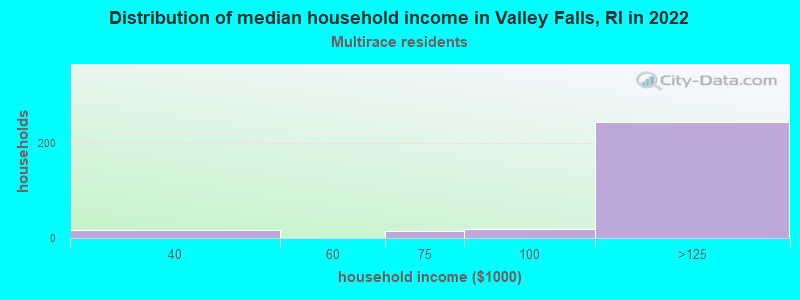
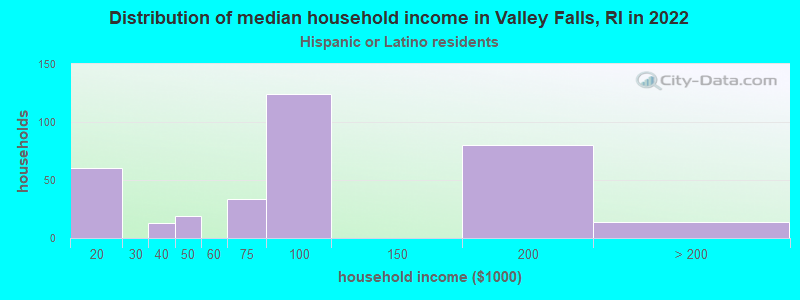
Income and house value in Valley Falls Median household income in 2022 $93,767 White non-Hispanic householders$137,048 Black householders$90,527 Some other race householders$119,012 Two or more races householders$94,355 Hispanic or Latino race householdersMedian 2022 house value $376,912 White Non-Hispanic householders$796,702 Some other race householders$386,183 Two or more races householders$325,923 Hispanic or Latino householders
Median age by race in Valley Falls
51.0 Median age for White residents50.7 50.8 12.1 Median age for Black or African American residents12.7 1.7 -628,930,817.0 Median age for American Indian / Alaska Native residents-743,837,083.9 -606,811,144.9 4.1 Median age for Asian residents-713,131,312.4 29.1 -713,991,768.8 Median age for Native Hawaiian / Pacific Islander residents-668,724,279.2 -670,599,802.7 37.1 Median age for Other race residents36.9 39.4 27.4 Median age for Two or more races residents49.5 25.7 50.3 Median age for White alone residents49.7 50.9 28.2 Median age for Hispanic or Latino residents35.7 27.9
Owner/renter occupied households by race in Valley Falls
House owners and renters - White residents 3,347 75.0% Owner occupied1,117 25.0% Renter occupiedHouse owners and renters - Black or African American residents 32 100.0% Owner occupiedHouse owners and renters - Asian residents 7 100.0% Owner occupiedHouse owners and renters - Other race residents 53 20.3% Owner occupied210 79.7% Renter occupiedHouse owners and renters - Two or more races residents 58 20.7% Owner occupied220 79.3% Renter occupiedHouse owners and renters - White alone residents 3,396 74.0% Owner occupied1,195 26.0% Renter occupiedHouse owners and renters - Hispanic or Latino residents 118 36.1% Owner occupied209 63.9% Renter occupied
Language usage in Valley Falls
English speakers - Total 74.8% of residents of Valley Falls speak English at home.
9.5% of residents speak Spanish at home 347 31.9% Speak English very well742 68.1% Speak English less than very well16.1% of residents speak other language at home 1,088 59.4% Speak English very well745 40.6% Speak English less than very well
English speakers - Born in the United States 90.0% of residents of Valley Falls speak English at home.
4.9% of residents speak Spanish at home 127 83.6% Speak English very well25 16.4% Speak English less than very well5.1% of residents speak other language at home 134 84.8% Speak English very well24 15.2% Speak English less than very well
English speakers - Native, born elsewhere 4.2% of residents of Valley Falls speak English at home.
63.3% of residents speak Spanish at home 113 57.4% Speak English very well84 42.6% Speak English less than very well46.9% of residents speak other language at home 115 78.8% Speak English very well31 21.2% Speak English less than very well
English speakers - Foreign-born 4.4% of residents of Valley Falls speak English at home.
27.9% of residents speak Spanish at home 41 8.0% Speak English very well469 92.0% Speak English less than very well68.0% of residents speak other language at home 541 43.5% Speak English very well702 56.5% Speak English less than very well
White (Caucasian) - Speak only English Native:
94.1% (7,737)Foreign-born:
5.3% (37)
White (Caucasian) - Speak another language Native:
6.1% (503)Foreign-born:
96.4% (672)
Black or African American - Speak only English Native:
49.5% (53)Foreign-born:
26.8% (10)
Black or African American - Speak another language Native:
50.9% (55)Foreign-born:
67.1% (26)
Asian - Speak only English Native:
100.0% (1)Foreign-born:
26.2% (6)
Other race - Speak another language Native:
83.2% (386)Foreign-born:
97.7% (439)
Two or more races - Speak another language Native:
0.3% (1)Foreign-born:
97.2% (435)
White alone - Speak only English Native:
93.2% (7,642)Foreign-born:
5.1% (41)
White alone - Speak another language Native:
6.7% (548)Foreign-born:
99.2% (810)
Hispanic or Latino - Speak another language Native:
64.0% (537)Foreign-born:
99.7% (448)
Foreign-born residents in Valley Falls 1,861 residents are foreign born (7.6% Europe , 6.0% Latin America ).
This city:
15.4%Rhode Island:
14.4%
Marital status for residents in Valley Falls Marital status - White (Caucasian) population 15 years and over
Males 28.0% Never married53.8% Now married0.6% Separated4.3% Widowed13.3% DivorcedFemales 31.4% Never married48.5% Now married0.5% Separated10.9% Widowed8.7% DivorcedWomen who gave birth in the past 12 months Now married:
88.5% (62)Unmarried:
11.5% (8)
Women who did not give birth in the past 12 months Now married:
38.0% (712)Unmarried:
62.0% (1,159)
Marital status - Black or African American population 15 years and over
Males 58.3% Never married23.3% Now married0.0% Separated0.0% Widowed18.3% DivorcedFemales 72.7% Never married27.3% Now married0.0% Separated0.0% Widowed0.0% DivorcedWomen who gave birth in the past 12 months Now married:
0.0% (0)Unmarried:
99.3% (1)
Women who did not give birth in the past 12 months Now married:
27.9% (12)Unmarried:
72.1% (31)
Marital status - Asian population 15 years and over
Males 100.0% Never married0.0% Now married0.0% Separated0.0% Widowed0.0% DivorcedFemales 50.0% Never married50.0% Now married0.0% Separated0.0% Widowed0.0% DivorcedWomen who did not give birth in the past 12 months Now married:
50.0% (10)Unmarried:
50.0% (10)
Marital status - Other race population 15 years and over
Males 17.2% Never married70.1% Now married0.0% Separated0.0% Widowed12.8% DivorcedFemales 32.8% Never married50.8% Now married16.4% Separated0.0% Widowed0.0% DivorcedWomen who did not give birth in the past 12 months Now married:
63.8% (248)Unmarried:
36.2% (141)
Marital status - Two or more races population 15 years and over
Males 20.8% Never married73.8% Now married0.0% Separated5.4% Widowed0.0% DivorcedFemales 59.7% Never married39.4% Now married0.0% Separated0.0% Widowed1.0% DivorcedWomen who did not give birth in the past 12 months Now married:
37.9% (205)Unmarried:
62.1% (337)
Marital status - White alone, not Hispanic / Latino population 15 years and over
Males 28.5% Never married53.3% Now married0.6% Separated4.4% Widowed13.2% DivorcedFemales 28.7% Never married50.5% Now married0.5% Separated11.3% Widowed9.1% DivorcedWomen who gave birth in the past 12 months Now married:
88.5% (67)Unmarried:
11.5% (9)
Women who did not give birth in the past 12 months Now married:
41.7% (775)Unmarried:
58.3% (1,085)
Marital status - Hispanic or Latino population 15 years and over
Males 15.1% Never married70.5% Now married0.0% Separated0.0% Widowed14.4% DivorcedFemales 53.3% Never married35.3% Now married10.7% Separated0.0% Widowed0.7% DivorcedWomen who did not give birth in the past 12 months Now married:
42.8% (235)Unmarried:
57.2% (314)
Ancestries in Valley Falls
1,657 25.1% Portuguese694 10.5% French627 9.5% French Canadian599 9.1% Irish379 5.7% Italian339 5.1% American290 4.4% English158 2.4% Polish154 2.3% Brazilian123 1.9% German77 1.2% Swedish60 0.9% Assyrian56 0.8% European52 0.8% Canadian27 0.4% Russian23 0.3% African13 0.2% Lebanese12 0.2% Nigerian9 0.1% Norwegian4 0.06% Austrian1 0.02% Trinidadian and Tobagonian
Children Nativity (place of birth) in Valley Falls
Children under 6 years - Living with two parents Both parents native 312 100.0% NativeOne native, one foreign-born parent 32 100.0% NativeChildren under 6 years - Living with one parent Native parent 147 100.0% NativeForeign-born parent 82 73.6% Native29 26.4% Foreign-bornChildren 6 to 17 years - Living with two parents Both parents native 420 100.0% NativeBoth parents foreign-born 94 100.0% NativeOne native, one foreign-born parent 310 100.0% NativeChildren 6 to 17 years - Living with one parent Native parent 346 100.0% NativeForeign-born parent 187 51.0% Native180 49.0% Foreign-born
Grandparents responsible for own grandchildren in Valley Falls
Grandparents (30 to 59 years) White / Caucasian 6 47.3% Responsible for grandchildren7 52.7% Not responsible for grandchildrenWhite alone, not Hispanic / Latino 10 54.5% Responsible for grandchildren8 45.5% Not responsible for grandchildrenGrandparents (60 years and over) White / Caucasian 8 19.1% Responsible for grandchildren33 80.9% Not responsible for grandchildrenWhite alone, not Hispanic / Latino 9 20.2% Responsible for grandchildren35 79.8% Not responsible for grandchildren