Twin Falls, ID (Idaho) Houses and Residents
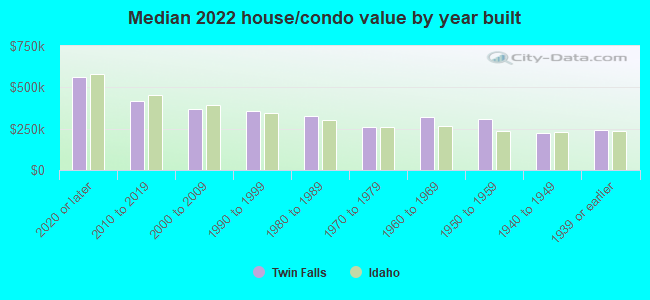
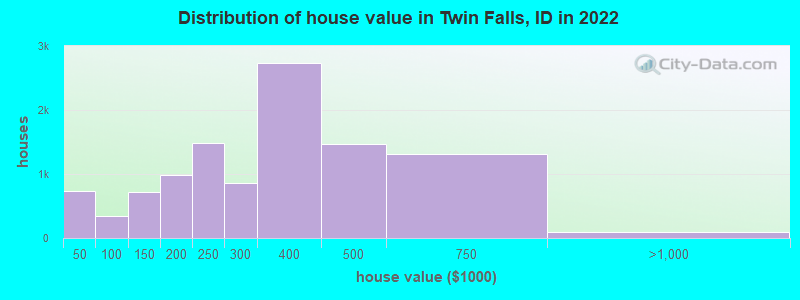
Estimated median house or condo value in 2022: $316,568 (it was $90,800 in 2000 )
Twin Falls:
$316,568Idaho:
$432,500
Lower value quartile - upper value quartile: $249,159 - $414,205Total population: 46,528 (Urban population: 34,024 (all inside urban clusters), Rural population: 140 (10 farm, 130 nonfarm ))
Houses: 21,718 (20,871 occupied: 13,201 owner occupied, 7,763 renter occupied )
% of renters here:
37%State:
28%
Housing density: 1,808 houses/condos per square mile
Median price asked for vacant for-sale houses and condos in 2022: $434,127.
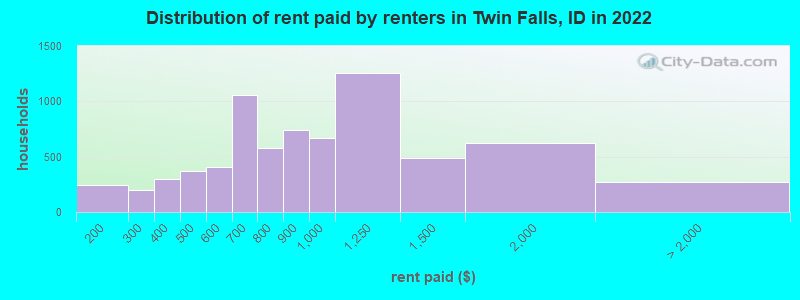
Median contract rent in 2022: $916 (lower quartile is $658, upper quartile is $1,153)
Median rent asked for vacant for-rent units in 2022: $1,640
Median gross rent in Twin Falls, ID in 2022: $1,054
Housing units in Twin Falls with a mortgage: 8,966 (1,021 second mortgage, 29 home equity loan, 645 both second mortgage and home equity loan )Houses without a mortgage: 31
Median household income for houses/condos with a mortgage: $83,946
Median household income for apartments without a mortgage: $55,584
Median monthly housing costs: $1,080
Data:
Median house or condo value ($)
Median house or condo value ($ change since 2000)
Median house or condo value ($) - White
Median house or condo value ($) - Black or African American
Median house or condo value ($) - Asian
Median house or condo value ($) - Hispanic or Latino
Median house or condo value ($) - American Indian and Alaska Native
Median house or condo value ($) - Multirace
Median house or condo value ($) - Other Race
Median price asked for mobile homes ($)
Household density (households per square mile)
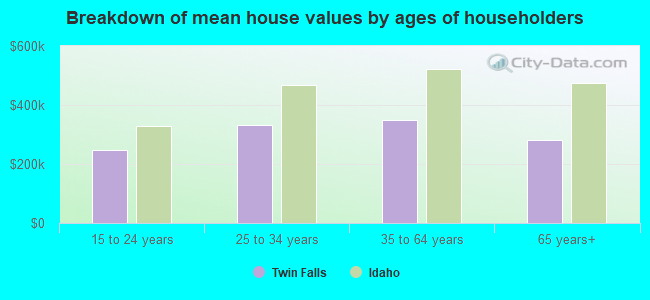
Mean house or condo value by units in structure - 1, detached ($)
Mean house or condo value by units in structure - 1, attached ($)
Mean house or condo value by units in structure - 2 ($)
Mean house or condo value by units in structure by units in structure - 3 or 4 ($)
Mean house or condo value by units in structure - 5 or more ($)
Mean house or condo value by units in structure - Boat, RV, van, etc. ($)
Mean house or condo value by units in structure - Mobile home ($)
Median contract rent ($)
Median contract rent - Lower quartile ($)
Median contract rent - Upper quartile ($)
Median gross rent ($)
Urban houses (%)
Rural houses (%)
Houses occupied (%)
Houses occupied (% change since 2000)
Houses owner occupied (%)
Houses owner occupied (% change since 2000)
Houses renter occupied (%)
Houses renter occupied (% change since 2000)
Vacant housing units - For rent (%)
Vacant housing units - For rent (% change since 2000)
Vacant housing units - For sale only (%)
Vacant housing units - For sale only (% change since 2000)
Vacant housing units - Rented or sold, not occupied (%)
Vacant housing units - Rented or sold, not occupied (% change since 2000)
Vacant housing units - For seasonal, recreational, or occasional use (%)
Vacant housing units - For seasonal, recreational, or occasional use (% change since 2000)
Vacant housing units - For migrant workers (%)
Vacant housing units - For migrant workers (% change since 2000)
Vacant housing units - Other vacant (%)
Vacant housing units - Other vacant (% change since 2000)
Median monthly housing costs ($)
Median household income for houses/condos with a mortgage ($)
Median household income for houses/condos without a mortgage ($)
Median household income ($)
Median household income ($) - White
Median household income ($) - Black or African American
Median household income ($) - Asian
Median household income ($) - Hispanic or Latino
Median household income ($) - American Indian and Alaska Native
Median household income ($) - Multirace
Median household income ($) - Other Race
Mortgage status - with mortgage (%)
Mortgage status - with second mortgage (%)
Mortgage status - with home equity loan (%)
Mortgage status - with both second mortgage and home equity loan (%)
Mortgage status - without a mortgage (%)
Median year house/condo built
Median year apartment built
Household type by relationship - Male householder living alone (%)
Household type by relationship - Male householder not living alone (%)
Household type by relationship - Female householder living alone (%)
Household type by relationship - Female householder not living alone (%)
Household type by relationship - Opposite-Sex spouse (%)
Household type by relationship - Same-Sex spouse (%)
Household type by relationship - Opposite-Sex unmarried partner (%)
Household type by relationship - Same-Sex unmarried partner (%)
Household type by relationship - In group quarters (%)
Size of family households - 2-person household (%)
Size of family households - 3-person household (%)
Size of family households - 4-person household (%)
Size of family households - 5-person household (%)
Size of family households - 6-person household (%)
Size of family households - 7-or-more-person household (%)
Size of nonfamily households - 1-person household (%)
Size of nonfamily households - 2-person household (%)
Size of nonfamily households - 3-person household (%)
Size of nonfamily households - 4-person household (%)
Size of nonfamily households - 5-person household (%)
Size of nonfamily households - 6-person household (%)
Size of nonfamily households - 7-or-moreperson household (%)
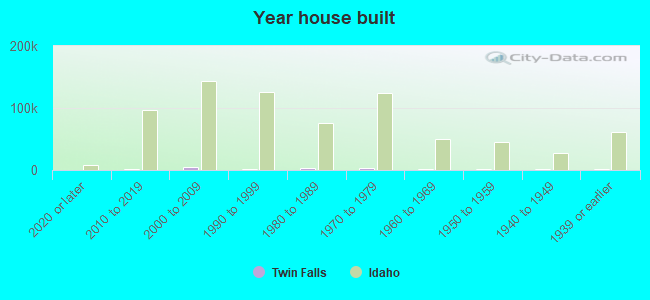
Year house built - Built 2010 or later (%)
Year house built - Built 2000 to 2009 (%)
Year house built - Built 1990 to 1999 (%)
Year house built - Built 1980 to 1989 (%)
Year house built - Built 1970 to 1979 (%)
Year house built - Built 1960 to 1969 (%)
Year house built - Built 1950 to 1959 (%)
Year house built - Built 1940 to 1949 (%)
Year house built - Built 1939 or earlier (%)
Median number of rooms in houses and condos
Median number of rooms in apartments
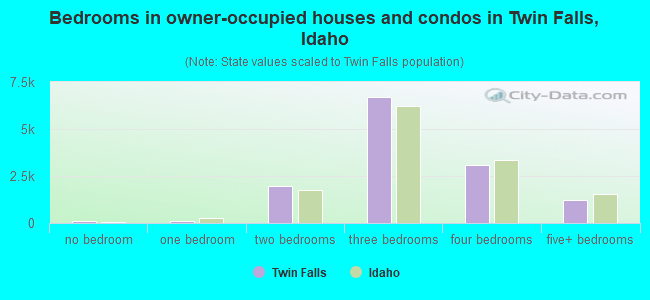
Median number of bedrooms in owner occupied houses
Mean number of bedrooms in owner occupied houses
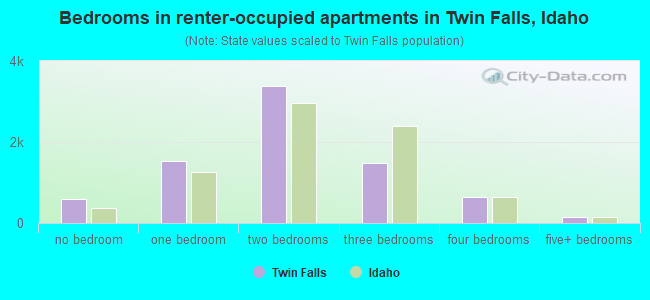
Median number of bedrooms in renter occupied houses
Mean number of bedrooms in renter occupied houses
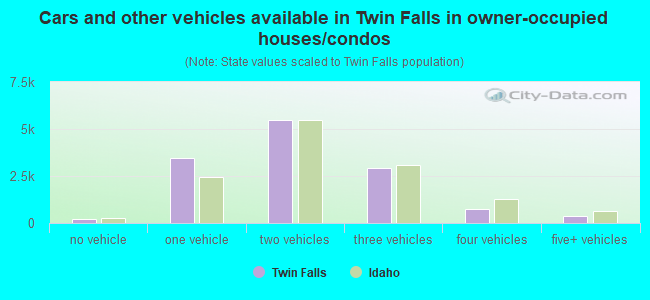
Median number of vehichles in owner occupied houses
Mean number of vehichles in owner occupied houses
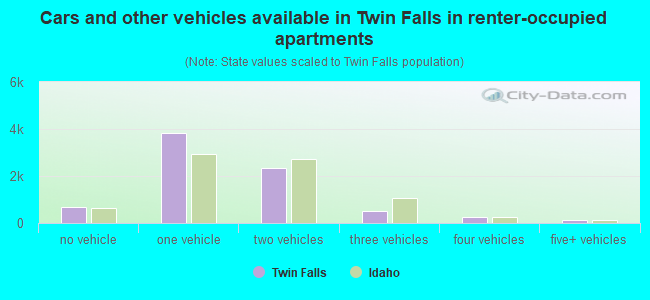
Median number of vehichles in renter occupied houses
Mean number of vehichles in renter occupied houses
Rooms in owner-occupied houses - 1 room (%)
Rooms in owner-occupied houses - 2 rooms (%)
Rooms in owner-occupied houses - 3 rooms (%)
Rooms in owner-occupied houses - 4 rooms (%)
Rooms in owner-occupied houses - 5 rooms (%)
Rooms in owner-occupied houses - 6 rooms (%)
Rooms in owner-occupied houses - 7 rooms (%)
Rooms in owner-occupied houses - 8 rooms (%)
Rooms in owner-occupied houses - 9+ rooms (%)
Rooms in renter-occupied houses - 1 room (%)
Rooms in renter-occupied houses - 2 rooms (%)
Rooms in renter-occupied houses - 3 rooms (%)
Rooms in renter-occupied houses - 4 rooms (%)
Rooms in renter-occupied houses - 5 rooms (%)
Rooms in renter-occupied houses - 6 rooms (%)
Rooms in renter-occupied houses - 7 rooms (%)
Rooms in renter-occupied houses - 8 rooms (%)
Rooms in renter-occupied houses - 9+ rooms (%)
Bedrooms in owner-occupied houses - no bedrooms (%)
Bedrooms in owner-occupied houses - 1 bedroom (%)
Bedrooms in owner-occupied houses - 2 bedrooms (%)
Bedrooms in owner-occupied houses - 3 bedrooms (%)
Bedrooms in owner-occupied houses - 4 bedrooms (%)
Bedrooms in owner-occupied houses - 5+ bedrooms (%)
Bedrooms in renter-occupied houses - no bedrooms (%)
Bedrooms in renter-occupied houses - 1 bedroom (%)
Bedrooms in renter-occupied houses - 2 bedrooms (%)
Bedrooms in renter-occupied houses - 3 bedrooms (%)
Bedrooms in renter-occupied houses - 4 bedrooms (%)
Bedrooms in renter-occupied houses - 5+ bedrooms (%)
Vehicles available in owner-occupied houses - no vehicle available (%)
Vehicles available in owner-occupied houses - 1 vehicle available(%)
Vehicles available in owner-occupied houses - 2 Vehicles available (%)
Vehicles available in owner-occupied houses - 3 Vehicles available (%)
Vehicles available in owner-occupied houses - 4 Vehicles available (%)
Vehicles available in owner-occupied houses - 5+ Vehicles available (%)
Vehicles available in renter-occupied houses - no vehicle available (%)
Vehicles available in renter-occupied houses - 1 vehicle available (%)
Vehicles available in renter-occupied houses - 2 Vehicles available (%)
Vehicles available in renter-occupied houses - 3 Vehicles available (%)
Vehicles available in renter-occupied houses - 4 Vehicles available (%)
Vehicles available in renter-occupied houses - 5+ Vehicles available (%)
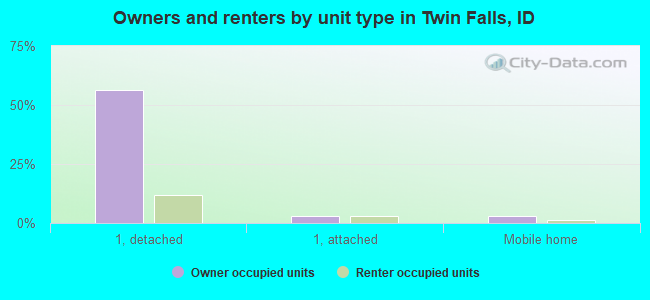
Housing units in structures - 1, detached (%)
Housing units in structures - 1, attached (%)
Housing units in structures - 2 (%)
Housing units in structures - 3 or 4 (%)
Housing units in structures - 5 to 9 (%)
Housing units in structures - 10 to 19 (%)
Housing units in structures - 20 to 49 (%)
Housing units in structures - 50 or more (%)
Housing units in structures - Mobile home (%)
Housing units in structures - Boat, RV, van, etc. (%)
Housing units in structures - Owners - 1, detached (%)
Housing units in structures - Owners - 1, attached (%)
Housing units in structures - Owners - 2 (%)
Housing units in structures - Owners - 3 or 4 (%)
Housing units in structures - Owners - 5 to 9 (%)
Housing units in structures - Owners - 10 to 19 (%)
Housing units in structures - Owners - 20 to 49 (%)
Housing units in structures - Owners - 50 or more (%)
Housing units in structures - Owners - Mobile home (%)
Housing units in structures - Owners - Boat, RV, van, etc. (%)
Housing units in structures - Renters - 1, detached (%)
Housing units in structures - Renters - 1, attached (%)
Housing units in structures - Renters - 2 (%)
Housing units in structures - Renters - 3 or 4 (%)
Housing units in structures - Renters - 5 to 9 (%)
Housing units in structures - Renters - 10 to 19 (%)
Housing units in structures - Renters - 20 to 49 (%)
Housing units in structures - Renters - 50 or more (%)
Housing units in structures - Renters - Mobile home (%)
Housing units in structures - Renters - Boat, RV, van, etc. (%)
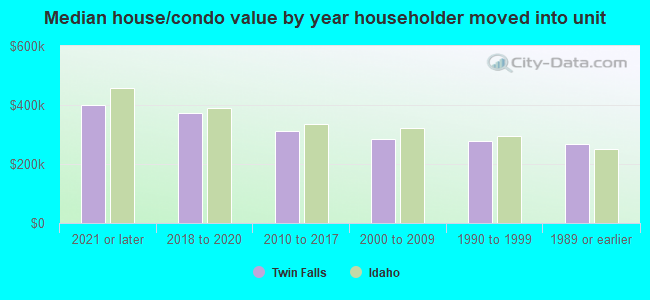
House/condo owner moved in on average (years ago)
Renter moved in on average (years ago)
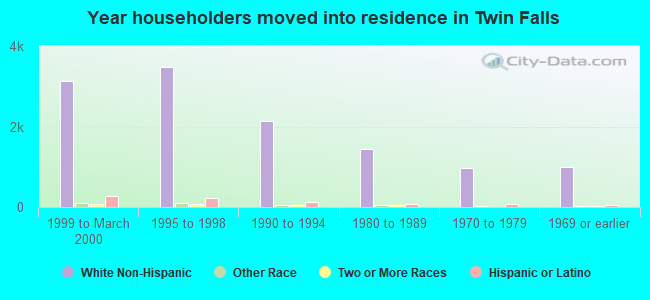
Year householder moved into unit - Moved in 1999 to March 2000 (%)
Year householder moved into unit - Moved in 1999 to March 2000 (%) - White
Year householder moved into unit - Moved in 1999 to March 2000 (%) - Black or African American
Year householder moved into unit - Moved in 1999 to March 2000 (%) - Asian
Year householder moved into unit - Moved in 1999 to March 2000 (%) - Hispanic or Latino
Year householder moved into unit - Moved in 1999 to March 2000 (%) - American Indian and Alaska Native
Year householder moved into unit - Moved in 1999 to March 2000 (%) - Multirace
Year householder moved into unit - Moved in 1999 to March 2000 (%) - Other Race
Year householder moved into unit - Moved in 1995 to 1998 (%)
Year householder moved into unit - Moved in 1995 to 1998 (%) - White
Year householder moved into unit - Moved in 1995 to 1998 (%) - Black or African American
Year householder moved into unit - Moved in 1995 to 1998 (%) - Asian
Year householder moved into unit - Moved in 1995 to 1998 (%) - Hispanic or Latino
Year householder moved into unit - Moved in 1995 to 1998 (%) - American Indian and Alaska Native
Year householder moved into unit - Moved in 1995 to 1998 (%) - Multirace
Year householder moved into unit - Moved in 1995 to 1998 (%) - Other Race
Year householder moved into unit - Moved in 1990 to 1994 (%)
Year householder moved into unit - Moved in 1990 to 1994 (%) - White
Year householder moved into unit - Moved in 1990 to 1994 (%) - Black or African American
Year householder moved into unit - Moved in 1990 to 1994 (%) - Asian
Year householder moved into unit - Moved in 1990 to 1994 (%) - Hispanic or Latino
Year householder moved into unit - Moved in 1990 to 1994 (%) - American Indian and Alaska Native
Year householder moved into unit - Moved in 1990 to 1994 (%) - Multirace
Year householder moved into unit - Moved in 1990 to 1994 (%) - Other Race
Year householder moved into unit - Moved in 1980 to 1989 (%)
Year householder moved into unit - Moved in 1980 to 1989 (%) - White
Year householder moved into unit - Moved in 1980 to 1989 (%) - Black or African American
Year householder moved into unit - Moved in 1980 to 1989 (%) - Asian
Year householder moved into unit - Moved in 1980 to 1989 (%) - Hispanic or Latino
Year householder moved into unit - Moved in 1980 to 1989 (%) - American Indian and Alaska Native
Year householder moved into unit - Moved in 1980 to 1989 (%) - Multirace
Year householder moved into unit - Moved in 1980 to 1989 (%) - Other Race
Year householder moved into unit - Moved in 1970 to 1979 (%)
Year householder moved into unit - Moved in 1970 to 1979 (%) - White
Year householder moved into unit - Moved in 1970 to 1979 (%) - Black or African American
Year householder moved into unit - Moved in 1970 to 1979 (%) - Asian
Year householder moved into unit - Moved in 1970 to 1979 (%) - Hispanic or Latino
Year householder moved into unit - Moved in 1970 to 1979 (%) - American Indian and Alaska Native
Year householder moved into unit - Moved in 1970 to 1979 (%) - Multirace
Year householder moved into unit - Moved in 1970 to 1979 (%) - Other Race
Year householder moved into unit - Moved in 1969 or earlier (%)
Year householder moved into unit - Moved in 1969 or earlier (%) - White
Year householder moved into unit - Moved in 1969 or earlier (%) - Black or African American
Year householder moved into unit - Moved in 1969 or earlier (%) - Asian
Year householder moved into unit - Moved in 1969 or earlier (%) - Hispanic or Latino
Year householder moved into unit - Moved in 1969 or earlier (%) - American Indian and Alaska Native
Year householder moved into unit - Moved in 1969 or earlier (%) - Multirace
Year householder moved into unit - Moved in 1969 or earlier (%) - Other Race
Housing units lacking complete plumbing facilities (%)
Housing units lacking complete kitchen facilities (%)
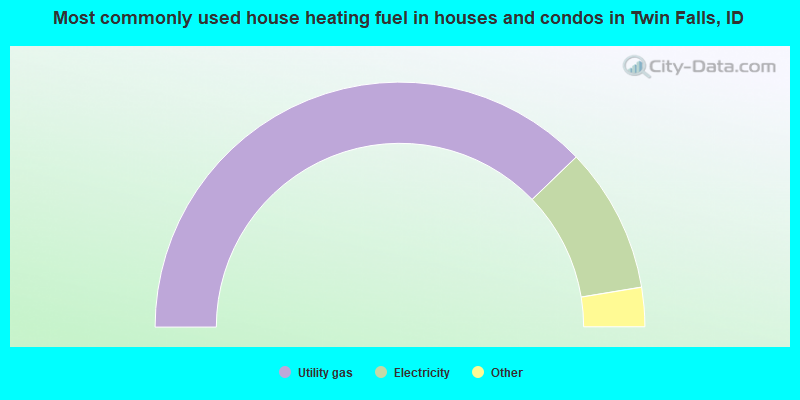
House heating fuel used in houses and condos - Utility gas (%)
House heating fuel used in houses and condos - Bottled, tank, or LP gas (%)
House heating fuel used in houses and condos - Electricity (%)
House heating fuel used in houses and condos - Fuel oil, kerosene, etc. (%)
House heating fuel used in houses and condos - Coal or coke (%)
House heating fuel used in houses and condos - Wood (%)
House heating fuel used in houses and condos - Solar energy (%)
House heating fuel used in houses and condos - Other fuel (%)
House heating fuel used in houses and condos - No fuel used (%)
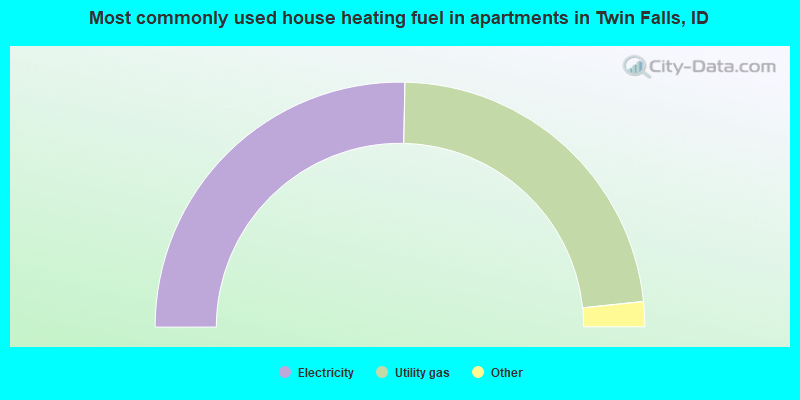
House heating fuel used in apartments - Utility gas (%)
House heating fuel used in apartments - Bottled, tank, or LP gas (%)
House heating fuel used in apartments - Electricity (%)
House heating fuel used in apartments - Fuel oil, kerosene, etc. (%)
House heating fuel used in apartments - Coal or coke (%)
House heating fuel used in apartments - Wood (%)
House heating fuel used in apartments - Solar energy (%)
House heating fuel used in apartments - Other fuel (%)
House heating fuel used in apartments - No fuel used (%)
Median year house/condo built: 1978Median year apartment built: 1979Household type by relationship:
Households: 54,107
Male householders: 10,351 (2,843 living alone ), Female householders: 10,226 (3,278 living alone )10,284 spouses (10,173 opposite-sex spouses ), 1,705 unmarried partners , (1,677 opposite-sex unmarried partners ), 15,929 children (14,431 natural , 372 adopted , 1,126 stepchildren ), 501 grandchildren , 588 brothers or sisters , 770 parents , 0 foster children , 825 other relatives , 1,522 non-relatives In group quarters: 1,400
Size of family households: 6,192 2-persons , 2,860 3-persons , 2,595 4-persons , 1,209 5-persons , 871 6-persons , 527 7-or-more-persons .
Size of nonfamily households: 5,533 1-person , 612 2-persons , 134 3-persons , 154 4-persons .
9,961 married couples with children. single-parent households (447 men , 2,806 women ).
86.0% of residents of Twin Falls speak English at home. of residents speak Spanish at home (70% speak English very well , 15% speak English well , 9% speak English not well , 6% don't speak English at all ).of residents speak other Indo-European language at home (60% speak English very well , 27% speak English well , 2% speak English not well , 12% don't speak English at all ).of residents speak Asian or Pacific Island language at home (59% speak English very well , 13% speak English well , 29% speak English not well ).of residents speak other language at home (23% speak English very well , 40% speak English well , 31% speak English not well , 7% don't speak English at all ).
Foreign born population: 3,662 (6.8%)of them are naturalized citizens )
Median number of rooms in houses and condos:
Median number of rooms in apartments
Owner-occupied Renter-occupied
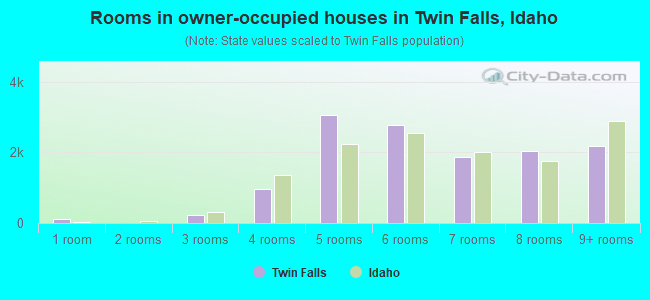
Rooms in owner-occupied houses in Twin Falls, Idaho
101 1 room 0 2 rooms 220 3 rooms 951 4 rooms 3,056 5 rooms 2,764 6 rooms 1,871 7 rooms 2,049 8 rooms 2,188 9+ rooms
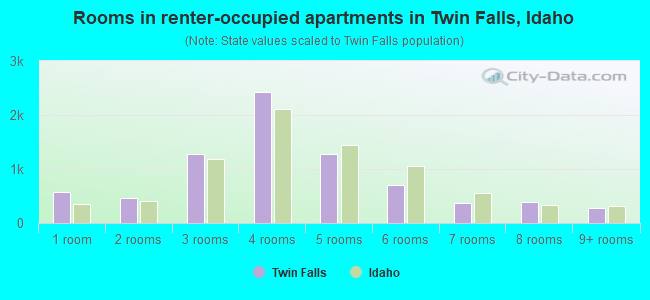
Rooms in renter-occupied apartments in Twin Falls, Idaho
574 1 room 468 2 rooms 1,273 3 rooms 2,434 4 rooms 1,274 5 rooms 704 6 rooms 373 7 rooms 388 8 rooms 276 9+ rooms
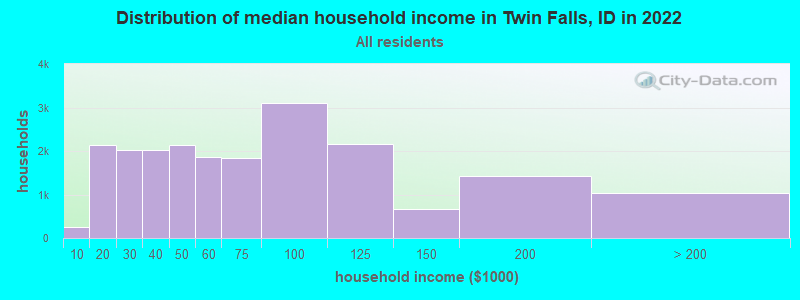
Twin Falls, ID household income distribution 263 Less than $10,0002,129 $10,000 to $19,9992,020 $20,000 to $29,9992,029 $30,000 to $39,9992,143 $40,000 to $49,9991,863 $50,000 to $59,9991,836 $60,000 to $74,9993,108 $75,000 to $99,9992,166 $100,000 to $124,999664 $125,000 to $149,9991,430 $150,000 to $199,9991,032 $200,000 or more
Home value of owner - occupied houses in 2022 in Twin Falls, ID 176 Less than $10,00049 $10,000 to $14,99956 $15,000 to $19,99912 $20,000 to $24,999194 $25,000 to $29,999126 $30,000 to $34,99943 $35,000 to $39,99980 $40,000 to $49,99936 $50,000 to $59,99950 $60,000 to $69,99911 $70,000 to $79,999113 $80,000 to $89,99954 $90,000 to $99,999244 $100,000 to $124,999470 $125,000 to $149,999621 $150,000 to $174,999367 $175,000 to $199,9991,482 $200,000 to $249,999855 $250,000 to $299,9992,738 $300,000 to $399,9991,466 $400,000 to $499,9991,311 $500,000 to $749,99956 $750,000 to $999,99941 $1,000,000 to $1,499,999Rent paid by renters in 2022 in Twin Falls, ID 122 $100 to $149121 $150 to $199132 $200 to $24963 $250 to $299195 $300 to $349101 $350 to $399224 $400 to $449146 $450 to $499212 $500 to $549192 $550 to $599468 $600 to $649592 $650 to $699277 $700 to $749300 $750 to $799739 $800 to $899672 $900 to $9991,254 $1,000 to $1,249484 $1,250 to $1,499622 $1,500 to $1,99970 $2,500 to $2,99962 $3,500 or more134 No cash rent
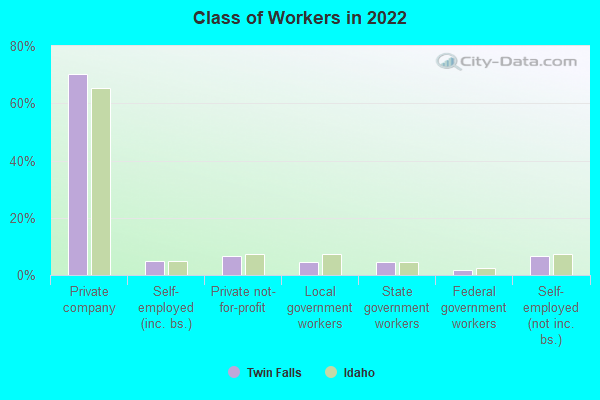
Percentage of workers working in this county: 86.2%Number of people working at home: 2,133 (8.2% of all workers )
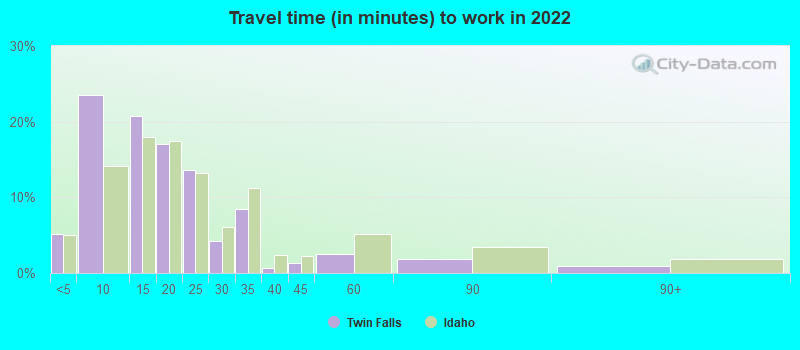
Travel time to work (commute)
Less than 5 minutes: 1,4115 to 9 minutes: 6,89610 to 14 minutes: 5,79515 to 19 minutes: 3,54920 to 24 minutes: 2,52525 to 29 minutes: 59330 to 34 minutes: 2,09335 to 39 minutes: 23440 to 44 minutes: 16445 to 59 minutes: 51460 to 89 minutes: 35290 or more minutes: 258
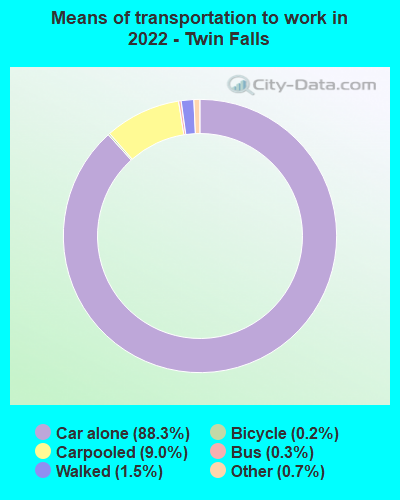
Means of transportation to work:
Drove a car alone: 25,894 (80.1%)Carpooled: 2,814 (8.7%)Bus : 73 (0.2%)Taxi: 306 (0.9%)Bicycle: 51 (0.2%)Walked: 491 (1.5%)Worked at home: 2,133 (6.6%)
Unemployment by race in 2022
Unemployment rate for White non-Hispanic residents 2.9% Males2.5% FemalesUnemployment rate for Black residents 12.0% MalesUnemployment rate for American Indian and Alaska Native residents 14.3% Males18.3% FemalesUnemployment rate for Asian residents 8.9% FemalesUnemployment rate for two or more race residents 2.1% Males4.4% FemalesUnemployment rate for Hispanic or Latino residents 0.6% Males2.4% Females
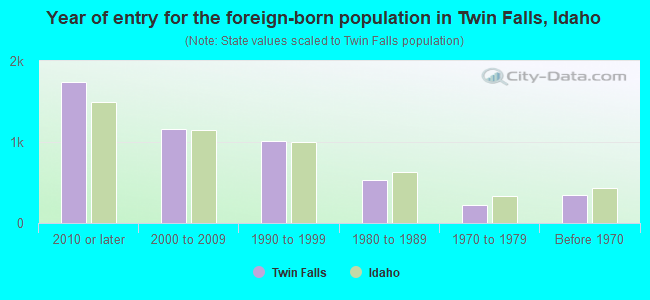
Year of entry for the foreign-born population in Twin Falls, Idaho
1,746 2010 or later 1,161 2000 to 2009 1,017 1990 to 1999 529 1980 to 1989 228 1970 to 1979 343 Before 1970
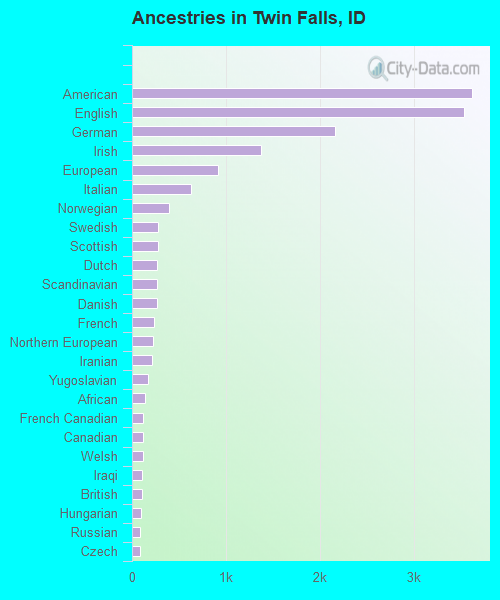
First ancestries reported:
American: 3,618 (13.6%)
English: 3,530 (13.2%)
German: 2,164 (8.1%)
Irish: 1,374 (5.2%)
European: 913 (3.4%)
Italian: 633 (2.4%)
Norwegian: 398 (1.5%)
Swedish: 281 (1.1%)
Scottish: 272 (1.0%)
Dutch: 270 (1.0%)
Scandinavian: 266 (1.0%)
Danish: 265 (1.0%)
French: 237 (0.9%)
Northern European: 222 (0.8%)
Iranian: 208 (0.8%)
Yugoslavian: 175 (0.7%)
African: 134 (0.5%)
French Canadian: 122 (0.5%)
Canadian: 121 (0.5%)
Welsh: 119 (0.4%)
Iraqi: 105 (0.4%)
British: 105 (0.4%)
Hungarian: 92 (0.3%)
Russian: 88 (0.3%)
Czech: 88 (0.3%)
Portuguese: 78 (0.3%)
Swiss: 78 (0.3%)
Basque: 76 (0.3%)
Polish: 67 (0.3%)
Scotch-Irish: 66 (0.2%)
Arab: 54 (0.2%)
Belgian: 37 (0.1%)
Czechoslovakian: 36 (0.1%)
German Russian: 32 (0.1%)
Croatian: 25 (0.09%)
Afghan: 23 (0.09%)
Albanian: 19 (0.07%)
Greek: 16 (0.06%)
Slavic: 11 (0.04%)
Ukrainian: 11 (0.04%)
Armenian: 9 (0.03%)
Kenyan: 9 (0.03%)
Austrian: 8 (0.03%)
Slovak: 6 (0.02%) Most common places of birth for foreign-born residents (%): Mexico Twin Falls:
32.5% (1,338)Idaho:
49.9% (53,107)
Nepal Twin Falls:
13.9% (574)Idaho:
1.0% (1,091)
Bosnia and Herzegovina Twin Falls:
5.2% (216)Idaho:
0.6% (675)
Bhutan Twin Falls:
5.2% (214)Idaho:
0.3% (325)
Iran Twin Falls:
4.9% (201)Idaho:
0.6% (622)
Europe, n.e.c. Twin Falls:
4.2% (171)Idaho:
0.2% (172)
Lebanon Twin Falls:
3.3% (137)Idaho:
0.2% (184)
Iraq Twin Falls:
3.3% (134)Idaho:
1.5% (1,626)
India Twin Falls:
3.2% (131)Idaho:
2.0% (2,143)
Costa Rica Twin Falls:
3.2% (130)Idaho:
0.3% (340)
Burma (Myanmar) Twin Falls:
2.2% (91)Idaho:
0.2% (251)
England Twin Falls:
1.6% (66)Idaho:
1.5% (1,595)
Canada Twin Falls:
1.5% (63)Idaho:
5.2% (5,503)
Place of birth for U.S.-born residents:
This state: 27,100Other state: 23,234Northeast: 948Midwest: 3,273South: 2,047West: 16,842 80.5% of Twin Falls residents lived in the same house 1 years ago.
Out of people who lived in different houses, 33.0% lived in this county.
Out of people who lived in different counties, 53.0% lived in Idaho.
Twin Falls:
80.5%State average:
85.1%
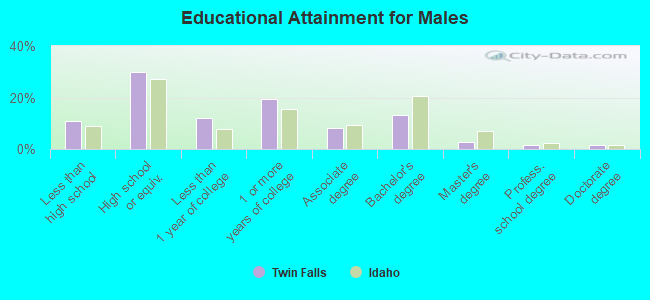
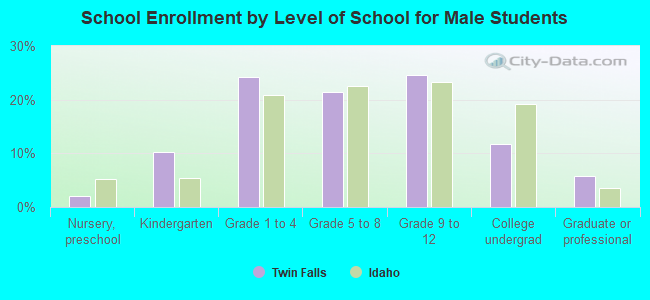
Education attainment for males 25 years and older:
No schooling: 194Nursery to 4th grade: 1305th and 6th grade: 2207th and 8th grade: 2239th grade: 3110th grade: 21711th grade: 36812th grade, no diploma: 539High school graduate (or equivalency): 5,252Less than 1 year of college: 2,091Some college more than 1 year, no degree: 3,422Associate degree: 1,428Bachelor's degree: 2,311Master's degree: 500Professional school degree: 294Doctorate degree: 264
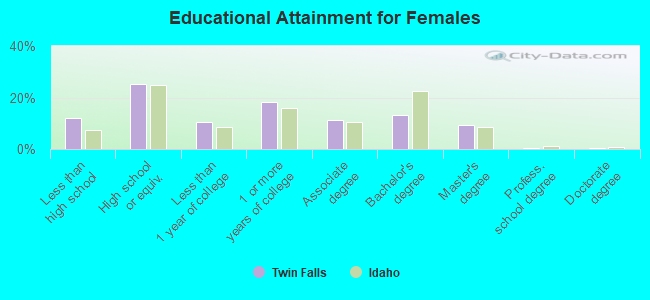
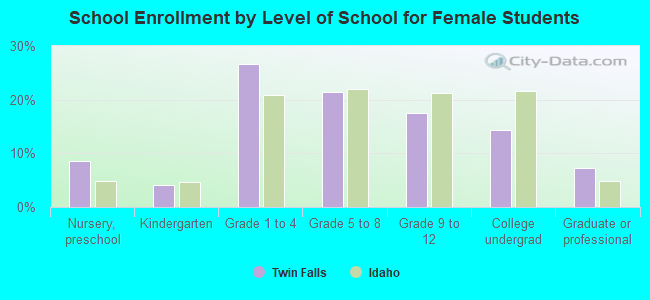
Education attainment for females 25 years and older:
No schooling: 599Nursery to 4th grade: 765th and 6th grade: 1397th and 8th grade: 1039th grade: 3910th grade: 57911th grade: 23912th grade, no diploma: 524High school graduate (or equivalency): 4,827Less than 1 year of college: 1,980Some college more than 1 year, no degree: 3,448Associate degree: 2,121Bachelor's degree: 2,514Master's degree: 1,795Professional school degree: 52Doctorate degree: 51
Housing units in structures:
One, detached: 14,729One, attached: 1,224Two: 9323 or 4: 1,7355 to 9: 81210 to 19: 40320 to 49: 42150 or more: 384Mobile homes: 1,053Boats, RVs, vans, etc.: 19Median worth of mobile homes: $39,815
Housing units lacking complete plumbing facilities in 2022: 0.2%Housing units lacking complete kitchen facilities in 2022: 1.3%House/condo owner moved in on average 8 years ago
Renter moved in on average 3 years ago
Private vs. public school enrollment:
Students in private schools in grades 1 to 8 (elementary and middle school): 726 Students in private schools in grades 9 to 12 (high school): 235 Students in private undergraduate colleges: 324