Races in Twin Falls, Idaho (ID) Detailed Stats
Data:
Races - White alone (%)
Races - White alone (% change since 2000)
Races - Black alone (%)
Races - Black alone (% change since 2000)
Races - American Indian alone (%)
Races - American Indian alone (% change since 2000)
Races - Asian alone (%)
Races - Asian alone (% change since 2000)
Races - Hispanic (%)
Races - Hispanic (% change since 2000)
Races - Native Hawaiian and Other Pacific Islander alone (%)
Races - Native Hawaiian and Other Pacific Islander alone (% change since 2000)
Races - Two or more races(%)
Races - Two or more races(% change since 2000)
Races - Other race alone (%)
Races - Other race alone (% change since 2000)
Racial diversity
Place of birth - Born in state of residence (%)
Place of birth - Born in state of residence (%) - White
Place of birth - Born in state of residence (%) - Black or African American
Place of birth - Born in state of residence (%) - Asian
Place of birth - Born in state of residence (%) - Hispanic or Latino
Place of birth - Born in state of residence (%) - American Indian and Alaska Native
Place of birth - Born in state of residence (%) - Multirace
Place of birth - Born in state of residence (%) - Other Race
Place of birth - Born in other state (%)
Place of birth - Born in other state (%) - White
Place of birth - Born in other state (%) - Black or African American
Place of birth - Born in other state (%) - Asian
Place of birth - Born in other state (%) - Hispanic or Latino
Place of birth - Born in other state (%) - American Indian and Alaska Native
Place of birth - Born in other state (%) - Multirace
Place of birth - Born in other state (%) - Other Race
Place of birth - Native, outside of US (%)
Place of birth - Native, outside of US (%) - White
Place of birth - Native, outside of US (%) - Black or African American
Place of birth - Native, outside of US (%) - Asian
Place of birth - Native, outside of US (%) - Hispanic or Latino
Place of birth - Native, outside of US (%) - American Indian and Alaska Native
Place of birth - Native, outside of US (%) - Multirace
Place of birth - Native, outside of US (%) - Other Race
Place of birth - Foreign born (%)
Place of birth - Foreign born (%) - White
Place of birth - Foreign born (%) - Black or African American
Place of birth - Foreign born (%) - Asian
Place of birth - Foreign born (%) - Hispanic or Latino
Place of birth - Foreign born (%) - American Indian and Alaska Native
Place of birth - Foreign born (%) - Multirace
Place of birth - Foreign born (%) - Other Race
Residents speaking English at home (%)
Residents speaking English at home - Born in the United States (%)
Residents speaking English at home - Native, born elsewhere (%)
Residents speaking English at home - Foreign born (%)
Residents speaking Spanish at home (%)
Residents speaking Spanish at home - Born in the United States (%)
Residents speaking Spanish at home - Native, born elsewhere (%)
Residents speaking Spanish at home - Foreign born (%)
Residents speaking other language at home (%)
Residents speaking other language at home - Born in the United States (%)
Residents speaking other language at home - Native, born elsewhere (%)
Residents speaking other language at home - Foreign born (%)
Marital status - Never married (%)
Marital status - Now married (%)
Marital status - Separated (%)
Marital status - Widowed (%)
Marital status - Divorced (%)
Ancestries Reported - Arab (%)
Ancestries Reported - Czech (%)
Ancestries Reported - Danish (%)
Ancestries Reported - Dutch (%)
Ancestries Reported - English (%)
Ancestries Reported - French (%)
Ancestries Reported - French Canadian (%)
Ancestries Reported - German (%)
Ancestries Reported - Greek (%)
Ancestries Reported - Hungarian (%)
Ancestries Reported - Irish (%)
Ancestries Reported - Italian (%)
Ancestries Reported - Lithuanian (%)
Ancestries Reported - Norwegian (%)
Ancestries Reported - Polish (%)
Ancestries Reported - Portuguese (%)
Ancestries Reported - Russian (%)
Ancestries Reported - Scotch-Irish (%)
Ancestries Reported - Scottish (%)
Ancestries Reported - Slovak (%)
Ancestries Reported - Subsaharan African (%)
Ancestries Reported - Swedish (%)
Ancestries Reported - Swiss (%)
Ancestries Reported - Ukrainian (%)
Ancestries Reported - United States (%)
Ancestries Reported - Welsh (%)
Ancestries Reported - West Indian (%)
Ancestries Reported - Other (%)
Geographical mobility - Same house 1 year ago (%)
Geographical mobility - Same house 1 year ago (%) - White
Geographical mobility - Same house 1 year ago (%) - Black or African American
Geographical mobility - Same house 1 year ago (%) - Asian
Geographical mobility - Same house 1 year ago (%) - Hispanic or Latino
Geographical mobility - Same house 1 year ago (%) - American Indian and Alaska Native
Geographical mobility - Same house 1 year ago (%) - Multirace
Geographical mobility - Same house 1 year ago (%) - Other Race
Geographical mobility - Moved within same county (%)
Geographical mobility - Moved within same county (%) - White
Geographical mobility - Moved within same county (%) - Black or African American
Geographical mobility - Moved within same county (%) - Asian
Geographical mobility - Moved within same county (%) - Hispanic or Latino
Geographical mobility - Moved within same county (%) - American Indian and Alaska Native
Geographical mobility - Moved within same county (%) - Multirace
Geographical mobility - Moved within same county (%) - Other Race
Geographical mobility - Moved from different county within same state (%)
Geographical mobility - Moved from different county within same state (%) - White
Geographical mobility - Moved from different county within same state (%) - Black or African American
Geographical mobility - Moved from different county within same state (%) - Asian
Geographical mobility - Moved from different county within same state (%) - Hispanic or Latino
Geographical mobility - Moved from different county within same state (%) - American Indian and Alaska Native
Geographical mobility - Moved from different county within same state (%) - Multirace
Geographical mobility - Moved from different county within same state (%) - Other Race
Geographical mobility - Moved from different state (%)
Geographical mobility - Moved from different state (%) - White
Geographical mobility - Moved from different state (%) - Black or African American
Geographical mobility - Moved from different state (%) - Asian
Geographical mobility - Moved from different state (%) - Hispanic or Latino
Geographical mobility - Moved from different state (%) - American Indian and Alaska Native
Geographical mobility - Moved from different state (%) - Multirace
Geographical mobility - Moved from different state (%) - Other Race
Geographical mobility - Moved from abroad (%)
Geographical mobility - Moved from abroad (%) - White
Geographical mobility - Moved from abroad (%) - Black or African American
Geographical mobility - Moved from abroad (%) - Asian
Geographical mobility - Moved from abroad (%) - Hispanic or Latino
Geographical mobility - Moved from abroad (%) - American Indian and Alaska Native
Geographical mobility - Moved from abroad (%) - Multirace
Geographical mobility - Moved from abroad (%) - Other Race
Place of birth for the foreign-born population - Ireland (%)
Place of birth for the foreign-born population - Denmark (%)
Place of birth for the foreign-born population - Norway (%)
Place of birth for the foreign-born population - Sweden (%)
Place of birth for the foreign-born population - United Kingdom (%)
Place of birth for the foreign-born population - England (%)
Place of birth for the foreign-born population - Scotland (%)
Place of birth for the foreign-born population - Other Northern Europe (%)
Place of birth for the foreign-born population - Austria (%)
Place of birth for the foreign-born population - Belgium (%)
Place of birth for the foreign-born population - France (%)
Place of birth for the foreign-born population - Germany (%)
Place of birth for the foreign-born population - Netherlands (%)
Place of birth for the foreign-born population - Switzerland (%)
Place of birth for the foreign-born population - Other Western Europe (%)
Place of birth for the foreign-born population - Greece (%)
Place of birth for the foreign-born population - Italy (%)
Place of birth for the foreign-born population - Portugal (%)
Place of birth for the foreign-born population - Spain (%)
Place of birth for the foreign-born population - Other Southern Europe (%)
Place of birth for the foreign-born population - Albania (%)
Place of birth for the foreign-born population - Belarus (%)
Place of birth for the foreign-born population - Bosnia and Herzegovina (%)
Place of birth for the foreign-born population - Bulgaria (%)
Place of birth for the foreign-born population - Croatia (%)
Place of birth for the foreign-born population - Czechoslovakia (%)
Place of birth for the foreign-born population - Hungary (%)
Place of birth for the foreign-born population - Latvia (%)
Place of birth for the foreign-born population - Lithuania (%)
Place of birth for the foreign-born population - North Macedonia (Macedonia) (%)
Place of birth for the foreign-born population - Moldova (%)
Place of birth for the foreign-born population - Poland (%)
Place of birth for the foreign-born population - Romania (%)
Place of birth for the foreign-born population - Russia (%)
Place of birth for the foreign-born population - Serbia (%)
Place of birth for the foreign-born population - Ukraine (%)
Place of birth for the foreign-born population - Other Eastern Europe (%)
Place of birth for the foreign-born population - China (%)
Place of birth for the foreign-born population - Hong Kong (%)
Place of birth for the foreign-born population - Taiwan (%)
Place of birth for the foreign-born population - Japan (%)
Place of birth for the foreign-born population - Korea (%)
Place of birth for the foreign-born population - Other Eastern Asia (%)
Place of birth for the foreign-born population - Afghanistan (%)
Place of birth for the foreign-born population - Bangladesh (%)
Place of birth for the foreign-born population - India (%)
Place of birth for the foreign-born population - Iran (%)
Place of birth for the foreign-born population - Kazakhstan (%)
Place of birth for the foreign-born population - Nepal (%)
Place of birth for the foreign-born population - Pakistan (%)
Place of birth for the foreign-born population - Sri Lanka (%)
Place of birth for the foreign-born population - Uzbekistan (%)
Place of birth for the foreign-born population - Other South Central Asia (%)
Place of birth for the foreign-born population - Burma (%)
Place of birth for the foreign-born population - Cambodia (%)
Place of birth for the foreign-born population - Indonesia (%)
Place of birth for the foreign-born population - Laos (%)
Place of birth for the foreign-born population - Malaysia (%)
Place of birth for the foreign-born population - Philippines (%)
Place of birth for the foreign-born population - Singapore (%)
Place of birth for the foreign-born population - Thailand (%)
Place of birth for the foreign-born population - Vietnam (%)
Place of birth for the foreign-born population - Other South Eastern Asia (%)
Place of birth for the foreign-born population - Armenia (%)
Place of birth for the foreign-born population - Iraq (%)
Place of birth for the foreign-born population - Israel (%)
Place of birth for the foreign-born population - Jordan (%)
Place of birth for the foreign-born population - Kuwait (%)
Place of birth for the foreign-born population - Lebanon (%)
Place of birth for the foreign-born population - Saudi Arabia (%)
Place of birth for the foreign-born population - Syria (%)
Place of birth for the foreign-born population - Turkey (%)
Place of birth for the foreign-born population - Yemen (%)
Place of birth for the foreign-born population - Other Western Asia (%)
Place of birth for the foreign-born population - Eritrea (%)
Place of birth for the foreign-born population - Ethiopia (%)
Place of birth for the foreign-born population - Kenya (%)
Place of birth for the foreign-born population - Somalia (%)
Place of birth for the foreign-born population - Uganda (%)
Place of birth for the foreign-born population - Zimbabwe (%)
Place of birth for the foreign-born population - Other Eastern Africa (%)
Place of birth for the foreign-born population - Cameroon (%)
Place of birth for the foreign-born population - Congo (%)
Place of birth for the foreign-born population - Democratic Republic of Congo (Zaire) (%)
Place of birth for the foreign-born population - Other Middle Africa (%)
Place of birth for the foreign-born population - Egypt (%)
Place of birth for the foreign-born population - Morocco (%)
Place of birth for the foreign-born population - Sudan (%)
Place of birth for the foreign-born population - Other Northern Africa (%)
Place of birth for the foreign-born population - South Africa (%)
Place of birth for the foreign-born population - Other Southern Africa (%)
Place of birth for the foreign-born population - Cabo Verde (%)
Place of birth for the foreign-born population - Ghana (%)
Place of birth for the foreign-born population - Liberia (%)
Place of birth for the foreign-born population - Nigeria (%)
Place of birth for the foreign-born population - Senegal (%)
Place of birth for the foreign-born population - Sierra Leone (%)
Place of birth for the foreign-born population - Other Western Africa (%)
Place of birth for the foreign-born population - Australia (%)
Place of birth for the foreign-born population - New Zealand (%)
Place of birth for the foreign-born population - Fiji (%)
Place of birth for the foreign-born population - Micronesia (%)
Place of birth for the foreign-born population - Bahamas (%)
Place of birth for the foreign-born population - Barbados (%)
Place of birth for the foreign-born population - Cuba (%)
Place of birth for the foreign-born population - Dominica (%)
Place of birth for the foreign-born population - Dominican Republic (%)
Place of birth for the foreign-born population - Grenada (%)
Place of birth for the foreign-born population - Haiti (%)
Place of birth for the foreign-born population - Jamaica (%)
Place of birth for the foreign-born population - St. Vincent and the Grenadines (%)
Place of birth for the foreign-born population - Trinidad and Tobago (%)
Place of birth for the foreign-born population - West Indies (%)
Place of birth for the foreign-born population - Other Caribbean (%)
Place of birth for the foreign-born population - Belize (%)
Place of birth for the foreign-born population - Costa Rica (%)
Place of birth for the foreign-born population - El Salvador (%)
Place of birth for the foreign-born population - Guatemala (%)
Place of birth for the foreign-born population - Honduras (%)
Place of birth for the foreign-born population - Mexico (%)
Place of birth for the foreign-born population - Nicaragua (%)
Place of birth for the foreign-born population - Panama (%)
Place of birth for the foreign-born population - Other Central America (%)
Place of birth for the foreign-born population - Argentina (%)
Place of birth for the foreign-born population - Bolivia (%)
Place of birth for the foreign-born population - Brazil (%)
Place of birth for the foreign-born population - Chile (%)
Place of birth for the foreign-born population - Colombia (%)
Place of birth for the foreign-born population - Ecuador (%)
Place of birth for the foreign-born population - Guyana (%)
Place of birth for the foreign-born population - Peru (%)
Place of birth for the foreign-born population - Uruguay (%)
Place of birth for the foreign-born population - Venezuela (%)
Place of birth for the foreign-born population - Other South America (%)
Place of birth for the foreign-born population - Canada (%)
Place of birth for the foreign-born population - Other Northern America (%)
Place of birth for the foreign-born population - Other (%)
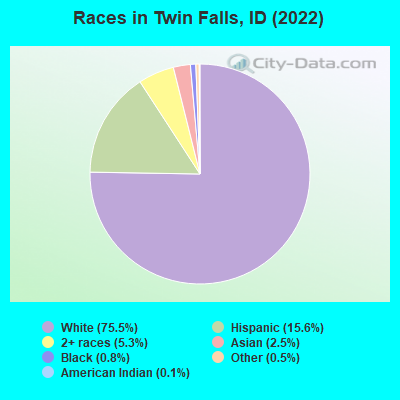
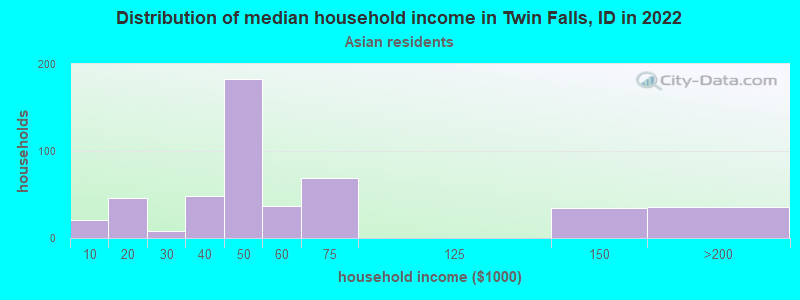
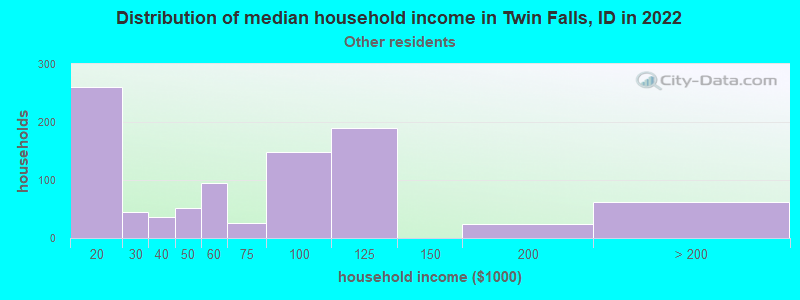
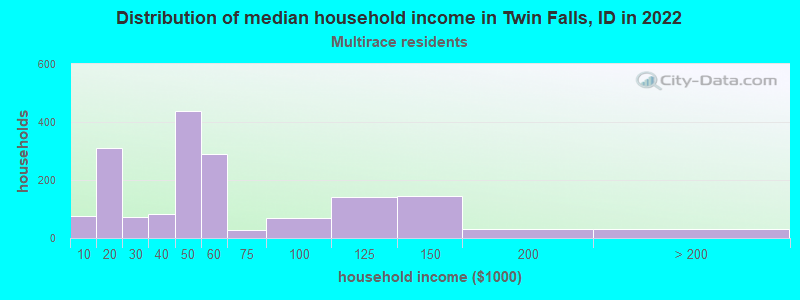
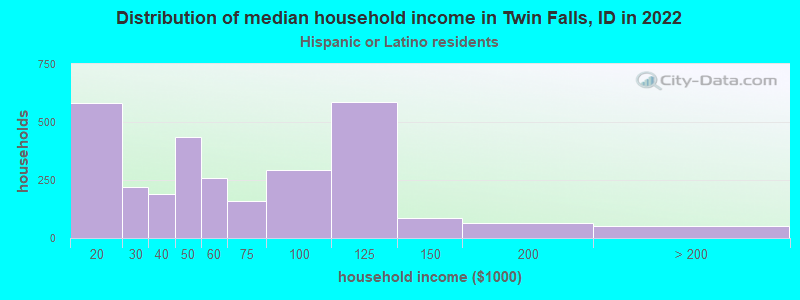
According to 2022 data, the most numerous races in Twin Falls, ID are White alone (41,320 residents), Hispanic (8,530 residents), and Two or more races (2,891 residents). 88.0% of Twin Falls residents speak English at home. 7.6% of Twin Falls, ID residents are foreign-born (3.2% born in Asia, 3.0% born in Latin America, 1.2% born in Europe), which is 34.3% greater than the foreign-born rate of 5.0% across the entire state of Idaho.
Race distribution in Twin Falls
2000 2022
1,139,291 88.0% White alone 101,690 7.9% Hispanic 18,261 1.4% Two or more races 15,789 1.2% American Indian alone 11,641 0.9% Asian alone 4,889 0.4% Black alone 1,192 0.09% Other race alone 1,200 0.09% Native Hawaiian and Other
1,531,219 79.0% White alone 261,921 13.5% Hispanic 81,112 4.2% Two or more races 25,174 1.3% Asian alone 15,825 0.8% American Indian alone 11,868 0.6% Black alone 8,752 0.5% Other race alone 3,162 0.2% Native Hawaiian and Other
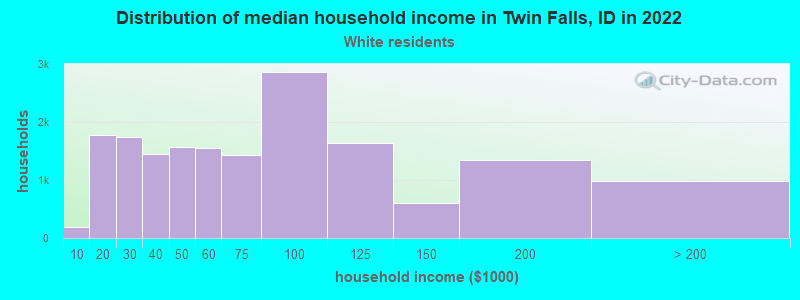
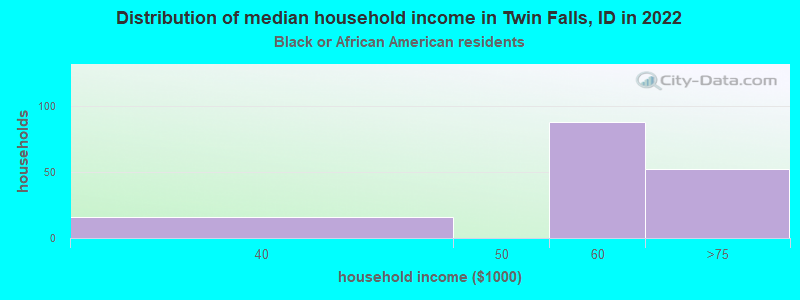
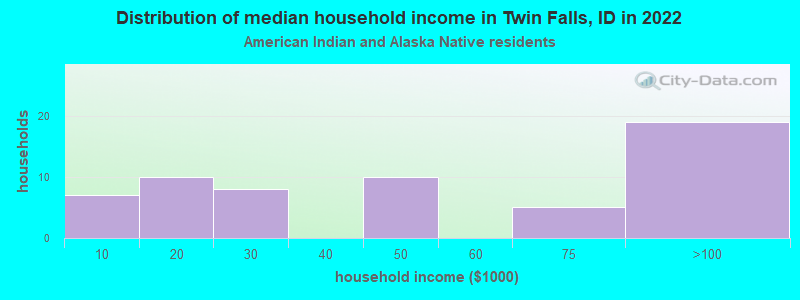
Income and house value in Twin Falls Median household income in 2022 $65,275 White non-Hispanic householders$54,813 Black householders$44,094 Asian householders$58,141 Some other race householders$36,716 Two or more races householders$47,038 Hispanic or Latino race householdersMedian 2022 house value $328,422 White Non-Hispanic householders$498,908 American Indian or Alaska Native householders $399,894 Asian householders$232,893 Some other race householders$296,347 Two or more races householders$276,822 Hispanic or Latino householders
Median age by race in Twin Falls
36.2 Median age for White residents36.0 37.1 34.3 Median age for Black or African American residents24.5 38.6 51.0 Median age for American Indian / Alaska Native residents60.3 24.5 27.0 Median age for Asian residents42.2 23.7 -666,666,666.0 Median age for Native Hawaiian / Pacific Islander residents-666,666,666.0 -666,666,666.0 34.7 Median age for Other race residents33.6 30.5 27.8 Median age for Two or more races residents42.6 18.5 38.2 Median age for White alone residents37.8 38.4 27.9 Median age for Hispanic or Latino residents29.4 24.7
Owner/renter occupied households by race in Twin Falls
House owners and renters - White residents 11,436 65.9% Owner occupied5,913 34.1% Renter occupiedHouse owners and renters - Black or African American residents 191 100.0% Renter occupiedHouse owners and renters - American Indian / Alaska Native residents 15 24.3% Owner occupied46 75.7% Renter occupiedHouse owners and renters - Asian residents 238 52.1% Owner occupied218 47.9% Renter occupiedHouse owners and renters - Other race residents 808 67.9% Owner occupied382 32.1% Renter occupiedHouse owners and renters - Two or more races residents 720 45.0% Owner occupied882 55.0% Renter occupiedHouse owners and renters - White alone residents 11,129 68.3% Owner occupied5,154 31.7% Renter occupiedHouse owners and renters - Hispanic or Latino residents 1,535 49.6% Owner occupied1,562 50.4% Renter occupied
Language usage in Twin Falls
English speakers - Total 88.0% of residents of Twin Falls speak English at home.
6.8% of residents speak Spanish at home 2,378 69.1% Speak English very well1,064 30.9% Speak English less than very well6.2% of residents speak other language at home 1,849 59.0% Speak English very well1,287 41.0% Speak English less than very well
English speakers - Born in the United States 93.8% of residents of Twin Falls speak English at home.
5.4% of residents speak Spanish at home 1,138 91.8% Speak English very well101 8.2% Speak English less than very well0.8% of residents speak other language at home 168 96.0% Speak English very well7 4.0% Speak English less than very well
All residents speak only English at home
English speakers - Foreign-born 17.7% of residents of Twin Falls speak English at home.
29.1% of residents speak Spanish at home 377 35.4% Speak English very well688 64.6% Speak English less than very well63.8% of residents speak other language at home 1,089 46.6% Speak English very well1,247 53.4% Speak English less than very well
White (Caucasian) - Speak only English Native:
96.6% (39,646)Foreign-born:
21.5% (317)
White (Caucasian) - Speak another language Native:
3.4% (1,395)Foreign-born:
77.9% (1,148)
Black or African American - Speak only English Native:
100.0% (380)Foreign-born:
35.5% (9)
American Indian / Alaska Native - Speak only English Native:
57.1% (89)Foreign-born:
28.1% (18)
American Indian / Alaska Native - Speak another language Native:
49.7% (77)Foreign-born:
75.3% (48)
Asian - Speak only English Native:
83.6% (69)Foreign-born:
9.0% (112)
Asian - Speak another language Native:
17.8% (15)Foreign-born:
88.6% (1,100)
Other race - Speak only English Native:
62.5% (1,356)Foreign-born:
7.3% (37)
Other race - Speak another language Native:
44.1% (957)Foreign-born:
91.0% (458)
Two or more races - Speak only English Native:
81.5% (2,584)Foreign-born:
2.5% (12)
Two or more races - Speak another language Native:
19.8% (629)Foreign-born:
90.4% (447)
White alone - Speak only English Native:
98.6% (37,510)Foreign-born:
17.2% (257)
White alone - Speak another language Native:
1.4% (526)Foreign-born:
85.4% (1,276)
Hispanic or Latino - Speak only English Native:
71.1% (4,793)Foreign-born:
15.5% (188)
Hispanic or Latino - Speak another language Native:
33.4% (2,254)Foreign-born:
86.0% (1,042)
Foreign-born residents in Twin Falls 4,115 residents are foreign born (3.2% Asia , 3.0% Latin America , 1.2% Europe ).
Marital status for residents in Twin Falls Marital status - White (Caucasian) population 15 years and over
Males 29.5% Never married52.7% Now married1.3% Separated3.5% Widowed12.9% DivorcedFemales 22.6% Never married53.0% Now married1.1% Separated9.3% Widowed14.1% DivorcedWomen who gave birth in the past 12 months Now married:
78.1% (649)Unmarried:
21.9% (182)
Women who did not give birth in the past 12 months Now married:
51.2% (5,160)Unmarried:
48.8% (4,909)
Marital status - Black or African American population 15 years and over
Males 40.7% Never married31.6% Now married27.6% Separated0.0% Widowed0.0% DivorcedFemales 13.2% Never married0.0% Now married0.0% Separated0.0% Widowed86.8% DivorcedWomen who did not give birth in the past 12 months Now married:
0.0% (0)Unmarried:
100.0% (59)
Marital status - American Indian / Alaska Native population 15 years and over
Males 29.9% Never married59.7% Now married0.0% Separated0.0% Widowed10.4% DivorcedFemales 63.4% Never married5.0% Now married0.0% Separated5.9% Widowed25.7% DivorcedWomen who did not give birth in the past 12 months Now married:
5.9% (6)Unmarried:
94.1% (91)
Marital status - Asian population 15 years and over
Males 9.2% Never married84.2% Now married6.5% Separated0.0% Widowed0.0% DivorcedFemales 20.5% Never married51.7% Now married0.0% Separated24.4% Widowed3.3% DivorcedWomen who gave birth in the past 12 months Now married:
100.0% (225)Unmarried:
0.0% (0)
Women who did not give birth in the past 12 months Now married:
50.3% (199)Unmarried:
49.7% (197)
Marital status - Other race population 15 years and over
Males 33.9% Never married50.9% Now married3.0% Separated6.3% Widowed5.9% DivorcedFemales 36.5% Never married54.7% Now married0.0% Separated1.9% Widowed6.9% DivorcedWomen who gave birth in the past 12 months Now married:
78.3% (51)Unmarried:
21.7% (14)
Women who did not give birth in the past 12 months Now married:
49.0% (332)Unmarried:
51.0% (345)
Marital status - Two or more races population 15 years and over
Males 53.5% Never married32.3% Now married0.0% Separated0.0% Widowed14.2% DivorcedFemales 30.7% Never married39.7% Now married0.4% Separated4.5% Widowed24.8% DivorcedWomen who did not give birth in the past 12 months Now married:
38.3% (447)Unmarried:
61.7% (719)
Marital status - White alone, not Hispanic / Latino population 15 years and over
Males 27.6% Never married53.8% Now married1.3% Separated3.8% Widowed13.5% DivorcedFemales 21.6% Never married52.7% Now married1.0% Separated9.7% Widowed14.9% DivorcedWomen who gave birth in the past 12 months Now married:
77.4% (578)Unmarried:
22.6% (168)
Women who did not give birth in the past 12 months Now married:
51.4% (4,778)Unmarried:
48.6% (4,522)
Marital status - Hispanic or Latino population 15 years and over
Males 45.9% Never married43.3% Now married1.5% Separated1.8% Widowed7.4% DivorcedFemales 36.7% Never married50.5% Now married0.7% Separated2.3% Widowed9.8% DivorcedWomen who gave birth in the past 12 months Now married:
81.3% (124)Unmarried:
18.7% (28)
Women who did not give birth in the past 12 months Now married:
44.3% (900)Unmarried:
55.7% (1,132)
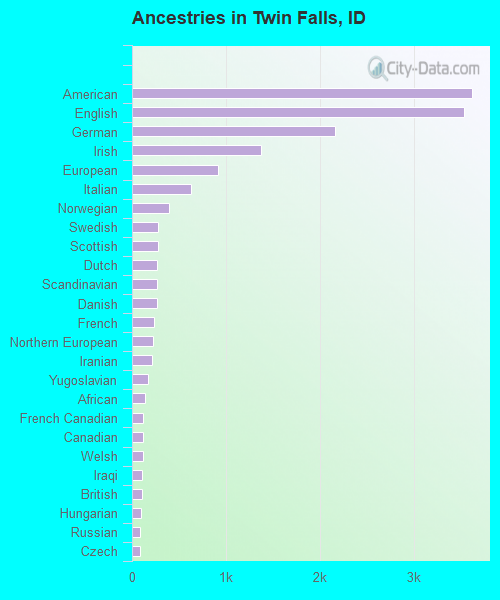
Ancestries in Twin Falls
3,618 13.6% American3,530 13.2% English2,164 8.1% German1,374 5.2% Irish913 3.4% European633 2.4% Italian398 1.5% Norwegian281 1.1% Swedish272 1.0% Scottish270 1.0% Dutch266 1.0% Scandinavian265 1.0% Danish237 0.9% French222 0.8% Northern European208 0.8% Iranian175 0.7% Yugoslavian134 0.5% African122 0.5% French Canadian121 0.5% Canadian119 0.4% Welsh105 0.4% Iraqi105 0.4% British92 0.3% Hungarian88 0.3% Russian88 0.3% Czech78 0.3% Portuguese78 0.3% Swiss76 0.3% Basque67 0.3% Polish66 0.2% Scotch-Irish54 0.2% Arab37 0.1% Belgian36 0.1% Czechoslovakian32 0.1% German Russian25 0.09% Croatian23 0.09% Afghan19 0.07% Albanian16 0.06% Greek11 0.04% Slavic11 0.04% Ukrainian9 0.03% Armenian9 0.03% Kenyan8 0.03% Austrian6 0.02% Slovak
Geographical mobility in Twin Falls Same house 1 year ago 36,366 81.6% White (Caucasian)364 84.4% Black or African American177 75.2% American Indian / Alaska Native1,224 94.3% Asian2,318 94.2% Other race3,241 80.4% Two or more races33,702 81.3% White alone, not Hispanic / Latino6,591 79.6% Hispanic or LatinoMoved within same county 4,907 11.0% White / Caucasian21 4.8% Black or African American16 6.9% American Indian / Alaska Native70 2.9% Other race345 8.6% Two or more races4,822 11.6% White alone, not Hispanic / Latino698 8.4% Hispanic or LatinoMoved within same state 1,678 3.8% White / Caucasian37 8.5% Black or African American6 2.7% American Indian / Alaska Native27 2.1% Asian117 4.8% Other race269 6.7% Two or more races1,549 3.7% White alone, not Hispanic / Latino416 5.0% Hispanic or LatinoMoved from different state 1,110 2.5% White / Caucasian19 7.9% American Indian / Alaska Native39 3.0% Asian3 99.3% Native Hawaiian / Pacific Islander107 2.7% Two or more races1,035 2.5% White alone, not Hispanic / Latino457 5.5% Hispanic or LatinoMoved from abroad 18 0.0% White8 1.9% Black or African American1 0.0% Other race18 0.0% White alone, not Hispanic / Latino1 0.0% Hispanic or Latino
Children Nativity (place of birth) in Twin Falls
Children under 6 years - Living with two parents Both parents native 2,617 100.0% NativeBoth parents foreign-born 194 100.0% NativeOne native, one foreign-born parent 494 100.0% NativeChildren under 6 years - Living with one parent Native parent 1,011 100.0% NativeForeign-born parent 66 100.0% NativeChildren 6 to 17 years - Living with two parents Both parents native 5,702 100.0% NativeBoth parents foreign-born 35 11.3% Native274 88.7% Foreign-bornOne native, one foreign-born parent 709 100.0% NativeChildren 6 to 17 years - Living with one parent Native parent 2,113 100.0% NativeForeign-born parent 219 50.3% Native216 49.7% Foreign-born
Grandparents responsible for own grandchildren in Twin Falls
Grandparents (30 to 59 years) White / Caucasian 109 82.7% Responsible for grandchildren23 17.3% Not responsible for grandchildrenWhite alone, not Hispanic / Latino 118 83.7% Responsible for grandchildren23 16.3% Not responsible for grandchildrenGrandparents (60 years and over) White / Caucasian 83 19.2% Responsible for grandchildren349 80.8% Not responsible for grandchildrenWhite alone, not Hispanic / Latino 83 26.4% Responsible for grandchildren230 73.6% Not responsible for grandchildren