Tucker, GA (Georgia) Houses and Residents
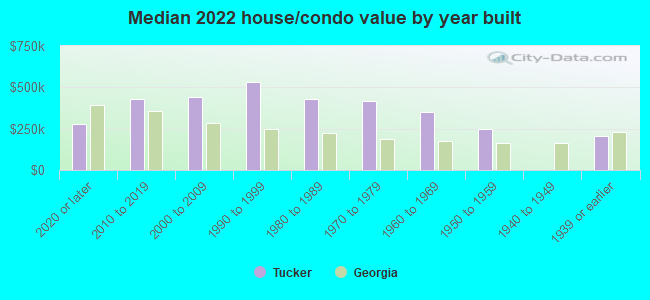
Estimated median house or condo value in 2022: $387,291 (it was $156,900 in 2000 )
Tucker:
$387,291Georgia:
$297,400
Lower value quartile - upper value quartile: $324,744 - $459,388Mean price in 2022: Detached houses: $351,325 Here:
$351,325State:
$376,364
Townhouses or other attached units: $241,906 Here:
$241,906State:
$341,709
In 3-to-4-unit structures: $146,675 Here:
$146,675State:
$250,092
In 5-or-more-unit structures: $387,840 Here:
$387,840State:
$370,730
Total population: 27,581 (Urban population: 26,616, Rural population: 0)
Houses: 16,942 (15,124 occupied: 9,455 owner occupied, 5,195 renter occupied )
% of renters here:
35%State:
34%
Housing density: 1,410 houses/condos per square mile
Median price asked for vacant for-sale houses and condos in 2022: $413,269.
Median contract rent in 2022: $1,256 (lower quartile is $1,030, upper quartile is $1,603)
Median rent asked for vacant for-rent units in 2022: $1,453
Median gross rent in Tucker, GA in 2022: $1,477
Housing units in Tucker with a mortgage: 6,127 (413 second mortgage, 0 home equity loan, 426 both second mortgage and home equity loan )Houses without a mortgage: 52
Median household income for houses/condos with a mortgage: $121,294
Median household income for apartments without a mortgage: $93,687
Median monthly housing costs: $1,420
Data:
Median house or condo value ($)
Median house or condo value ($ change since 2000)
Median house or condo value ($) - White
Median house or condo value ($) - Black or African American
Median house or condo value ($) - Asian
Median house or condo value ($) - Hispanic or Latino
Median house or condo value ($) - American Indian and Alaska Native
Median house or condo value ($) - Multirace
Median house or condo value ($) - Other Race
Median price asked for mobile homes ($)
Household density (households per square mile)
Mean house or condo value by units in structure - 1, detached ($)
Mean house or condo value by units in structure - 1, attached ($)
Mean house or condo value by units in structure - 2 ($)
Mean house or condo value by units in structure by units in structure - 3 or 4 ($)
Mean house or condo value by units in structure - 5 or more ($)
Mean house or condo value by units in structure - Boat, RV, van, etc. ($)
Mean house or condo value by units in structure - Mobile home ($)
Median contract rent ($)
Median contract rent - Lower quartile ($)
Median contract rent - Upper quartile ($)
Median gross rent ($)
Urban houses (%)
Rural houses (%)
Houses occupied (%)
Houses occupied (% change since 2000)
Houses owner occupied (%)
Houses owner occupied (% change since 2000)
Houses renter occupied (%)
Houses renter occupied (% change since 2000)
Vacant housing units - For rent (%)
Vacant housing units - For rent (% change since 2000)
Vacant housing units - For sale only (%)
Vacant housing units - For sale only (% change since 2000)
Vacant housing units - Rented or sold, not occupied (%)
Vacant housing units - Rented or sold, not occupied (% change since 2000)
Vacant housing units - For seasonal, recreational, or occasional use (%)
Vacant housing units - For seasonal, recreational, or occasional use (% change since 2000)
Vacant housing units - For migrant workers (%)
Vacant housing units - For migrant workers (% change since 2000)
Vacant housing units - Other vacant (%)
Vacant housing units - Other vacant (% change since 2000)
Median monthly housing costs ($)
Median household income for houses/condos with a mortgage ($)
Median household income for houses/condos without a mortgage ($)
Median household income ($)
Median household income ($) - White
Median household income ($) - Black or African American
Median household income ($) - Asian
Median household income ($) - Hispanic or Latino
Median household income ($) - American Indian and Alaska Native
Median household income ($) - Multirace
Median household income ($) - Other Race
Mortgage status - with mortgage (%)
Mortgage status - with second mortgage (%)
Mortgage status - with home equity loan (%)
Mortgage status - with both second mortgage and home equity loan (%)
Mortgage status - without a mortgage (%)
Median year house/condo built
Median year apartment built
Household type by relationship - Male householder living alone (%)
Household type by relationship - Male householder not living alone (%)
Household type by relationship - Female householder living alone (%)
Household type by relationship - Female householder not living alone (%)
Household type by relationship - Opposite-Sex spouse (%)
Household type by relationship - Same-Sex spouse (%)
Household type by relationship - Opposite-Sex unmarried partner (%)
Household type by relationship - Same-Sex unmarried partner (%)
Household type by relationship - In group quarters (%)
Size of family households - 2-person household (%)
Size of family households - 3-person household (%)
Size of family households - 4-person household (%)
Size of family households - 5-person household (%)
Size of family households - 6-person household (%)
Size of family households - 7-or-more-person household (%)
Size of nonfamily households - 1-person household (%)
Size of nonfamily households - 2-person household (%)
Size of nonfamily households - 3-person household (%)
Size of nonfamily households - 4-person household (%)
Size of nonfamily households - 5-person household (%)
Size of nonfamily households - 6-person household (%)
Size of nonfamily households - 7-or-moreperson household (%)
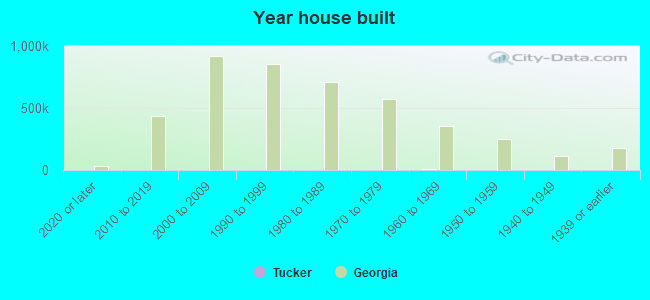
Year house built - Built 2010 or later (%)
Year house built - Built 2000 to 2009 (%)
Year house built - Built 1990 to 1999 (%)
Year house built - Built 1980 to 1989 (%)
Year house built - Built 1970 to 1979 (%)
Year house built - Built 1960 to 1969 (%)
Year house built - Built 1950 to 1959 (%)
Year house built - Built 1940 to 1949 (%)
Year house built - Built 1939 or earlier (%)
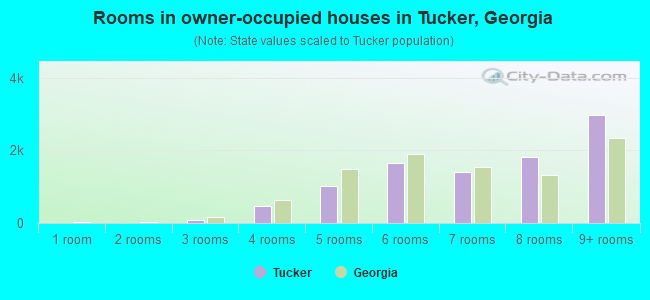
Median number of rooms in houses and condos
Median number of rooms in apartments
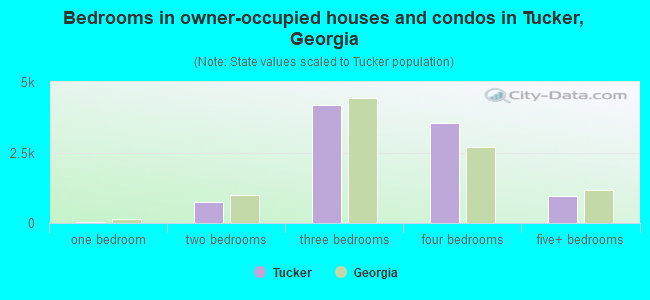
Median number of bedrooms in owner occupied houses
Mean number of bedrooms in owner occupied houses
Median number of bedrooms in renter occupied houses
Mean number of bedrooms in renter occupied houses
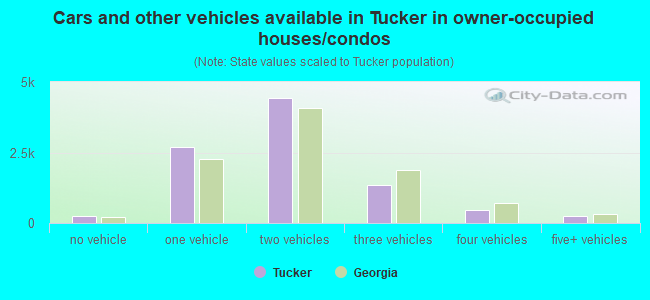
Median number of vehichles in owner occupied houses
Mean number of vehichles in owner occupied houses
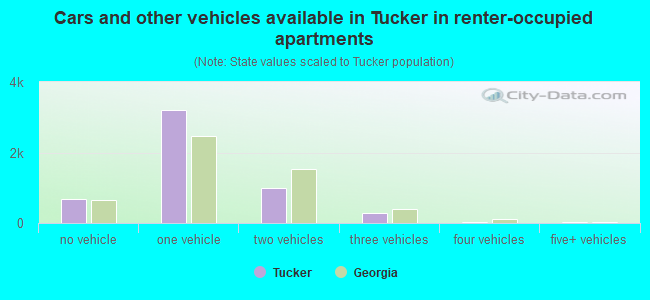
Median number of vehichles in renter occupied houses
Mean number of vehichles in renter occupied houses
Rooms in owner-occupied houses - 1 room (%)
Rooms in owner-occupied houses - 2 rooms (%)
Rooms in owner-occupied houses - 3 rooms (%)
Rooms in owner-occupied houses - 4 rooms (%)
Rooms in owner-occupied houses - 5 rooms (%)
Rooms in owner-occupied houses - 6 rooms (%)
Rooms in owner-occupied houses - 7 rooms (%)
Rooms in owner-occupied houses - 8 rooms (%)
Rooms in owner-occupied houses - 9+ rooms (%)
Rooms in renter-occupied houses - 1 room (%)
Rooms in renter-occupied houses - 2 rooms (%)
Rooms in renter-occupied houses - 3 rooms (%)
Rooms in renter-occupied houses - 4 rooms (%)
Rooms in renter-occupied houses - 5 rooms (%)
Rooms in renter-occupied houses - 6 rooms (%)
Rooms in renter-occupied houses - 7 rooms (%)
Rooms in renter-occupied houses - 8 rooms (%)
Rooms in renter-occupied houses - 9+ rooms (%)
Bedrooms in owner-occupied houses - no bedrooms (%)
Bedrooms in owner-occupied houses - 1 bedroom (%)
Bedrooms in owner-occupied houses - 2 bedrooms (%)
Bedrooms in owner-occupied houses - 3 bedrooms (%)
Bedrooms in owner-occupied houses - 4 bedrooms (%)
Bedrooms in owner-occupied houses - 5+ bedrooms (%)
Bedrooms in renter-occupied houses - no bedrooms (%)
Bedrooms in renter-occupied houses - 1 bedroom (%)
Bedrooms in renter-occupied houses - 2 bedrooms (%)
Bedrooms in renter-occupied houses - 3 bedrooms (%)
Bedrooms in renter-occupied houses - 4 bedrooms (%)
Bedrooms in renter-occupied houses - 5+ bedrooms (%)
Vehicles available in owner-occupied houses - no vehicle available (%)
Vehicles available in owner-occupied houses - 1 vehicle available(%)
Vehicles available in owner-occupied houses - 2 Vehicles available (%)
Vehicles available in owner-occupied houses - 3 Vehicles available (%)
Vehicles available in owner-occupied houses - 4 Vehicles available (%)
Vehicles available in owner-occupied houses - 5+ Vehicles available (%)
Vehicles available in renter-occupied houses - no vehicle available (%)
Vehicles available in renter-occupied houses - 1 vehicle available (%)
Vehicles available in renter-occupied houses - 2 Vehicles available (%)
Vehicles available in renter-occupied houses - 3 Vehicles available (%)
Vehicles available in renter-occupied houses - 4 Vehicles available (%)
Vehicles available in renter-occupied houses - 5+ Vehicles available (%)
Housing units in structures - 1, detached (%)
Housing units in structures - 1, attached (%)
Housing units in structures - 2 (%)
Housing units in structures - 3 or 4 (%)
Housing units in structures - 5 to 9 (%)
Housing units in structures - 10 to 19 (%)
Housing units in structures - 20 to 49 (%)
Housing units in structures - 50 or more (%)
Housing units in structures - Mobile home (%)
Housing units in structures - Boat, RV, van, etc. (%)
Housing units in structures - Owners - 1, detached (%)
Housing units in structures - Owners - 1, attached (%)
Housing units in structures - Owners - 2 (%)
Housing units in structures - Owners - 3 or 4 (%)
Housing units in structures - Owners - 5 to 9 (%)
Housing units in structures - Owners - 10 to 19 (%)
Housing units in structures - Owners - 20 to 49 (%)
Housing units in structures - Owners - 50 or more (%)
Housing units in structures - Owners - Mobile home (%)
Housing units in structures - Owners - Boat, RV, van, etc. (%)
Housing units in structures - Renters - 1, detached (%)
Housing units in structures - Renters - 1, attached (%)
Housing units in structures - Renters - 2 (%)
Housing units in structures - Renters - 3 or 4 (%)
Housing units in structures - Renters - 5 to 9 (%)
Housing units in structures - Renters - 10 to 19 (%)
Housing units in structures - Renters - 20 to 49 (%)
Housing units in structures - Renters - 50 or more (%)
Housing units in structures - Renters - Mobile home (%)
Housing units in structures - Renters - Boat, RV, van, etc. (%)
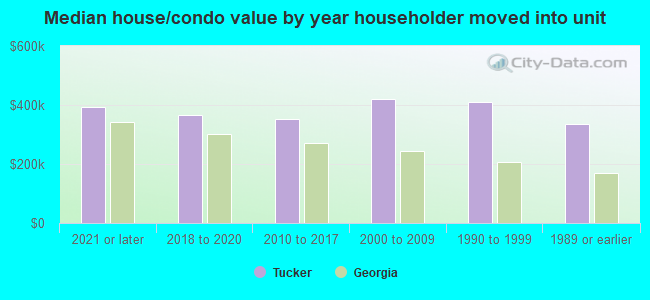
House/condo owner moved in on average (years ago)
Renter moved in on average (years ago)
Year householder moved into unit - Moved in 1999 to March 2000 (%)
Year householder moved into unit - Moved in 1999 to March 2000 (%) - White
Year householder moved into unit - Moved in 1999 to March 2000 (%) - Black or African American
Year householder moved into unit - Moved in 1999 to March 2000 (%) - Asian
Year householder moved into unit - Moved in 1999 to March 2000 (%) - Hispanic or Latino
Year householder moved into unit - Moved in 1999 to March 2000 (%) - American Indian and Alaska Native
Year householder moved into unit - Moved in 1999 to March 2000 (%) - Multirace
Year householder moved into unit - Moved in 1999 to March 2000 (%) - Other Race
Year householder moved into unit - Moved in 1995 to 1998 (%)
Year householder moved into unit - Moved in 1995 to 1998 (%) - White
Year householder moved into unit - Moved in 1995 to 1998 (%) - Black or African American
Year householder moved into unit - Moved in 1995 to 1998 (%) - Asian
Year householder moved into unit - Moved in 1995 to 1998 (%) - Hispanic or Latino
Year householder moved into unit - Moved in 1995 to 1998 (%) - American Indian and Alaska Native
Year householder moved into unit - Moved in 1995 to 1998 (%) - Multirace
Year householder moved into unit - Moved in 1995 to 1998 (%) - Other Race
Year householder moved into unit - Moved in 1990 to 1994 (%)
Year householder moved into unit - Moved in 1990 to 1994 (%) - White
Year householder moved into unit - Moved in 1990 to 1994 (%) - Black or African American
Year householder moved into unit - Moved in 1990 to 1994 (%) - Asian
Year householder moved into unit - Moved in 1990 to 1994 (%) - Hispanic or Latino
Year householder moved into unit - Moved in 1990 to 1994 (%) - American Indian and Alaska Native
Year householder moved into unit - Moved in 1990 to 1994 (%) - Multirace
Year householder moved into unit - Moved in 1990 to 1994 (%) - Other Race
Year householder moved into unit - Moved in 1980 to 1989 (%)
Year householder moved into unit - Moved in 1980 to 1989 (%) - White
Year householder moved into unit - Moved in 1980 to 1989 (%) - Black or African American
Year householder moved into unit - Moved in 1980 to 1989 (%) - Asian
Year householder moved into unit - Moved in 1980 to 1989 (%) - Hispanic or Latino
Year householder moved into unit - Moved in 1980 to 1989 (%) - American Indian and Alaska Native
Year householder moved into unit - Moved in 1980 to 1989 (%) - Multirace
Year householder moved into unit - Moved in 1980 to 1989 (%) - Other Race
Year householder moved into unit - Moved in 1970 to 1979 (%)
Year householder moved into unit - Moved in 1970 to 1979 (%) - White
Year householder moved into unit - Moved in 1970 to 1979 (%) - Black or African American
Year householder moved into unit - Moved in 1970 to 1979 (%) - Asian
Year householder moved into unit - Moved in 1970 to 1979 (%) - Hispanic or Latino
Year householder moved into unit - Moved in 1970 to 1979 (%) - American Indian and Alaska Native
Year householder moved into unit - Moved in 1970 to 1979 (%) - Multirace
Year householder moved into unit - Moved in 1970 to 1979 (%) - Other Race
Year householder moved into unit - Moved in 1969 or earlier (%)
Year householder moved into unit - Moved in 1969 or earlier (%) - White
Year householder moved into unit - Moved in 1969 or earlier (%) - Black or African American
Year householder moved into unit - Moved in 1969 or earlier (%) - Asian
Year householder moved into unit - Moved in 1969 or earlier (%) - Hispanic or Latino
Year householder moved into unit - Moved in 1969 or earlier (%) - American Indian and Alaska Native
Year householder moved into unit - Moved in 1969 or earlier (%) - Multirace
Year householder moved into unit - Moved in 1969 or earlier (%) - Other Race
Housing units lacking complete plumbing facilities (%)
Housing units lacking complete kitchen facilities (%)
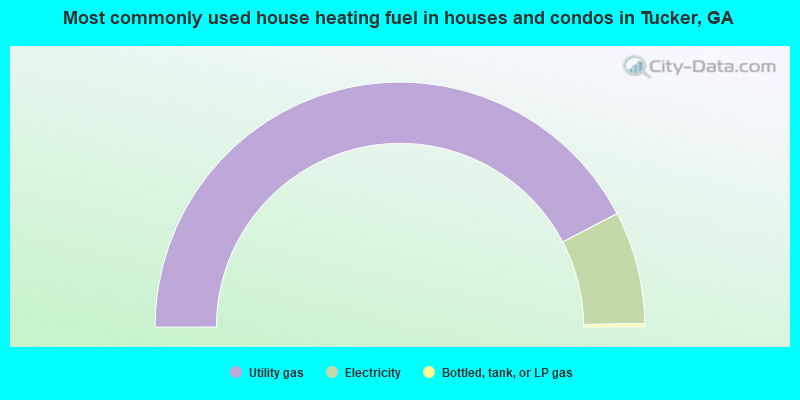
House heating fuel used in houses and condos - Utility gas (%)
House heating fuel used in houses and condos - Bottled, tank, or LP gas (%)
House heating fuel used in houses and condos - Electricity (%)
House heating fuel used in houses and condos - Fuel oil, kerosene, etc. (%)
House heating fuel used in houses and condos - Coal or coke (%)
House heating fuel used in houses and condos - Wood (%)
House heating fuel used in houses and condos - Solar energy (%)
House heating fuel used in houses and condos - Other fuel (%)
House heating fuel used in houses and condos - No fuel used (%)
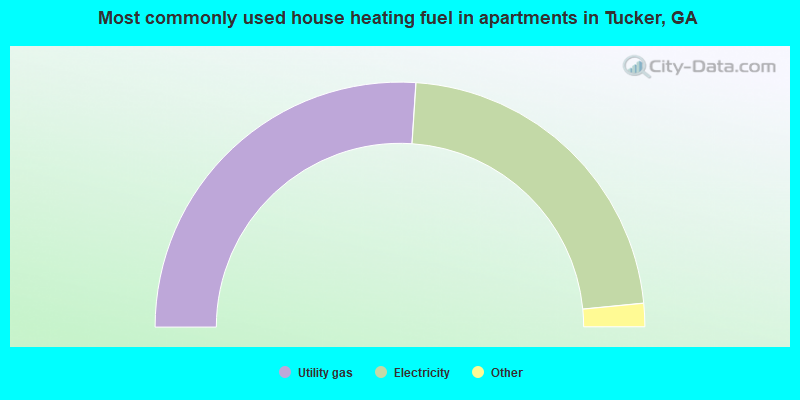
House heating fuel used in apartments - Utility gas (%)
House heating fuel used in apartments - Bottled, tank, or LP gas (%)
House heating fuel used in apartments - Electricity (%)
House heating fuel used in apartments - Fuel oil, kerosene, etc. (%)
House heating fuel used in apartments - Coal or coke (%)
House heating fuel used in apartments - Wood (%)
House heating fuel used in apartments - Solar energy (%)
House heating fuel used in apartments - Other fuel (%)
House heating fuel used in apartments - No fuel used (%)
Latest news about housing in Tucker, GA collected exclusively by city-data.com from local newspapers, TV, and radio stations
Median year house/condo built: 1975Median year apartment built: 1985Household type by relationship:
Households: 37,072
Male householders: 6,770 (1,976 living alone ), Female householders: 8,167 (2,867 living alone )6,023 spouses (5,695 opposite-sex spouses ), 1,170 unmarried partners , (884 opposite-sex unmarried partners ), 9,370 children (8,703 natural , 222 adopted , 444 stepchildren ), 678 grandchildren , 1,089 brothers or sisters , 981 parents , 0 foster children , 1,196 other relatives , 1,119 non-relatives In group quarters: 505
Size of family households: 4,802 2-persons , 2,117 3-persons , 1,071 4-persons , 449 5-persons , 237 6-persons , 202 7-or-more-persons .
Size of nonfamily households: 4,505 1-person , 1,084 2-persons , 196 3-persons , 21 5-persons .
3,629 married couples with children. single-parent households (210 men , 2,085 women ).
79.3% of residents of Tucker speak English at home. of residents speak Spanish at home (53% speak English very well , 21% speak English well , 20% speak English not well , 7% don't speak English at all ).of residents speak other Indo-European language at home (58% speak English very well , 34% speak English well , 3% speak English not well , 5% don't speak English at all ).of residents speak Asian or Pacific Island language at home (42% speak English very well , 33% speak English well , 5% speak English not well , 20% don't speak English at all ).of residents speak other language at home (64% speak English very well , 27% speak English well , 7% speak English not well , 1% don't speak English at all ).
Foreign born population: 5,924 (16.0%)of them are naturalized citizens )
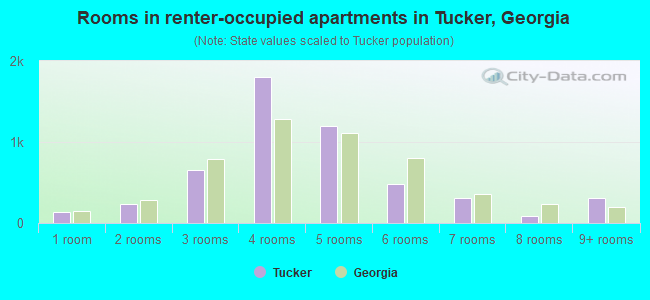
Median number of rooms in houses and condos:
Median number of rooms in apartments
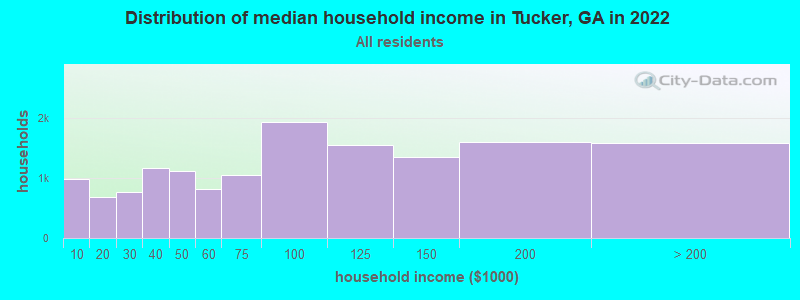
Tucker, GA household income distribution 983 Less than $10,000684 $10,000 to $19,999772 $20,000 to $29,9991,168 $30,000 to $39,9991,128 $40,000 to $49,999812 $50,000 to $59,9991,052 $60,000 to $74,9991,939 $75,000 to $99,9991,558 $100,000 to $124,9991,356 $125,000 to $149,9991,600 $150,000 to $199,9991,593 $200,000 or more
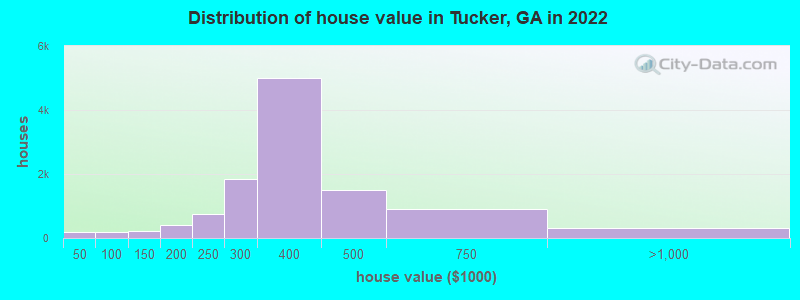
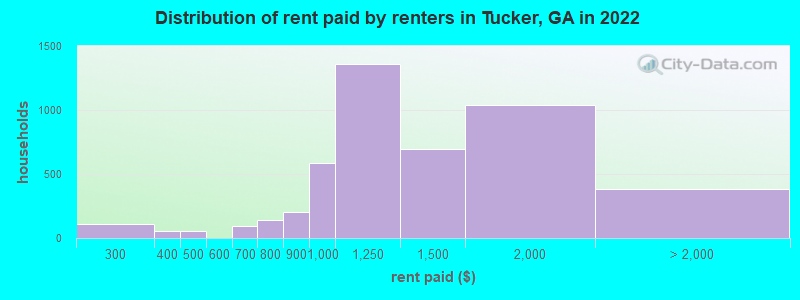
Home value of owner - occupied houses in 2022 in Tucker, GA 46 Less than $10,00057 $30,000 to $34,99994 $40,000 to $49,9993 $50,000 to $59,99918 $60,000 to $69,99960 $70,000 to $79,99917 $90,000 to $99,999162 $100,000 to $124,99960 $125,000 to $149,999137 $150,000 to $174,999257 $175,000 to $199,999734 $200,000 to $249,9991,830 $250,000 to $299,9995,014 $300,000 to $399,9991,511 $400,000 to $499,999909 $500,000 to $749,999266 $750,000 to $999,99917 $1,000,000 to $1,499,99940 $2,000,000 or moreRent paid by renters in 2022 in Tucker, GA 64 $200 to $24941 $250 to $29954 $350 to $39931 $400 to $44923 $450 to $4999 $600 to $64986 $650 to $6998 $700 to $749131 $750 to $799202 $800 to $899582 $900 to $9991,363 $1,000 to $1,249699 $1,250 to $1,4991,040 $1,500 to $1,999221 $2,000 to $2,49940 $2,500 to $2,99920 $3,000 to $3,49999 No cash rent
Percentage of workers working in this county: 61.3%Number of people working at home: 4,677 (26.4% of all workers )
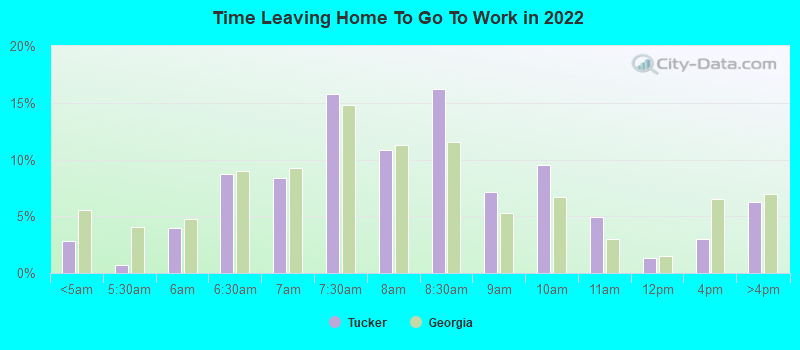
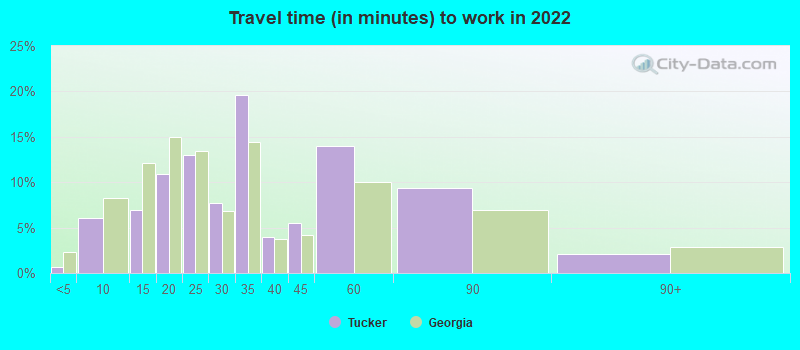
Travel time to work (commute)
Less than 5 minutes: 1475 to 9 minutes: 69710 to 14 minutes: 1,33915 to 19 minutes: 1,63220 to 24 minutes: 1,56225 to 29 minutes: 76030 to 34 minutes: 2,72035 to 39 minutes: 72740 to 44 minutes: 79945 to 59 minutes: 1,83860 to 89 minutes: 66390 or more minutes: 348
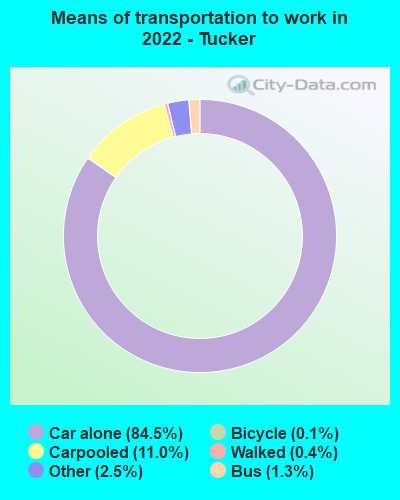
Means of transportation to work:
Drove a car alone: 23,849 (71.1%)Carpooled: 2,792 (8.3%)Bus : 309 (0.9%)Subway or elevated rail : 12 (0.0%)Long-distance train or commuter rail : 11 (0.0%)Taxi: 602 (1.8%)Bicycle: 54 (0.2%)Walked: 143 (0.4%)Worked at home: 4,677 (13.9%)
Unemployment by race in 2022
Unemployment rate for White non-Hispanic residents 2.9% Males2.3% FemalesUnemployment rate for Black residents 5.5% Males5.8% FemalesUnemployment rate for Asian residents 1.9% Males7.4% FemalesUnemployment rate for other race residents 2.0% Males4.0% FemalesUnemployment rate for two or more race residents 13.3% Males15.7% FemalesUnemployment rate for Hispanic or Latino residents 3.2% Males2.4% Females
Year of entry for the foreign-born population in Tucker, Georgia
1,796 2010 or later 1,739 2000 to 2009 1,110 1990 to 1999 1,139 1980 to 1989 447 1970 to 1979 332 Before 1970
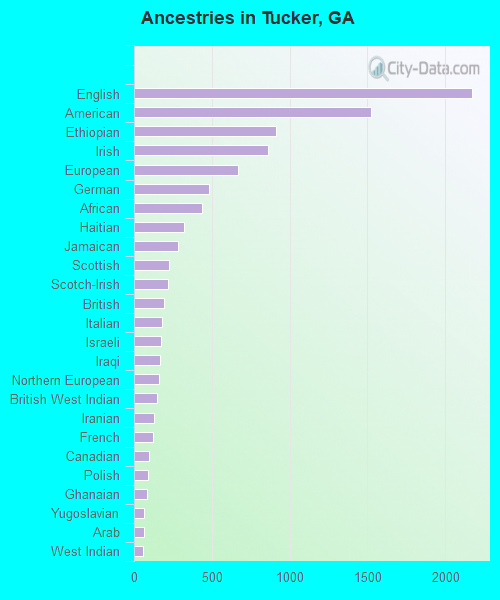
First ancestries reported:
English: 2,173 (9.5%)
American: 1,521 (6.7%)
Ethiopian: 910 (4.0%)
Irish: 860 (3.8%)
European: 668 (2.9%)
German: 483 (2.1%)
African: 437 (1.9%)
Haitian: 321 (1.4%)
Jamaican: 286 (1.3%)
Scottish: 228 (1.0%)
Scotch-Irish: 217 (1.0%)
British: 194 (0.9%)
Italian: 183 (0.8%)
Israeli: 173 (0.8%)
Iraqi: 167 (0.7%)
Northern European: 160 (0.7%)
British West Indian: 146 (0.6%)
Iranian: 131 (0.6%)
French: 125 (0.5%)
Canadian: 99 (0.4%)
Polish: 87 (0.4%)
Ghanaian: 81 (0.4%)
Yugoslavian: 65 (0.3%)
Arab: 63 (0.3%)
West Indian: 55 (0.2%)
Swedish: 52 (0.2%)
Turkish: 45 (0.2%)
Lebanese: 44 (0.2%)
Egyptian: 31 (0.1%)
Welsh: 26 (0.1%)
Guyanese: 21 (0.09%)
Russian: 17 (0.07%)
Romanian: 16 (0.07%)
Brazilian: 16 (0.07%)
Lithuanian: 15 (0.07%)
Bahamian: 13 (0.06%)
Palestinian: 12 (0.05%)
Eastern European: 11 (0.05%)
Hungarian: 9 (0.04%)
Swiss: 8 (0.04%)
Greek: 7 (0.03%)
Scandinavian: 5 (0.02%)
Croatian: 4 (0.02%)
French Canadian: 3 (0.01%)
Ugandan: 3 (0.01%) Most common places of birth for foreign-born residents (%): Ethiopia Tucker:
13.3% (847)Georgia:
1.6% (17,643)
Burma (Myanmar) Tucker:
9.0% (576)Georgia:
0.5% (5,046)
Mexico Tucker:
7.6% (485)Georgia:
20.0% (223,400)
India Tucker:
7.4% (473)Georgia:
9.2% (103,325)
Guatemala Tucker:
5.4% (345)Georgia:
3.6% (39,974)
Haiti Tucker:
4.8% (307)Georgia:
1.6% (17,476)
Jamaica Tucker:
4.3% (272)Georgia:
4.6% (51,270)
El Salvador Tucker:
4.3% (271)Georgia:
2.5% (27,794)
Cuba Tucker:
3.2% (201)Georgia:
1.2% (12,946)
Philippines Tucker:
2.5% (160)Georgia:
1.8% (20,700)
Romania Tucker:
2.5% (158)Georgia:
0.6% (6,388)
Bosnia and Herzegovina Tucker:
2.3% (147)Georgia:
0.4% (4,775)
Korea Tucker:
2.2% (139)Georgia:
3.9% (43,756)
Iran Tucker:
2.1% (134)Georgia:
0.6% (6,717)
Other Caribbean Tucker:
2.0% (129)Georgia:
0.4% (4,066)
China, excluding Hong Kong and Taiwan Tucker:
2.0% (127)Georgia:
3.5% (39,227)
Venezuela Tucker:
1.8% (115)Georgia:
1.7% (19,012)
Dominican Republic Tucker:
1.7% (110)Georgia:
1.1% (11,847)
Iraq Tucker:
1.7% (106)Georgia:
0.4% (3,921)
Pakistan Tucker:
1.6% (104)Georgia:
1.1% (12,223)
Other Eastern Africa Tucker:
1.5% (97)Georgia:
0.3% (3,330)
Place of birth for U.S.-born residents:
This state: 15,697Other state: 14,900Northeast: 2,991Midwest: 2,727South: 7,903West: 1,253 86.6% of Tucker residents lived in the same house 1 years ago.
Out of people who lived in different houses, 30.5% lived in this county.
Out of people who lived in different counties, 63.0% lived in Georgia.
Tucker:
86.6%State average:
86.6%
Education attainment for males 25 years and older:
No schooling: 387Nursery to 4th grade: 595th and 6th grade: 447th and 8th grade: 539th grade: 010th grade: 11511th grade: 9712th grade, no diploma: 265High school graduate (or equivalency): 2,758Less than 1 year of college: 519Some college more than 1 year, no degree: 1,522Associate degree: 798Bachelor's degree: 3,647Master's degree: 1,208Professional school degree: 400Doctorate degree: 445
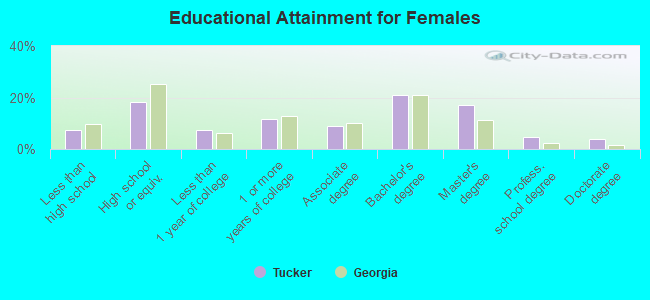
Education attainment for females 25 years and older:
No schooling: 337Nursery to 4th grade: 785th and 6th grade: 367th and 8th grade: 859th grade: 4210th grade: 14111th grade: 5212th grade, no diploma: 349High school graduate (or equivalency): 2,817Less than 1 year of college: 1,151Some college more than 1 year, no degree: 1,803Associate degree: 1,367Bachelor's degree: 3,264Master's degree: 2,609Professional school degree: 718Doctorate degree: 585
Housing units in structures:
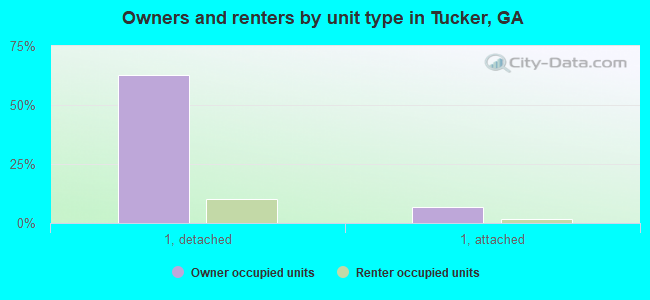
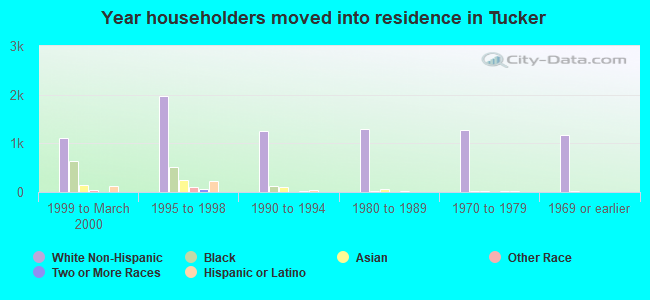
One, detached: 10,196One, attached: 1,585Two: 2533 or 4: 6325 to 9: 1,22810 to 19: 1,74120 to 49: 78850 or more: 417Mobile homes: 89Boats, RVs, vans, etc.: 9Housing units lacking complete plumbing facilities in 2022: 0.5%Housing units lacking complete kitchen facilities in 2022: 1.5%House/condo owner moved in on average 12 years ago
Renter moved in on average 2 years ago
Private vs. public school enrollment:
Students in private schools in grades 1 to 8 (elementary and middle school): 501 Students in private schools in grades 9 to 12 (high school): 154 Students in private undergraduate colleges: 181