Races in Tucker, Georgia (GA) Detailed Stats
Data:
Races - White alone (%)
Races - White alone (% change since 2000)
Races - Black alone (%)
Races - Black alone (% change since 2000)
Races - American Indian alone (%)
Races - American Indian alone (% change since 2000)
Races - Asian alone (%)
Races - Asian alone (% change since 2000)
Races - Hispanic (%)
Races - Hispanic (% change since 2000)
Races - Native Hawaiian and Other Pacific Islander alone (%)
Races - Native Hawaiian and Other Pacific Islander alone (% change since 2000)
Races - Two or more races(%)
Races - Two or more races(% change since 2000)
Races - Other race alone (%)
Races - Other race alone (% change since 2000)
Racial diversity
Place of birth - Born in state of residence (%)
Place of birth - Born in state of residence (%) - White
Place of birth - Born in state of residence (%) - Black or African American
Place of birth - Born in state of residence (%) - Asian
Place of birth - Born in state of residence (%) - Hispanic or Latino
Place of birth - Born in state of residence (%) - American Indian and Alaska Native
Place of birth - Born in state of residence (%) - Multirace
Place of birth - Born in state of residence (%) - Other Race
Place of birth - Born in other state (%)
Place of birth - Born in other state (%) - White
Place of birth - Born in other state (%) - Black or African American
Place of birth - Born in other state (%) - Asian
Place of birth - Born in other state (%) - Hispanic or Latino
Place of birth - Born in other state (%) - American Indian and Alaska Native
Place of birth - Born in other state (%) - Multirace
Place of birth - Born in other state (%) - Other Race
Place of birth - Native, outside of US (%)
Place of birth - Native, outside of US (%) - White
Place of birth - Native, outside of US (%) - Black or African American
Place of birth - Native, outside of US (%) - Asian
Place of birth - Native, outside of US (%) - Hispanic or Latino
Place of birth - Native, outside of US (%) - American Indian and Alaska Native
Place of birth - Native, outside of US (%) - Multirace
Place of birth - Native, outside of US (%) - Other Race
Place of birth - Foreign born (%)
Place of birth - Foreign born (%) - White
Place of birth - Foreign born (%) - Black or African American
Place of birth - Foreign born (%) - Asian
Place of birth - Foreign born (%) - Hispanic or Latino
Place of birth - Foreign born (%) - American Indian and Alaska Native
Place of birth - Foreign born (%) - Multirace
Place of birth - Foreign born (%) - Other Race
Residents speaking English at home (%)
Residents speaking English at home - Born in the United States (%)
Residents speaking English at home - Native, born elsewhere (%)
Residents speaking English at home - Foreign born (%)
Residents speaking Spanish at home (%)
Residents speaking Spanish at home - Born in the United States (%)
Residents speaking Spanish at home - Native, born elsewhere (%)
Residents speaking Spanish at home - Foreign born (%)
Residents speaking other language at home (%)
Residents speaking other language at home - Born in the United States (%)
Residents speaking other language at home - Native, born elsewhere (%)
Residents speaking other language at home - Foreign born (%)
Marital status - Never married (%)
Marital status - Now married (%)
Marital status - Separated (%)
Marital status - Widowed (%)
Marital status - Divorced (%)
Ancestries Reported - Arab (%)
Ancestries Reported - Czech (%)
Ancestries Reported - Danish (%)
Ancestries Reported - Dutch (%)
Ancestries Reported - English (%)
Ancestries Reported - French (%)
Ancestries Reported - French Canadian (%)
Ancestries Reported - German (%)
Ancestries Reported - Greek (%)
Ancestries Reported - Hungarian (%)
Ancestries Reported - Irish (%)
Ancestries Reported - Italian (%)
Ancestries Reported - Lithuanian (%)
Ancestries Reported - Norwegian (%)
Ancestries Reported - Polish (%)
Ancestries Reported - Portuguese (%)
Ancestries Reported - Russian (%)
Ancestries Reported - Scotch-Irish (%)
Ancestries Reported - Scottish (%)
Ancestries Reported - Slovak (%)
Ancestries Reported - Subsaharan African (%)
Ancestries Reported - Swedish (%)
Ancestries Reported - Swiss (%)
Ancestries Reported - Ukrainian (%)
Ancestries Reported - United States (%)
Ancestries Reported - Welsh (%)
Ancestries Reported - West Indian (%)
Ancestries Reported - Other (%)
Geographical mobility - Same house 1 year ago (%)
Geographical mobility - Same house 1 year ago (%) - White
Geographical mobility - Same house 1 year ago (%) - Black or African American
Geographical mobility - Same house 1 year ago (%) - Asian
Geographical mobility - Same house 1 year ago (%) - Hispanic or Latino
Geographical mobility - Same house 1 year ago (%) - American Indian and Alaska Native
Geographical mobility - Same house 1 year ago (%) - Multirace
Geographical mobility - Same house 1 year ago (%) - Other Race
Geographical mobility - Moved within same county (%)
Geographical mobility - Moved within same county (%) - White
Geographical mobility - Moved within same county (%) - Black or African American
Geographical mobility - Moved within same county (%) - Asian
Geographical mobility - Moved within same county (%) - Hispanic or Latino
Geographical mobility - Moved within same county (%) - American Indian and Alaska Native
Geographical mobility - Moved within same county (%) - Multirace
Geographical mobility - Moved within same county (%) - Other Race
Geographical mobility - Moved from different county within same state (%)
Geographical mobility - Moved from different county within same state (%) - White
Geographical mobility - Moved from different county within same state (%) - Black or African American
Geographical mobility - Moved from different county within same state (%) - Asian
Geographical mobility - Moved from different county within same state (%) - Hispanic or Latino
Geographical mobility - Moved from different county within same state (%) - American Indian and Alaska Native
Geographical mobility - Moved from different county within same state (%) - Multirace
Geographical mobility - Moved from different county within same state (%) - Other Race
Geographical mobility - Moved from different state (%)
Geographical mobility - Moved from different state (%) - White
Geographical mobility - Moved from different state (%) - Black or African American
Geographical mobility - Moved from different state (%) - Asian
Geographical mobility - Moved from different state (%) - Hispanic or Latino
Geographical mobility - Moved from different state (%) - American Indian and Alaska Native
Geographical mobility - Moved from different state (%) - Multirace
Geographical mobility - Moved from different state (%) - Other Race
Geographical mobility - Moved from abroad (%)
Geographical mobility - Moved from abroad (%) - White
Geographical mobility - Moved from abroad (%) - Black or African American
Geographical mobility - Moved from abroad (%) - Asian
Geographical mobility - Moved from abroad (%) - Hispanic or Latino
Geographical mobility - Moved from abroad (%) - American Indian and Alaska Native
Geographical mobility - Moved from abroad (%) - Multirace
Geographical mobility - Moved from abroad (%) - Other Race
Place of birth for the foreign-born population - Ireland (%)
Place of birth for the foreign-born population - Denmark (%)
Place of birth for the foreign-born population - Norway (%)
Place of birth for the foreign-born population - Sweden (%)
Place of birth for the foreign-born population - United Kingdom (%)
Place of birth for the foreign-born population - England (%)
Place of birth for the foreign-born population - Scotland (%)
Place of birth for the foreign-born population - Other Northern Europe (%)
Place of birth for the foreign-born population - Austria (%)
Place of birth for the foreign-born population - Belgium (%)
Place of birth for the foreign-born population - France (%)
Place of birth for the foreign-born population - Germany (%)
Place of birth for the foreign-born population - Netherlands (%)
Place of birth for the foreign-born population - Switzerland (%)
Place of birth for the foreign-born population - Other Western Europe (%)
Place of birth for the foreign-born population - Greece (%)
Place of birth for the foreign-born population - Italy (%)
Place of birth for the foreign-born population - Portugal (%)
Place of birth for the foreign-born population - Spain (%)
Place of birth for the foreign-born population - Other Southern Europe (%)
Place of birth for the foreign-born population - Albania (%)
Place of birth for the foreign-born population - Belarus (%)
Place of birth for the foreign-born population - Bosnia and Herzegovina (%)
Place of birth for the foreign-born population - Bulgaria (%)
Place of birth for the foreign-born population - Croatia (%)
Place of birth for the foreign-born population - Czechoslovakia (%)
Place of birth for the foreign-born population - Hungary (%)
Place of birth for the foreign-born population - Latvia (%)
Place of birth for the foreign-born population - Lithuania (%)
Place of birth for the foreign-born population - North Macedonia (Macedonia) (%)
Place of birth for the foreign-born population - Moldova (%)
Place of birth for the foreign-born population - Poland (%)
Place of birth for the foreign-born population - Romania (%)
Place of birth for the foreign-born population - Russia (%)
Place of birth for the foreign-born population - Serbia (%)
Place of birth for the foreign-born population - Ukraine (%)
Place of birth for the foreign-born population - Other Eastern Europe (%)
Place of birth for the foreign-born population - China (%)
Place of birth for the foreign-born population - Hong Kong (%)
Place of birth for the foreign-born population - Taiwan (%)
Place of birth for the foreign-born population - Japan (%)
Place of birth for the foreign-born population - Korea (%)
Place of birth for the foreign-born population - Other Eastern Asia (%)
Place of birth for the foreign-born population - Afghanistan (%)
Place of birth for the foreign-born population - Bangladesh (%)
Place of birth for the foreign-born population - India (%)
Place of birth for the foreign-born population - Iran (%)
Place of birth for the foreign-born population - Kazakhstan (%)
Place of birth for the foreign-born population - Nepal (%)
Place of birth for the foreign-born population - Pakistan (%)
Place of birth for the foreign-born population - Sri Lanka (%)
Place of birth for the foreign-born population - Uzbekistan (%)
Place of birth for the foreign-born population - Other South Central Asia (%)
Place of birth for the foreign-born population - Burma (%)
Place of birth for the foreign-born population - Cambodia (%)
Place of birth for the foreign-born population - Indonesia (%)
Place of birth for the foreign-born population - Laos (%)
Place of birth for the foreign-born population - Malaysia (%)
Place of birth for the foreign-born population - Philippines (%)
Place of birth for the foreign-born population - Singapore (%)
Place of birth for the foreign-born population - Thailand (%)
Place of birth for the foreign-born population - Vietnam (%)
Place of birth for the foreign-born population - Other South Eastern Asia (%)
Place of birth for the foreign-born population - Armenia (%)
Place of birth for the foreign-born population - Iraq (%)
Place of birth for the foreign-born population - Israel (%)
Place of birth for the foreign-born population - Jordan (%)
Place of birth for the foreign-born population - Kuwait (%)
Place of birth for the foreign-born population - Lebanon (%)
Place of birth for the foreign-born population - Saudi Arabia (%)
Place of birth for the foreign-born population - Syria (%)
Place of birth for the foreign-born population - Turkey (%)
Place of birth for the foreign-born population - Yemen (%)
Place of birth for the foreign-born population - Other Western Asia (%)
Place of birth for the foreign-born population - Eritrea (%)
Place of birth for the foreign-born population - Ethiopia (%)
Place of birth for the foreign-born population - Kenya (%)
Place of birth for the foreign-born population - Somalia (%)
Place of birth for the foreign-born population - Uganda (%)
Place of birth for the foreign-born population - Zimbabwe (%)
Place of birth for the foreign-born population - Other Eastern Africa (%)
Place of birth for the foreign-born population - Cameroon (%)
Place of birth for the foreign-born population - Congo (%)
Place of birth for the foreign-born population - Democratic Republic of Congo (Zaire) (%)
Place of birth for the foreign-born population - Other Middle Africa (%)
Place of birth for the foreign-born population - Egypt (%)
Place of birth for the foreign-born population - Morocco (%)
Place of birth for the foreign-born population - Sudan (%)
Place of birth for the foreign-born population - Other Northern Africa (%)
Place of birth for the foreign-born population - South Africa (%)
Place of birth for the foreign-born population - Other Southern Africa (%)
Place of birth for the foreign-born population - Cabo Verde (%)
Place of birth for the foreign-born population - Ghana (%)
Place of birth for the foreign-born population - Liberia (%)
Place of birth for the foreign-born population - Nigeria (%)
Place of birth for the foreign-born population - Senegal (%)
Place of birth for the foreign-born population - Sierra Leone (%)
Place of birth for the foreign-born population - Other Western Africa (%)
Place of birth for the foreign-born population - Australia (%)
Place of birth for the foreign-born population - New Zealand (%)
Place of birth for the foreign-born population - Fiji (%)
Place of birth for the foreign-born population - Micronesia (%)
Place of birth for the foreign-born population - Bahamas (%)
Place of birth for the foreign-born population - Barbados (%)
Place of birth for the foreign-born population - Cuba (%)
Place of birth for the foreign-born population - Dominica (%)
Place of birth for the foreign-born population - Dominican Republic (%)
Place of birth for the foreign-born population - Grenada (%)
Place of birth for the foreign-born population - Haiti (%)
Place of birth for the foreign-born population - Jamaica (%)
Place of birth for the foreign-born population - St. Vincent and the Grenadines (%)
Place of birth for the foreign-born population - Trinidad and Tobago (%)
Place of birth for the foreign-born population - West Indies (%)
Place of birth for the foreign-born population - Other Caribbean (%)
Place of birth for the foreign-born population - Belize (%)
Place of birth for the foreign-born population - Costa Rica (%)
Place of birth for the foreign-born population - El Salvador (%)
Place of birth for the foreign-born population - Guatemala (%)
Place of birth for the foreign-born population - Honduras (%)
Place of birth for the foreign-born population - Mexico (%)
Place of birth for the foreign-born population - Nicaragua (%)
Place of birth for the foreign-born population - Panama (%)
Place of birth for the foreign-born population - Other Central America (%)
Place of birth for the foreign-born population - Argentina (%)
Place of birth for the foreign-born population - Bolivia (%)
Place of birth for the foreign-born population - Brazil (%)
Place of birth for the foreign-born population - Chile (%)
Place of birth for the foreign-born population - Colombia (%)
Place of birth for the foreign-born population - Ecuador (%)
Place of birth for the foreign-born population - Guyana (%)
Place of birth for the foreign-born population - Peru (%)
Place of birth for the foreign-born population - Uruguay (%)
Place of birth for the foreign-born population - Venezuela (%)
Place of birth for the foreign-born population - Other South America (%)
Place of birth for the foreign-born population - Canada (%)
Place of birth for the foreign-born population - Other Northern America (%)
Place of birth for the foreign-born population - Other (%)
Latest news about races in Tucker, GA collected exclusively by city-data.com from local newspapers, TV, and radio stations
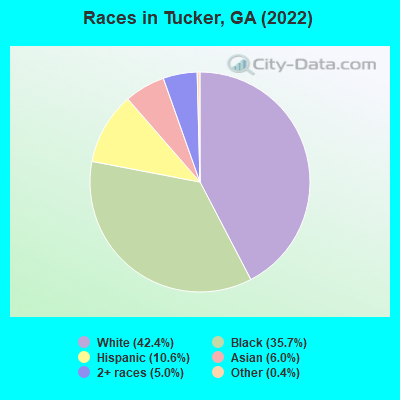
According to 2022 data, the most numerous races in Tucker, GA are White alone (15,735 residents), Black alone (13,234 residents), and Hispanic (3,946 residents). 78.9% of Tucker residents speak English at home. 17.2% of Tucker, GA residents are foreign-born (5.9% born in Latin America, 5.8% born in Asia, 3.3% born in Africa), which is 41.8% greater than the foreign-born rate of 10.0% across the entire state of Georgia.
Race distribution in Tucker
2000 2022
5,128,661 62.6% White alone 2,331,465 28.5% Black alone 435,227 5.3% Hispanic 171,513 2.1% Asian alone 87,364 1.1% Two or more races 17,670 0.2% American Indian alone 11,275 0.1% Other race alone 3,278 0.04% Native Hawaiian and Other
5,415,657 49.6% White alone 3,349,240 30.7% Black alone 1,132,604 10.4% Hispanic 479,156 4.4% Asian alone 462,923 4.2% Two or more races 54,416 0.5% Other race alone 11,923 0.1% American Indian alone 6,957 0.06% Native Hawaiian and Other
Income and house value in Tucker Median household income in 2022 $98,417 White non-Hispanic householders$59,659 Black householders$98,495 Asian householders$68,950 Some other race householders$87,441 Two or more races householders$72,272 Hispanic or Latino race householdersMedian 2022 house value $393,462 White Non-Hispanic householders$340,391 Black or African American householders $366,309 Asian householders$196,237 Native Hawaiian and other Pacific Islander householders$277,694 Some other race householders$384,576 Two or more races householders$367,297 Hispanic or Latino householders
Median age by race in Tucker
52.0 Median age for White residents47.6 56.1 37.6 Median age for Black or African American residents34.5 39.4 21.3 Median age for American Indian / Alaska Native residents11.7 -565,432,098.2 50.2 Median age for Asian residents36.4 52.8 -657,243,815.6 Median age for Native Hawaiian / Pacific Islander residents-693,227,090.9 -776,776,776.0 43.0 Median age for Other race residents42.8 41.7 21.7 Median age for Two or more races residents16.3 25.4 53.9 Median age for White alone residents50.9 57.3 33.2 Median age for Hispanic or Latino residents19.5 36.4
Owner/renter occupied households by race in Tucker
House owners and renters - White residents 6,180 76.8% Owner occupied1,864 23.2% Renter occupiedHouse owners and renters - Black or African American residents 2,194 47.2% Owner occupied2,451 52.8% Renter occupiedHouse owners and renters - American Indian / Alaska Native residents 38 100.0% Owner occupiedHouse owners and renters - Asian residents 608 83.4% Owner occupied121 16.6% Renter occupiedHouse owners and renters - Other race residents 316 62.9% Owner occupied186 37.1% Renter occupiedHouse owners and renters - Two or more races residents 483 62.8% Owner occupied287 37.2% Renter occupiedHouse owners and renters - White alone residents 6,064 78.0% Owner occupied1,712 22.0% Renter occupiedHouse owners and renters - Hispanic or Latino residents 578 53.6% Owner occupied501 46.4% Renter occupied
Language usage in Tucker
English speakers - Total 78.9% of residents of Tucker speak English at home.
8.1% of residents speak Spanish at home 1,468 52.1% Speak English very well1,348 47.9% Speak English less than very well12.2% of residents speak other language at home 2,306 54.5% Speak English very well1,926 45.5% Speak English less than very well
English speakers - Born in the United States 92.2% of residents of Tucker speak English at home.
5.1% of residents speak Spanish at home 491 65.8% Speak English very well255 34.2% Speak English less than very well2.4% of residents speak other language at home 313 88.2% Speak English very well42 11.8% Speak English less than very well
English speakers - Native, born elsewhere 51.1% of residents of Tucker speak English at home.
21.6% of residents speak Spanish at home 67 65.7% Speak English very well35 34.3% Speak English less than very well36.2% of residents speak other language at home 171 100.0% Speak English very well
English speakers - Foreign-born 22.1% of residents of Tucker speak English at home.
20.8% of residents speak Spanish at home 406 32.9% Speak English very well827 67.1% Speak English less than very well52.8% of residents speak other language at home 1,364 43.6% Speak English very well1,768 56.4% Speak English less than very well
White (Caucasian) - Speak only English Native:
96.4% (14,330)Foreign-born:
38.8% (370)
White (Caucasian) - Speak another language Native:
3.7% (549)Foreign-born:
64.1% (612)
Black or African American - Speak only English Native:
94.2% (10,098)Foreign-born:
26.7% (480)
Black or African American - Speak another language Native:
6.2% (663)Foreign-born:
72.9% (1,309)
American Indian / Alaska Native - Speak another language Native:
34.1% (13)Foreign-born:
99.9% (15)
Asian - Speak only English Native:
18.2% (84)Foreign-born:
2.7% (46)
Asian - Speak another language Native:
80.2% (369)Foreign-born:
98.7% (1,676)
Other race - Speak only English Native:
24.0% (184)Foreign-born:
22.3% (242)
Other race - Speak another language Native:
80.5% (615)Foreign-born:
72.0% (782)
Two or more races - Speak only English Native:
78.3% (1,715)Foreign-born:
80.2% (107)
Two or more races - Speak another language Native:
22.2% (487)Foreign-born:
25.4% (34)
White alone - Speak only English Native:
97.8% (14,009)Foreign-born:
42.3% (354)
White alone - Speak another language Native:
2.3% (328)Foreign-born:
56.0% (470)
Hispanic or Latino - Speak only English Native:
41.4% (862)Foreign-born:
18.1% (246)
Hispanic or Latino - Speak another language Native:
59.2% (1,231)Foreign-born:
84.0% (1,145)
Foreign-born residents in Tucker 6,366 residents are foreign born (5.9% Latin America , 5.8% Asia , 3.3% Africa ).
This city:
17.2%Georgia:
10.4%
Marital status for residents in Tucker Marital status - White (Caucasian) population 15 years and over
Males 31.0% Never married53.1% Now married0.8% Separated4.1% Widowed10.9% DivorcedFemales 21.8% Never married46.7% Now married1.1% Separated11.6% Widowed18.9% DivorcedWomen who gave birth in the past 12 months Now married:
86.9% (188)Unmarried:
13.1% (28)
Women who did not give birth in the past 12 months Now married:
44.1% (1,249)Unmarried:
55.9% (1,582)
Marital status - Black or African American population 15 years and over
Males 54.1% Never married30.0% Now married4.4% Separated0.5% Widowed11.0% DivorcedFemales 46.1% Never married27.6% Now married4.9% Separated4.8% Widowed16.6% DivorcedWomen who gave birth in the past 12 months Now married:
54.0% (61)Unmarried:
46.0% (52)
Women who did not give birth in the past 12 months Now married:
31.0% (1,092)Unmarried:
69.0% (2,431)
Marital status - American Indian / Alaska Native population 15 years and over
Males 0.0% Never married100.0% Now married0.0% Separated0.0% Widowed0.0% DivorcedFemales 0.0% Never married100.0% Now married0.0% Separated0.0% Widowed0.0% DivorcedWomen who did not give birth in the past 12 months Now married:
100.0% (21)Unmarried:
0.0% (0)
Marital status - Asian population 15 years and over
Males 42.2% Never married52.7% Now married0.0% Separated3.0% Widowed2.1% DivorcedFemales 10.1% Never married67.2% Now married0.0% Separated8.3% Widowed14.4% DivorcedWomen who gave birth in the past 12 months Now married:
100.0% (53)Unmarried:
0.0% (0)
Women who did not give birth in the past 12 months Now married:
59.6% (304)Unmarried:
40.4% (205)
Marital status - Other race population 15 years and over
Males 48.3% Never married41.1% Now married10.5% Separated0.0% Widowed0.2% DivorcedFemales 40.2% Never married41.9% Now married0.0% Separated1.5% Widowed16.5% DivorcedWomen who did not give birth in the past 12 months Now married:
27.1% (133)Unmarried:
72.9% (356)
Marital status - Two or more races population 15 years and over
Males 56.5% Never married41.3% Now married0.3% Separated0.0% Widowed2.0% DivorcedFemales 29.9% Never married44.1% Now married0.0% Separated6.0% Widowed20.0% DivorcedWomen who did not give birth in the past 12 months Now married:
31.6% (132)Unmarried:
68.4% (285)
Marital status - White alone, not Hispanic / Latino population 15 years and over
Males 28.8% Never married54.2% Now married0.9% Separated4.4% Widowed11.7% DivorcedFemales 20.7% Never married47.4% Now married0.5% Separated11.9% Widowed19.4% DivorcedWomen who gave birth in the past 12 months Now married:
86.9% (197)Unmarried:
13.1% (30)
Women who did not give birth in the past 12 months Now married:
44.8% (1,138)Unmarried:
55.2% (1,402)
Marital status - Hispanic or Latino population 15 years and over
Males 56.7% Never married35.9% Now married1.7% Separated0.0% Widowed5.7% DivorcedFemales 37.0% Never married40.6% Now married3.7% Separated4.7% Widowed14.0% DivorcedWomen who did not give birth in the past 12 months Now married:
36.3% (333)Unmarried:
63.7% (585)
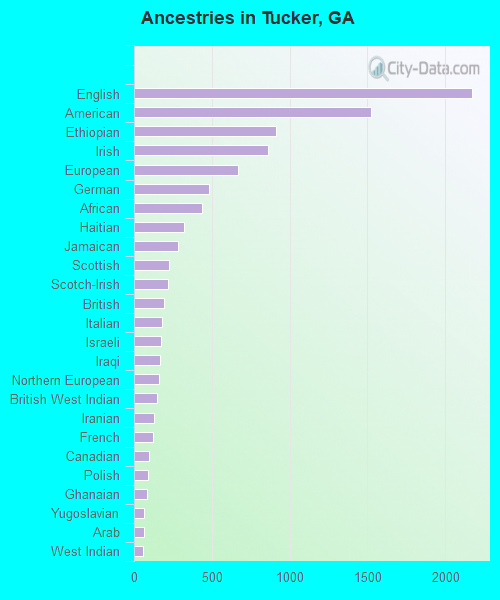
Ancestries in Tucker
2,173 9.5% English1,521 6.7% American910 4.0% Ethiopian860 3.8% Irish668 2.9% European483 2.1% German437 1.9% African321 1.4% Haitian286 1.3% Jamaican228 1.0% Scottish217 1.0% Scotch-Irish194 0.9% British183 0.8% Italian173 0.8% Israeli167 0.7% Iraqi160 0.7% Northern European146 0.6% British West Indian131 0.6% Iranian125 0.5% French99 0.4% Canadian87 0.4% Polish81 0.4% Ghanaian65 0.3% Yugoslavian63 0.3% Arab55 0.2% West Indian52 0.2% Swedish45 0.2% Turkish44 0.2% Lebanese31 0.1% Egyptian26 0.1% Welsh21 0.09% Guyanese17 0.07% Russian16 0.07% Romanian16 0.07% Brazilian15 0.07% Lithuanian13 0.06% Bahamian12 0.05% Palestinian11 0.05% Eastern European9 0.04% Hungarian8 0.04% Swiss7 0.03% Greek5 0.02% Scandinavian4 0.02% Croatian3 0.01% French Canadian3 0.01% Ugandan
Geographical mobility in Tucker Same house 1 year ago 14,796 89.0% White (Caucasian)10,947 82.6% Black or African American7 14.1% American Indian / Alaska Native1,899 85.7% Asian18 100.0% Native Hawaiian / Pacific Islander1,747 91.8% Other race2,255 90.2% Two or more races13,783 88.1% White alone, not Hispanic / Latino3,423 89.8% Hispanic or LatinoMoved within same county 838 5.0% White / Caucasian1,099 8.3% Black or African American17 0.8% Asian14 0.7% Other race183 7.3% Two or more races851 5.4% White alone, not Hispanic / Latino78 2.0% Hispanic or LatinoMoved within same state 701 4.2% White / Caucasian629 4.7% Black or African American12 22.0% American Indian / Alaska Native60 2.7% Asian50 2.6% Other race41 1.6% Two or more races703 4.5% White alone, not Hispanic / Latino101 2.7% Hispanic or LatinoMoved from different state 231 1.4% White / Caucasian465 3.5% Black or African American67 100.0% American Indian / Alaska Native231 10.4% Asian23 0.9% Two or more races238 1.5% White alone, not Hispanic / Latino71 1.9% Hispanic or LatinoMoved from abroad 19 0.1% White32 0.2% Black or African American40 1.8% Asian21 0.8% Two or more races27 0.2% White alone, not Hispanic / Latino
Children Nativity (place of birth) in Tucker
Children under 6 years - Living with two parents Both parents native 944 100.0% NativeBoth parents foreign-born 313 90.5% Native33 9.5% Foreign-bornOne native, one foreign-born parent 511 100.0% NativeChildren under 6 years - Living with one parent Native parent 740 100.0% NativeForeign-born parent 171 100.0% NativeChildren 6 to 17 years - Living with two parents Both parents native 1,228 100.0% NativeBoth parents foreign-born 335 53.0% Native297 47.0% Foreign-bornOne native, one foreign-born parent 251 100.0% NativeChildren 6 to 17 years - Living with one parent Native parent 1,653 100.0% NativeForeign-born parent 401 46.0% Native471 54.0% Foreign-born
Grandparents responsible for own grandchildren in Tucker
Grandparents (30 to 59 years) Black or African American 257 74.0% Responsible for grandchildren90 26.0% Not responsible for grandchildrenAsian 95 100.0% Not responsible for grandchildrenOther race 17 100.0% Responsible for grandchildrenHispanic or Latino 17 100.0% Responsible for grandchildren
Grandparents (60 years and over) Black or African American 35 100.0% Not responsible for grandchildrenOther race 29 100.0% Responsible for grandchildrenHispanic or Latino 27 100.0% Responsible for grandchildren