Sterling, IL (Illinois) Houses and Residents
| Sterling: | $107,753 |
| Illinois: | $251,600 |
Total population: 15,011 (All urban)
Houses: 7,383 (6,562 occupied: 4,122 owner occupied, 2,524 renter occupied)
| % of renters here: | 38% |
| State: | 33% |
Housing density: 1,580 houses/condos per square mile
Median price asked for vacant for-sale houses and condos in 2022: $57,971.
Median contract rent in 2022: $584 (lower quartile is $484, upper quartile is $724)
Median rent asked for vacant for-rent units in 2022: $746
Median gross rent in Sterling, IL in 2022: $751
Housing units in Sterling with a mortgage: 2,205 (117 second mortgage, 0 home equity loan, 68 both second mortgage and home equity loan)
Houses without a mortgage: 43
Median household income for houses/condos with a mortgage: $81,182
Median household income for apartments without a mortgage: $47,422
Median monthly housing costs: $739
Compare current foreclosures in Sterling, IL:
| Photo | Address | Area | Beds / Baths | Price | Details |
|---|---|---|---|---|---|

|
#1
19th Ave
Sterling, IL 61081
|
1,584 sq. feet
|
1 baths 3 beds |
show details | |

|
#2
W 6th St
Sterling, IL 61081
|
1,244 sq. feet
|
1 baths 3 beds |
show details | |

|
#3
Broadway Ave
Sterling, IL 61081
|
1,496 sq. feet
|
2 baths 2 beds |
show details | |

|
#4
W 10th St
Sterling, IL 61081
|
- sq. feet
|
2 baths 4 beds |
show details | |

|
#5
E 16th St
Sterling, IL 61081
|
- sq. feet
|
- baths - beds |
show details | |

|
#6
6th Ave
Sterling, IL 61081
|
- sq. feet
|
- baths - beds |
show details | |

|
#7
Hubbard St
Sterling, IL 61081
|
- sq. feet
|
- baths - beds |
show details | |

|
#8
E 23rd St
Sterling, IL 61081
|
- sq. feet
|
- baths - beds |
show details | |

|
#9
7th Ave
Sterling, IL 61081
|
- sq. feet
|
- baths - beds |
show details | |

|
#10
W 6th St
Sterling, IL 61081
|
- sq. feet
|
- baths - beds |
show details |
| Photo | Address | Area | Beds / Baths | Price | Details |
|---|---|---|---|---|---|

|
#11
Avenue D
Sterling, IL 61081
|
- sq. feet
|
- baths - beds |
show details | |

|
#12
3rd Ave
Sterling, IL 61081
|
- sq. feet
|
- baths - beds |
show details | |

|
#13
E 25th St # A
Sterling, IL 61081
|
- sq. feet
|
- baths - beds |
show details | |

|
#14
E 18th St
Sterling, IL 61081
|
- sq. feet
|
- baths - beds |
show details | |

|
#15
Mill St
Sterling, IL 61081
|
- sq. feet
|
- baths - beds |
show details | |

|
#16
19th Ave
Sterling, IL 61081
|
- sq. feet
|
- baths - beds |
show details | |

|
#17
Avenue K
Sterling, IL 61081
|
- sq. feet
|
- baths - beds |
show details | |

|
#18
Highland Dr
Sterling, IL 61081
|
- sq. feet
|
- baths - beds |
show details | |

|
#19
18th Pl
Sterling, IL 61081
|
- sq. feet
|
- baths - beds |
show details | |

|
#20
Griswold Ave
Sterling, IL 61081
|
- sq. feet
|
- baths - beds |
show details |
| Photo | Address | Area | Beds / Baths | Price | Details |
|---|---|---|---|---|---|

|
#21
Freeport Rd
Sterling, IL 61081
|
- sq. feet
|
- baths - beds |
show details | |

|
#22
E 14th St
Sterling, IL 61081
|
- sq. feet
|
- baths - beds |
show details | |

|
#23
1st Ave
Sterling, IL 61081
|
- sq. feet
|
- baths - beds |
show details | |

|
#24
E 19th St
Sterling, IL 61081
|
- sq. feet
|
- baths - beds |
show details | |

|
#25
E 19th St
Sterling, IL 61081
|
- sq. feet
|
- baths - beds |
show details | |

|
#26
Avenue J
Sterling, IL 61081
|
- sq. feet
|
- baths - beds |
show details | |

|
#27
W 12th St
Sterling, IL 61081
|
- sq. feet
|
- baths - beds |
show details | |

|
#28
Pilgrim Rd
Sterling, IL 61081
|
- sq. feet
|
- baths - beds |
show details | |

|
#29
Hubbard St
Sterling, IL 61081
|
- sq. feet
|
- baths - beds |
show details | |

|
#30
Woodlawn Rd
Sterling, IL 61081
|
- sq. feet
|
- baths - beds |
show details |
| Photo | Address | Area | Beds / Baths | Price | Details |
|---|---|---|---|---|---|

|
#31
Avenue L
Sterling, IL 61081
|
- sq. feet
|
- baths - beds |
show details | |

|
#32
Avenue E
Sterling, IL 61081
|
- sq. feet
|
- baths - beds |
show details | |

|
#33
18th Ave
Sterling, IL 61081
|
- sq. feet
|
- baths - beds |
show details | |

|
#34
W 6th St
Sterling, IL 61081
|
- sq. feet
|
- baths - beds |
show details | |

|
#35
Johnson Ave
Sterling, IL 61081
|
- sq. feet
|
- baths - beds |
show details | |

|
#36
W 14th St
Sterling, IL 61081
|
- sq. feet
|
- baths - beds |
show details | |

|
#37
North St
Sterling, IL 61081
|
- sq. feet
|
- baths - beds |
show details | |

|
#38
Carriage Hill Dr
Sterling, IL 61081
|
- sq. feet
|
- baths - beds |
show details | |

|
#39
Coleta Rd
Sterling, IL 61081
|
- sq. feet
|
- baths - beds |
show details | |

|
#40
4th Ave
Sterling, IL 61081
|
- sq. feet
|
- baths - beds |
show details |
| Photo | Address | Area | Beds / Baths | Price | Details |
|---|---|---|---|---|---|

|
#41
W 10th St
Sterling, IL 61081
|
- sq. feet
|
- baths - beds |
show details | |

|
#42
Avenue I
Sterling, IL 61081
|
- sq. feet
|
- baths - beds |
show details | |

|
Check over 1 million property listings on Foreclosure.com!
|
browse all offers | |||

Latest news about housing in Sterling, IL collected exclusively by city-data.com from local newspapers, TV, and radio stations

 | Chicken Joint near Sterling IL (6 replies) |
| Chicago crime thread: Place all crime-related posts here (1351 replies) |
| Chicago Economy thread (36 replies) |
| West loop construction? (173 replies) |
| Vista Tower Chicago (123 replies) |
| Living near the Rock River (3 replies) |

Median year apartment built: 1971
Household type by relationship:
Households: 14,647- Male householders: 2,862 (1,256 living alone), Female householders: 3,580 (1,291 living alone)
2,193 spouses (2,171 opposite-sex spouses), 634 unmarried partners, (634 opposite-sex unmarried partners), 3,972 children (3,664 natural, 169 adopted, 138 stepchildren), 333 grandchildren, 92 brothers or sisters, 68 parents, 0 foster children, 53 other relatives, 479 non-relatives
- In group quarters: 378
Size of family households: 1,705 2-persons, 929 3-persons, 508 4-persons, 298 5-persons, 111 6-persons, 32 7-or-more-persons.
Size of nonfamily households: 2,684 1-person, 302 2-persons, 78 3-persons, 9 7-or-more-persons.
1,018 married couples with children.
1,551 single-parent households (487 men, 1,064 women).
86.7% of residents of Sterling speak English at home.
10.2% of residents speak Spanish at home (65% speak English very well, 12% speak English well, 16% speak English not well, 7% don't speak English at all).
1.9% of residents speak other Indo-European language at home (83% speak English very well, 6% speak English well, 11% speak English not well).
1.2% of residents speak Asian or Pacific Island language at home (23% speak English very well, 69% speak English well, 7% speak English not well).
0.1% of residents speak other language at home (100% speak English very well).
Foreign born population: 772 (5.3%)
(31.3% of them are naturalized citizens)
| Here: | 6.1 |
| State: | 6.4 |
| Here: | 4.1 |
| State: | 4.1 |

- Bedrooms in owner-occupied houses and condos in Sterling, Illinois
- 0no bedroom
- 961 bedroom
- 9712 bedrooms
- 2,1903 bedrooms
- 6664 bedrooms
- 2005+ bedrooms

- Bedrooms in renter-occupied apartments in Sterling, Illinois
- 137no bedroom
- 7041 bedroom
- 1,0452 bedrooms
- 5133 bedrooms
- 1254 bedrooms
- 05+ bedrooms

- Cars and other vehicles available in Sterling in owner-occupied houses/condos
- 185no vehicle
- 1,5381 vehicle
- 1,5422 vehicles
- 4853 vehicles
- 3084 vehicles
- 645+ vehicles

- Cars and other vehicles available in Sterling in renter-occupied apartments
- 400no vehicle
- 1,6811 vehicle
- 3542 vehicles
- 273 vehicles
- 544 vehicles
- 85+ vehicles

- Rooms in owner-occupied houses in Sterling, Illinois
- 01 room
- 102 rooms
- 1103 rooms
- 2894 rooms
- 9125 rooms
- 1,1646 rooms
- 6747 rooms
- 5188 rooms
- 4469+ rooms

- Rooms in renter-occupied apartments in Sterling, Illinois
- 1241 room
- 1322 rooms
- 4253 rooms
- 8214 rooms
- 4205 rooms
- 4226 rooms
- 1057 rooms
- 08 rooms
- 749+ rooms


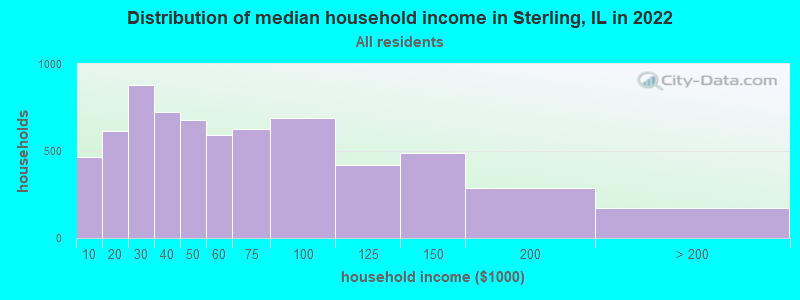
Sterling, IL household income distribution

- 468Less than $10,000
- 615$10,000 to $19,999
- 878$20,000 to $29,999
- 722$30,000 to $39,999
- 681$40,000 to $49,999
- 591$50,000 to $59,999
- 629$60,000 to $74,999
- 691$75,000 to $99,999
- 420$100,000 to $124,999
- 491$125,000 to $149,999
- 286$150,000 to $199,999
- 170$200,000 or more
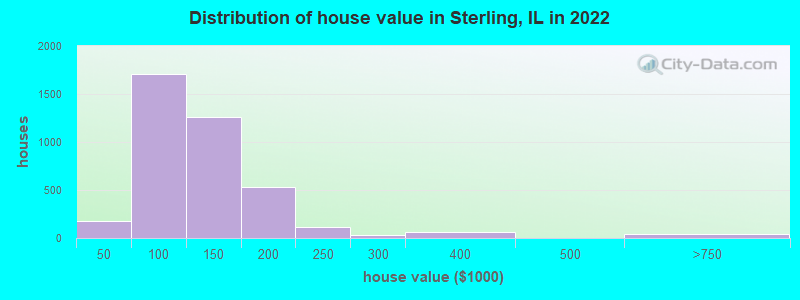
Home value of owner - occupied houses in 2022 in Sterling, IL
-
- 34Less than $10,000
- 21$10,000 to $14,999
- 13$15,000 to $19,999
- 9$25,000 to $29,999
- 45$30,000 to $34,999
- 11$35,000 to $39,999
- 43$40,000 to $49,999
- 185$50,000 to $59,999
- 334$60,000 to $69,999
- 413$70,000 to $79,999
- 301$80,000 to $89,999
- 434$90,000 to $99,999
- 867$100,000 to $124,999
- 397$125,000 to $149,999
- 447$150,000 to $174,999
- 87$175,000 to $199,999
- 112$200,000 to $249,999
- 34$250,000 to $299,999
- 64$300,000 to $399,999
- 44$500,000 to $749,999
Rent paid by renters in 2022 in Sterling, IL
-
- 14Less than $100
- 20$150 to $199
- 136$250 to $299
- 105$300 to $349
- 22$350 to $399
- 209$400 to $449
- 115$450 to $499
- 289$500 to $549
- 277$550 to $599
- 384$600 to $649
- 88$650 to $699
- 215$700 to $749
- 41$750 to $799
- 103$800 to $899
- 34$900 to $999
- 62$1,000 to $1,249
- 46$1,250 to $1,499
- 104$1,500 to $1,999
- 8$2,000 to $2,499
- 22$2,500 to $2,999
- 72$3,500 or more
- 134No cash rent


Percentage of workers working in this county: 75.5%
Number of people working at home: 183 (2.6% of all workers)
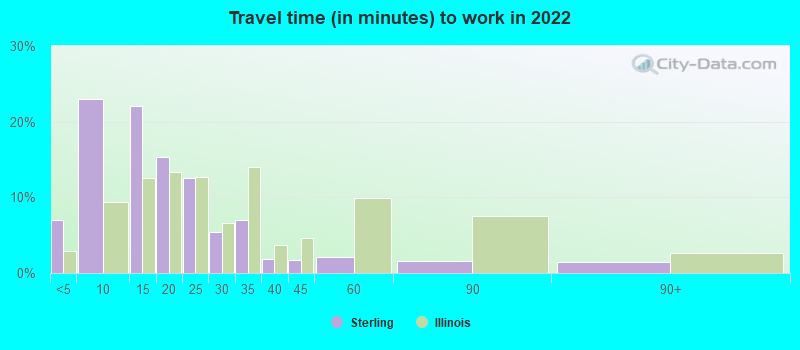
Travel time to work (commute)
- Less than 5 minutes: 682
- 5 to 9 minutes: 1,853
- 10 to 14 minutes: 1,274
- 15 to 19 minutes: 972
- 20 to 24 minutes: 566
- 25 to 29 minutes: 322
- 30 to 34 minutes: 276
- 35 to 39 minutes: 98
- 40 to 44 minutes: 117
- 45 to 59 minutes: 179
- 60 to 89 minutes: 228
- 90 or more minutes: 116
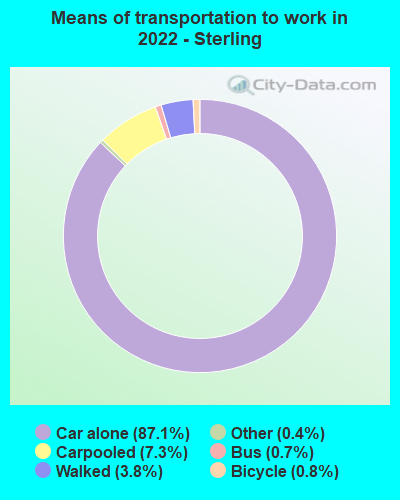
Means of transportation to work:
- Drove a car alone: 7,224 (82.6%)
- Carpooled: 643 (7.3%)
- Bus: 51 (0.6%)
- Taxi: 36 (0.4%)
- Bicycle: 67 (0.8%)
- Walked: 322 (3.7%)
- Worked at home: 183 (2.1%)

- Unemployment by race in 2022
- Unemployment rate for White non-Hispanic residents
- 5.0%Males
- 1.5%Females
- Unemployment rate for Asian residents
- 17.5%Males
- Unemployment rate for two or more race residents
- 14.8%Males
- Unemployment rate for Hispanic or Latino residents
- 8.4%Males
- 4.0%Females

- Year of entry for the foreign-born population in Sterling, Illinois
- 3142010 or later
- 852000 to 2009
- 2501990 to 1999
- 1821980 to 1989
- 1491970 to 1979
- 137Before 1970

First ancestries reported:
- German: 1,794 (26.0%)
- American: 507 (7.3%)
- Irish: 444 (6.4%)
- English: 238 (3.4%)
- European: 204 (3.0%)
- Polish: 170 (2.5%)
- Italian: 102 (1.5%)
- Nigerian: 96 (1.4%)
- Swiss: 92 (1.3%)
- Swedish: 70 (1.0%)
- Scottish: 58 (0.8%)
- Dutch: 47 (0.7%)
- Belgian: 45 (0.7%)
- French Canadian: 30 (0.4%)
- Scotch-Irish: 29 (0.4%)
- Czech: 24 (0.3%)
- Eastern European: 20 (0.3%)
- Norwegian: 20 (0.3%)
- Iranian: 18 (0.3%)
- Bulgarian: 11 (0.2%)
- Russian: 11 (0.2%)
- Lithuanian: 9 (0.1%)
- Hungarian: 8 (0.1%)
- Slovak: 8 (0.1%)
- Ukrainian: 8 (0.1%)
- Austrian: 6 (0.09%)
- French: 6 (0.09%)
- Canadian: 5 (0.07%)
Most common places of birth for foreign-born residents (%):
| Sterling: | 39.2% (303) |
| Illinois: | 34.7% (626,958) |
| Sterling: | 16.7% (129) |
| Illinois: | 5.2% (93,003) |
| Sterling: | 12.7% (98) |
| Illinois: | 0.6% (10,762) |
| Sterling: | 6.7% (52) |
| Illinois: | 1.2% (21,186) |
| Sterling: | 4.5% (35) |
| Illinois: | 1.3% (22,793) |
| Sterling: | 3.6% (28) |
| Illinois: | 6.9% (124,474) |
| Sterling: | 3.0% (23) |
| Illinois: | 0.9% (15,679) |
| Sterling: | 3.0% (23) |
| Illinois: | 9.2% (166,409) |
| Sterling: | 2.2% (17) |
| Illinois: | 0.4% (6,922) |
| Sterling: | 1.9% (15) |
| Illinois: | 4.1% (74,364) |
| Sterling: | 1.8% (14) |
| Illinois: | 0.1% (1,432) |
| Sterling: | 1.6% (12) |
| Illinois: | 0.0% (267) |
Place of birth for U.S.-born residents:
- This state: 11,485
- Other state: 2,081
- Northeast: 66
- Midwest: 1,077
- South: 543
- West: 395
88.3% of Sterling residents lived in the same house 1 years ago.
Out of people who lived in different houses, 41.1% lived in this county.
Out of people who lived in different counties, 83.7% lived in Illinois.
| Sterling: | 88.3% |
| State average: | 88.3% |
Education attainment for males 25 years and older:
- No schooling: 58
- Nursery to 4th grade: 1
- 5th and 6th grade: 33
- 7th and 8th grade: 26
- 9th grade: 14
- 10th grade: 91
- 11th grade: 68
- 12th grade, no diploma: 118
- High school graduate (or equivalency): 2,150
- Less than 1 year of college: 358
- Some college more than 1 year, no degree: 832
- Associate degree: 608
- Bachelor's degree: 299
- Master's degree: 285
- Professional school degree: 7
- Doctorate degree: 32

Education attainment for females 25 years and older:
- No schooling: 142
- Nursery to 4th grade: 48
- 5th and 6th grade: 82
- 7th and 8th grade: 25
- 9th grade: 13
- 10th grade: 27
- 11th grade: 151
- 12th grade, no diploma: 80
- High school graduate (or equivalency): 1,897
- Less than 1 year of college: 397
- Some college more than 1 year, no degree: 747
- Associate degree: 515
- Bachelor's degree: 684
- Master's degree: 390
- Professional school degree: 17
- Doctorate degree: 35


Housing units in structures:
- One, detached: 4,953
- One, attached: 129
- Two: 799
- 3 or 4: 340
- 5 to 9: 441
- 10 to 19: 142
- 20 to 49: 221
- 50 or more: 306
- Boats, RVs, vans, etc.: 49
Housing units lacking complete kitchen facilities in 2022: 4.9%
House/condo owner moved in on average 15 years ago
Renter moved in on average 5 years ago

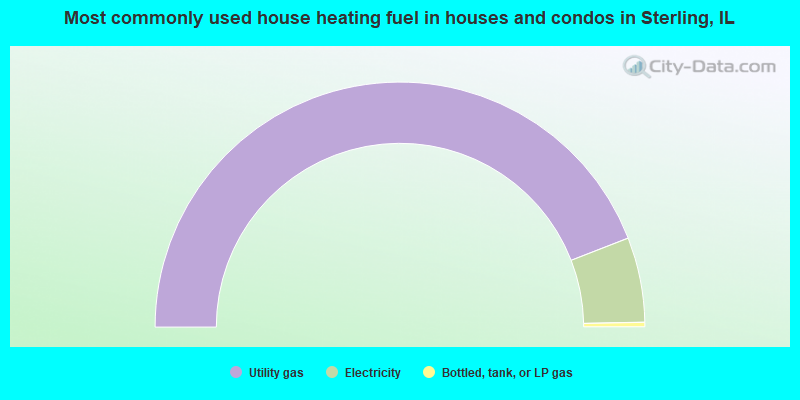
- 88.2%Utility gas
- 11.2%Electricity
- 0.6%Bottled, tank, or LP gas
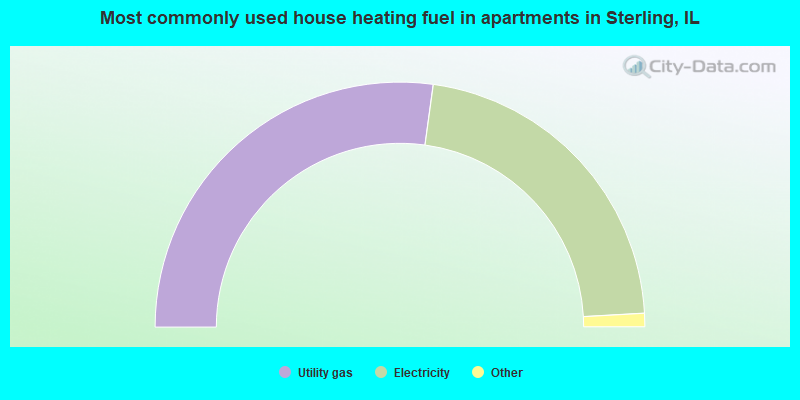
- 54.4%Utility gas
- 43.9%Electricity
- 1.0%No fuel used
- 0.7%Other fuel
Private vs. public school enrollment:
| Here: | 8.6% |
| Illinois: | 13.3% |
| Here: | 2.6% |
| Illinois: | 9.9% |
| Here: | 18.0% |
| Illinois: | 27.4% |


