Races in Sterling, Illinois (IL) Detailed Stats
Ancestries, Foreign-born residents, place of birth
Settings
X


Recent posts about races in Sterling, Illinois on our local forum with over 2,400,000 registered users:
 | Chicken Joint near Sterling IL (6 replies) |
| Dominos are starting to fall. Crime in the city leading to billionaires and businesses relocating (213 replies) |
| West loop construction? (173 replies) |
| Living near the Rock River (3 replies) |
| MEGAPROJECTS!! ** Central Chicago's New Super Projects Thread (6 replies) |
| Violent Crimes (34 replies) |
Latest news about races in Sterling, IL collected exclusively by city-data.com from local newspapers, TV, and radio stations
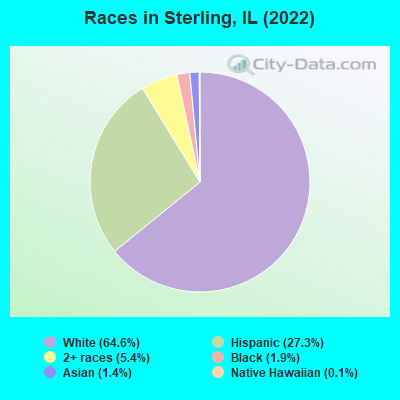
According to 2022 data, the most numerous races in Sterling, IL are White alone (9,461 residents), Hispanic (3,996 residents), and Black alone (273 residents). 86.3% of Sterling residents speak English at home. 5.3% of Sterling, IL residents are foreign-born (2.8% born in Latin America, 1.3% born in Asia, 0.6% born in Europe), which is 165.6% less than the foreign-born rate of 14.0% across the entire state of Illinois.
Race distribution in Sterling
2000
2022

- 11,84876.7%White alone
- 2,97319.2%Hispanic
- 3252.1%Black alone
- 1440.9%Two or more races
- 1230.8%Asian alone
- 300.2%American Indian alone
- 80.05%Other race alone

-
- 9,46164.6%White alone
- 3,99627.3%Hispanic
- 7865.4%Two or more races
- 2731.9%Black alone
- 2081.4%Asian alone
- 180.1%Native Hawaiian and Other
Pacific Islander alone - 130.09%Other race alone
2000
2022
-
- 8,424,14067.8%White alone
- 1,856,15214.9%Black alone
- 1,530,26212.3%Hispanic
- 419,9163.4%Asian alone
- 153,9961.2%Two or more races
- 13,4790.1%Other race alone
- 18,2320.1%American Indian alone
- 3,1160.03%Native Hawaiian and Other
Pacific Islander alone

-
- 7,356,30158.5%White alone
- 2,299,72618.3%Hispanic
- 1,660,42313.2%Black alone
- 747,2965.9%Asian alone
- 458,5993.6%Two or more races
- 45,3860.4%Other race alone
- 10,4050.08%American Indian alone
- 3,8960.03%Native Hawaiian and Other
Pacific Islander alone

Income and house value in Sterling
- Median household income in 2022
- $48,479White non-Hispanic householders
- $48,207Black householders
- $69,301Asian householders
- $30,130Some other race householders
- $43,935Two or more races householders
- $51,828Hispanic or Latino race householders
- Median 2022 house value
- $110,954White Non-Hispanic householders
- $92,817Black or African American householders
- $158,200American Indian or Alaska Native householders
- $101,504Asian householders
- $97,999Some other race householders
- $68,584Two or more races householders
- $94,493Hispanic or Latino householders
Household income for White non-Hispanic householders

Household income for Black householders

Household income for American Indian and Alaska Native householders

Household income for Asian householders

Household income for Some other race householders

Household income for Two or more races householders

Household income for Hispanic or Latino race householders

Median age by race in Sterling
- 45.4Median age for White residents
- 40.0Males
- 48.1Females
- 50.8Median age for Black or African American residents
- 22.1Males
- 56.9Females
- 44.2Median age for American Indian / Alaska Native residents
- -720,238,094.5Males
- 44.0Females
- 36.3Median age for Asian residents
- 34.0Males
- 42.5Females
- -593,236,714.4Median age for Native Hawaiian / Pacific Islander residents
- -658,536,584.7Males
- -576,015,108.0Females
- 45.4Median age for Other race residents
- 45.6Males
- 47.8Females
- 26.1Median age for Two or more races residents
- 37.8Males
- 23.8Females
- 48.6Median age for White alone residents
- 43.7Males
- 51.8Females
- 28.5Median age for Hispanic or Latino residents
- 25.3Males
- 29.7Females
Owner/renter occupied households by race in Sterling
- House owners and renters - White residents
- 3,38666.0%Owner occupied
- 1,74734.0%Renter occupied
- House owners and renters - Black or African American residents
- 1310.7%Owner occupied
- 11089.3%Renter occupied
- House owners and renters - American Indian / Alaska Native residents
- 71100.0%Owner occupied
- House owners and renters - Asian residents
- 3842.8%Owner occupied
- 5157.2%Renter occupied
- House owners and renters - Other race residents
- 24667.3%Owner occupied
- 12032.7%Renter occupied
- House owners and renters - Two or more races residents
- 44747.1%Owner occupied
- 50152.9%Renter occupied
- House owners and renters - White alone residents
- 3,10565.4%Owner occupied
- 1,64434.6%Renter occupied
- House owners and renters - Hispanic or Latino residents
- 89064.8%Owner occupied
- 48435.2%Renter occupied
Language usage in Sterling
- English speakers - Total
- 86.3% of residents of Sterling speak English at home.
- 10.1% of residents speak Spanish at home
- 91664.1%Speak English very well
- 51435.9%Speak English less than very well
- 3.2% of residents speak other language at home
- 27159.3%Speak English very well
- 18640.7%Speak English less than very well
- English speakers - Born in the United States
- 89.7% of residents of Sterling speak English at home.
- 5.9% of residents speak Spanish at home
- 4335.2%Speak English very well
- 7964.8%Speak English less than very well
- 5.0% of residents speak other language at home
- 103100.0%Speak English very well
- English speakers - Native, born elsewhere
- 21.8% of residents of Sterling speak English at home.
- 65.3% of residents speak Spanish at home
- 11567.3%Speak English very well
- 5632.7%Speak English less than very well
- 11.5% of residents speak other language at home
- 30100.0%Speak English very well
- English speakers - Foreign-born
- 12.8% of residents of Sterling speak English at home.
- 52.7% of residents speak Spanish at home
- 18244.7%Speak English very well
- 22555.3%Speak English less than very well
- 34.1% of residents speak other language at home
- 7729.3%Speak English very well
- 18670.7%Speak English less than very well
White (Caucasian) - Speak only English
| Native: | 96.3% (10,115) |
| Foreign-born: | 16.6% (35) |
White (Caucasian) - Speak another language
| Native: | 4.2% (438) |
| Foreign-born: | 83.3% (177) |
Black or African American - Speak only English
| Native: | 100.0% (257) |
| Foreign-born: | 100.0% (45) |
American Indian / Alaska Native - Speak another language
| Native: | 100.0% (61) |
| Foreign-born: | 100.0% (63) |
Asian - Speak another language
| Native: | 12.7% (10) |
| Foreign-born: | 100.0% (178) |
Other race - Speak another language
| Native: | 45.8% (218) |
| Foreign-born: | 99.9% (130) |
Two or more races - Speak another language
| Native: | 22.2% (480) |
| Foreign-born: | 100.0% (151) |
White alone - Speak only English
| Native: | 97.6% (8,890) |
| Foreign-born: | 39.4% (39) |
White alone - Speak another language
| Native: | 2.3% (212) |
| Foreign-born: | 58.6% (58) |
Hispanic or Latino - Speak another language
| Native: | 29.6% (981) |
| Foreign-born: | 100.0% (424) |
Foreign-born residents in Sterling
772 residents are foreign born (2.8% Latin America, 1.3% Asia, 0.6% Europe).
| This city: | 5.3% |
| Illinois: | 14.1% |


Marital status for residents in Sterling
Marital status - White (Caucasian) population 15 years and over
- Males
- 45.4%Never married
- 38.4%Now married
- 1.3%Separated
- 5.4%Widowed
- 9.4%Divorced
- Females
- 28.8%Never married
- 40.6%Now married
- 2.3%Separated
- 12.5%Widowed
- 15.9%Divorced
Women who gave birth in the past 12 months
| Now married: | 33.3% (25) |
| Unmarried: | 66.7% (50) |
Women who did not give birth in the past 12 months
| Now married: | 30.6% (671) |
| Unmarried: | 69.4% (1,519) |
Marital status - Black or African American population 15 years and over
- Males
- 62.7%Never married
- 35.3%Now married
- 2.0%Separated
- 0.0%Widowed
- 0.0%Divorced
- Females
- 54.0%Never married
- 14.3%Now married
- 0.0%Separated
- 0.0%Widowed
- 31.7%Divorced
Women who did not give birth in the past 12 months
| Now married: | 27.6% (15) |
| Unmarried: | 72.4% (40) |
Marital status - American Indian / Alaska Native population 15 years and over
- Males
- 100.0%Never married
- 0.0%Now married
- 0.0%Separated
- 0.0%Widowed
- 0.0%Divorced
- Females
- 25.4%Never married
- 41.3%Now married
- 0.0%Separated
- 0.0%Widowed
- 33.3%Divorced
Women who did not give birth in the past 12 months
| Now married: | 61.9% (43) |
| Unmarried: | 38.1% (27) |
Marital status - Asian population 15 years and over
- Males
- 56.9%Never married
- 43.1%Now married
- 0.0%Separated
- 0.0%Widowed
- 0.0%Divorced
- Females
- 29.5%Never married
- 51.8%Now married
- 8.9%Separated
- 0.0%Widowed
- 9.8%Divorced
Women who did not give birth in the past 12 months
| Now married: | 72.2% (66) |
| Unmarried: | 27.8% (25) |
Marital status - Other race population 15 years and over
- Males
- 32.6%Never married
- 67.4%Now married
- 0.0%Separated
- 0.0%Widowed
- 0.0%Divorced
- Females
- 31.1%Never married
- 29.3%Now married
- 13.8%Separated
- 12.0%Widowed
- 13.8%Divorced
Women who gave birth in the past 12 months
| Now married: | 0.0% (0) |
| Unmarried: | 100.0% (10) |
Women who did not give birth in the past 12 months
| Now married: | 57.0% (66) |
| Unmarried: | 43.0% (50) |
Marital status - Two or more races population 15 years and over
- Males
- 67.8%Never married
- 23.8%Now married
- 0.0%Separated
- 0.4%Widowed
- 8.0%Divorced
- Females
- 43.2%Never married
- 17.6%Now married
- 0.0%Separated
- 7.7%Widowed
- 31.5%Divorced
Women who did not give birth in the past 12 months
| Now married: | 12.5% (76) |
| Unmarried: | 87.5% (527) |
Marital status - White alone, not Hispanic / Latino population 15 years and over
- Males
- 42.9%Never married
- 38.7%Now married
- 1.5%Separated
- 6.3%Widowed
- 10.5%Divorced
- Females
- 25.9%Never married
- 40.9%Now married
- 1.8%Separated
- 13.5%Widowed
- 17.8%Divorced
Women who gave birth in the past 12 months
| Now married: | 40.6% (27) |
| Unmarried: | 59.4% (39) |
Women who did not give birth in the past 12 months
| Now married: | 27.7% (488) |
| Unmarried: | 72.3% (1,274) |
Marital status - Hispanic or Latino population 15 years and over
- Males
- 56.4%Never married
- 40.2%Now married
- 0.0%Separated
- 0.0%Widowed
- 3.5%Divorced
- Females
- 40.0%Never married
- 31.0%Now married
- 4.2%Separated
- 8.3%Widowed
- 16.5%Divorced
Women who gave birth in the past 12 months
| Now married: | 0.0% (0) |
| Unmarried: | 100.0% (24) |
Women who did not give birth in the past 12 months
| Now married: | 34.6% (363) |
| Unmarried: | 65.4% (688) |
Ancestries in Sterling

- 1,79426.0%German
- 5077.3%American
- 4446.4%Irish
- 2383.4%English
- 2043.0%European
- 1702.5%Polish
- 1021.5%Italian
- 961.4%Nigerian
- 921.3%Swiss
- 701.0%Swedish
- 580.8%Scottish
- 470.7%Dutch
- 450.7%Belgian
- 300.4%French Canadian
- 290.4%Scotch-Irish
- 240.3%Czech
- 200.3%Eastern European
- 200.3%Norwegian
- 180.3%Iranian
- 110.2%Bulgarian
- 110.2%Russian
- 90.1%Lithuanian
- 80.1%Hungarian
- 80.1%Slovak
- 80.1%Ukrainian
- 60.09%Austrian
- 60.09%French
- 50.07%Canadian

Geographical mobility in Sterling

- Same house 1 year ago
- 9,46887.1%White (Caucasian)
- 28393.8%Black or African American
- 12199.7%American Indian / Alaska Native
- 24998.2%Asian
- 15100.0%Native Hawaiian / Pacific Islander
- 52984.7%Other race
- 2,34394.5%Two or more races
- 8,20387.0%White alone, not Hispanic / Latino
- 3,58890.6%Hispanic or Latino

-
- Moved within same county
- 9849.1%White / Caucasian
- 196.2%Black or African American
- 31.2%Asian
- 243.9%Other race
- 692.8%Two or more races
- 8378.9%White alone, not Hispanic / Latino
- 2496.3%Hispanic or Latino

-
- Moved within same state
- 2632.4%White / Caucasian
- 8313.2%Other race
- 572.3%Two or more races
- 2452.6%White alone, not Hispanic / Latino
- 1032.6%Hispanic or Latino

-
- Moved from different state
- 760.7%White / Caucasian
- 780.8%White alone, not Hispanic / Latino

-
- Moved from abroad
- 220.2%White
- 250.3%White alone, not Hispanic / Latino

Children Nativity (place of birth) in Sterling
Place of birth for residents in Sterling
![Place of birth for the foreign-born population - Regions]()
- 426Americas
- 419Latin America
- 419Central America
- 190Asia
- 137South Eastern Asia
- 84Europe
- 57Africa
- 49Eastern Europe
- 49Western Africa
- 37South Central Asia
- 20Southern Europe
- 16Eastern Asia
- 16China
- 14Oceania
- 8Western Europe
- 8Northern Africa
- 7Northern Europe
- 7Northern America

![Place of birth for the foreign-born population - Countries]()
- 306Mexico
- 130Philippines
- 77Honduras
- 49Nigeria
- 35Guatemala
- 29Poland
- 23India
- 20Italy
- 16China
- 14Iran
- 14Fiji
- 11Bulgaria
- 9Hungary
- 8Germany
- 8Egypt
- 7England
- 7Canada
- 4Burma (Myanmar)
- 3Laos

Grandparents responsible for own grandchildren in Sterling
Zip codes: 61037.