Springfield, VA (Virginia) Houses and Residents
Estimated median house or condo value in 2022: $619,430 (it was $184,600 in 2000 )
Springfield:
$619,430Virginia:
$365,700
Lower value quartile - upper value quartile: $513,311 - $726,787Mean price in 2022: Detached houses: $601,586 Here:
$601,586State:
$472,865
Townhouses or other attached units: $508,975 Here:
$508,975State:
$457,437
In 5-or-more-unit structures: $413,875 Here:
$413,875State:
$382,551
Total population: 30,484 (Urban population: 30,262, Rural population: 0)
Houses: 10,993 (10,637 occupied: 7,070 owner occupied, 3,625 renter occupied )
% of renters here:
34%State:
33%
Housing density: 1,127 houses/condos per square mile
Median price asked for vacant for-sale houses and condos in 2022: $1,416,958.
Median contract rent in 2022: over $2,000 (lower quartile is $1,767, upper quartile is over $2,000)
Median rent asked for vacant for-rent units in 2022: $2,891
Median gross rent in Springfield, VA in 2022: over $2,000
Housing units in Springfield with a mortgage: 4,652 (501 second mortgage, 30 home equity loan, 397 both second mortgage and home equity loan )Houses without a mortgage: 40
Median household income for houses/condos with a mortgage: $155,610
Median household income for apartments without a mortgage: $119,181
Median monthly housing costs: $2,345
Data:
Median house or condo value ($)
Median house or condo value ($ change since 2000)
Median house or condo value ($) - White
Median house or condo value ($) - Black or African American
Median house or condo value ($) - Asian
Median house or condo value ($) - Hispanic or Latino
Median house or condo value ($) - American Indian and Alaska Native
Median house or condo value ($) - Multirace
Median house or condo value ($) - Other Race
Median price asked for mobile homes ($)
Household density (households per square mile)
Mean house or condo value by units in structure - 1, detached ($)
Mean house or condo value by units in structure - 1, attached ($)
Mean house or condo value by units in structure - 2 ($)
Mean house or condo value by units in structure by units in structure - 3 or 4 ($)
Mean house or condo value by units in structure - 5 or more ($)
Mean house or condo value by units in structure - Boat, RV, van, etc. ($)
Mean house or condo value by units in structure - Mobile home ($)
Median contract rent ($)
Median contract rent - Lower quartile ($)
Median contract rent - Upper quartile ($)
Median gross rent ($)
Urban houses (%)
Rural houses (%)
Houses occupied (%)
Houses occupied (% change since 2000)
Houses owner occupied (%)
Houses owner occupied (% change since 2000)
Houses renter occupied (%)
Houses renter occupied (% change since 2000)
Vacant housing units - For rent (%)
Vacant housing units - For rent (% change since 2000)
Vacant housing units - For sale only (%)
Vacant housing units - For sale only (% change since 2000)
Vacant housing units - Rented or sold, not occupied (%)
Vacant housing units - Rented or sold, not occupied (% change since 2000)
Vacant housing units - For seasonal, recreational, or occasional use (%)
Vacant housing units - For seasonal, recreational, or occasional use (% change since 2000)
Vacant housing units - For migrant workers (%)
Vacant housing units - For migrant workers (% change since 2000)
Vacant housing units - Other vacant (%)
Vacant housing units - Other vacant (% change since 2000)
Median monthly housing costs ($)
Median household income for houses/condos with a mortgage ($)
Median household income for houses/condos without a mortgage ($)
Median household income ($)
Median household income ($) - White
Median household income ($) - Black or African American
Median household income ($) - Asian
Median household income ($) - Hispanic or Latino
Median household income ($) - American Indian and Alaska Native
Median household income ($) - Multirace
Median household income ($) - Other Race
Mortgage status - with mortgage (%)
Mortgage status - with second mortgage (%)
Mortgage status - with home equity loan (%)
Mortgage status - with both second mortgage and home equity loan (%)
Mortgage status - without a mortgage (%)
Median year house/condo built
Median year apartment built
Household type by relationship - Male householder living alone (%)
Household type by relationship - Male householder not living alone (%)
Household type by relationship - Female householder living alone (%)
Household type by relationship - Female householder not living alone (%)
Household type by relationship - Opposite-Sex spouse (%)
Household type by relationship - Same-Sex spouse (%)
Household type by relationship - Opposite-Sex unmarried partner (%)
Household type by relationship - Same-Sex unmarried partner (%)
Household type by relationship - In group quarters (%)
Size of family households - 2-person household (%)
Size of family households - 3-person household (%)
Size of family households - 4-person household (%)
Size of family households - 5-person household (%)
Size of family households - 6-person household (%)
Size of family households - 7-or-more-person household (%)
Size of nonfamily households - 1-person household (%)
Size of nonfamily households - 2-person household (%)
Size of nonfamily households - 3-person household (%)
Size of nonfamily households - 4-person household (%)
Size of nonfamily households - 5-person household (%)
Size of nonfamily households - 6-person household (%)
Size of nonfamily households - 7-or-moreperson household (%)
Year house built - Built 2010 or later (%)
Year house built - Built 2000 to 2009 (%)
Year house built - Built 1990 to 1999 (%)
Year house built - Built 1980 to 1989 (%)
Year house built - Built 1970 to 1979 (%)
Year house built - Built 1960 to 1969 (%)
Year house built - Built 1950 to 1959 (%)
Year house built - Built 1940 to 1949 (%)
Year house built - Built 1939 or earlier (%)
Median number of rooms in houses and condos
Median number of rooms in apartments
Median number of bedrooms in owner occupied houses
Mean number of bedrooms in owner occupied houses
Median number of bedrooms in renter occupied houses
Mean number of bedrooms in renter occupied houses
Median number of vehichles in owner occupied houses
Mean number of vehichles in owner occupied houses
Median number of vehichles in renter occupied houses
Mean number of vehichles in renter occupied houses
Rooms in owner-occupied houses - 1 room (%)
Rooms in owner-occupied houses - 2 rooms (%)
Rooms in owner-occupied houses - 3 rooms (%)
Rooms in owner-occupied houses - 4 rooms (%)
Rooms in owner-occupied houses - 5 rooms (%)
Rooms in owner-occupied houses - 6 rooms (%)
Rooms in owner-occupied houses - 7 rooms (%)
Rooms in owner-occupied houses - 8 rooms (%)
Rooms in owner-occupied houses - 9+ rooms (%)
Rooms in renter-occupied houses - 1 room (%)
Rooms in renter-occupied houses - 2 rooms (%)
Rooms in renter-occupied houses - 3 rooms (%)
Rooms in renter-occupied houses - 4 rooms (%)
Rooms in renter-occupied houses - 5 rooms (%)
Rooms in renter-occupied houses - 6 rooms (%)
Rooms in renter-occupied houses - 7 rooms (%)
Rooms in renter-occupied houses - 8 rooms (%)
Rooms in renter-occupied houses - 9+ rooms (%)
Bedrooms in owner-occupied houses - no bedrooms (%)
Bedrooms in owner-occupied houses - 1 bedroom (%)
Bedrooms in owner-occupied houses - 2 bedrooms (%)
Bedrooms in owner-occupied houses - 3 bedrooms (%)
Bedrooms in owner-occupied houses - 4 bedrooms (%)
Bedrooms in owner-occupied houses - 5+ bedrooms (%)
Bedrooms in renter-occupied houses - no bedrooms (%)
Bedrooms in renter-occupied houses - 1 bedroom (%)
Bedrooms in renter-occupied houses - 2 bedrooms (%)
Bedrooms in renter-occupied houses - 3 bedrooms (%)
Bedrooms in renter-occupied houses - 4 bedrooms (%)
Bedrooms in renter-occupied houses - 5+ bedrooms (%)
Vehicles available in owner-occupied houses - no vehicle available (%)
Vehicles available in owner-occupied houses - 1 vehicle available(%)
Vehicles available in owner-occupied houses - 2 Vehicles available (%)
Vehicles available in owner-occupied houses - 3 Vehicles available (%)
Vehicles available in owner-occupied houses - 4 Vehicles available (%)
Vehicles available in owner-occupied houses - 5+ Vehicles available (%)
Vehicles available in renter-occupied houses - no vehicle available (%)
Vehicles available in renter-occupied houses - 1 vehicle available (%)
Vehicles available in renter-occupied houses - 2 Vehicles available (%)
Vehicles available in renter-occupied houses - 3 Vehicles available (%)
Vehicles available in renter-occupied houses - 4 Vehicles available (%)
Vehicles available in renter-occupied houses - 5+ Vehicles available (%)
Housing units in structures - 1, detached (%)
Housing units in structures - 1, attached (%)
Housing units in structures - 2 (%)
Housing units in structures - 3 or 4 (%)
Housing units in structures - 5 to 9 (%)
Housing units in structures - 10 to 19 (%)
Housing units in structures - 20 to 49 (%)
Housing units in structures - 50 or more (%)
Housing units in structures - Mobile home (%)
Housing units in structures - Boat, RV, van, etc. (%)
Housing units in structures - Owners - 1, detached (%)
Housing units in structures - Owners - 1, attached (%)
Housing units in structures - Owners - 2 (%)
Housing units in structures - Owners - 3 or 4 (%)
Housing units in structures - Owners - 5 to 9 (%)
Housing units in structures - Owners - 10 to 19 (%)
Housing units in structures - Owners - 20 to 49 (%)
Housing units in structures - Owners - 50 or more (%)
Housing units in structures - Owners - Mobile home (%)
Housing units in structures - Owners - Boat, RV, van, etc. (%)
Housing units in structures - Renters - 1, detached (%)
Housing units in structures - Renters - 1, attached (%)
Housing units in structures - Renters - 2 (%)
Housing units in structures - Renters - 3 or 4 (%)
Housing units in structures - Renters - 5 to 9 (%)
Housing units in structures - Renters - 10 to 19 (%)
Housing units in structures - Renters - 20 to 49 (%)
Housing units in structures - Renters - 50 or more (%)
Housing units in structures - Renters - Mobile home (%)
Housing units in structures - Renters - Boat, RV, van, etc. (%)
House/condo owner moved in on average (years ago)
Renter moved in on average (years ago)
Year householder moved into unit - Moved in 1999 to March 2000 (%)
Year householder moved into unit - Moved in 1999 to March 2000 (%) - White
Year householder moved into unit - Moved in 1999 to March 2000 (%) - Black or African American
Year householder moved into unit - Moved in 1999 to March 2000 (%) - Asian
Year householder moved into unit - Moved in 1999 to March 2000 (%) - Hispanic or Latino
Year householder moved into unit - Moved in 1999 to March 2000 (%) - American Indian and Alaska Native
Year householder moved into unit - Moved in 1999 to March 2000 (%) - Multirace
Year householder moved into unit - Moved in 1999 to March 2000 (%) - Other Race
Year householder moved into unit - Moved in 1995 to 1998 (%)
Year householder moved into unit - Moved in 1995 to 1998 (%) - White
Year householder moved into unit - Moved in 1995 to 1998 (%) - Black or African American
Year householder moved into unit - Moved in 1995 to 1998 (%) - Asian
Year householder moved into unit - Moved in 1995 to 1998 (%) - Hispanic or Latino
Year householder moved into unit - Moved in 1995 to 1998 (%) - American Indian and Alaska Native
Year householder moved into unit - Moved in 1995 to 1998 (%) - Multirace
Year householder moved into unit - Moved in 1995 to 1998 (%) - Other Race
Year householder moved into unit - Moved in 1990 to 1994 (%)
Year householder moved into unit - Moved in 1990 to 1994 (%) - White
Year householder moved into unit - Moved in 1990 to 1994 (%) - Black or African American
Year householder moved into unit - Moved in 1990 to 1994 (%) - Asian
Year householder moved into unit - Moved in 1990 to 1994 (%) - Hispanic or Latino
Year householder moved into unit - Moved in 1990 to 1994 (%) - American Indian and Alaska Native
Year householder moved into unit - Moved in 1990 to 1994 (%) - Multirace
Year householder moved into unit - Moved in 1990 to 1994 (%) - Other Race
Year householder moved into unit - Moved in 1980 to 1989 (%)
Year householder moved into unit - Moved in 1980 to 1989 (%) - White
Year householder moved into unit - Moved in 1980 to 1989 (%) - Black or African American
Year householder moved into unit - Moved in 1980 to 1989 (%) - Asian
Year householder moved into unit - Moved in 1980 to 1989 (%) - Hispanic or Latino
Year householder moved into unit - Moved in 1980 to 1989 (%) - American Indian and Alaska Native
Year householder moved into unit - Moved in 1980 to 1989 (%) - Multirace
Year householder moved into unit - Moved in 1980 to 1989 (%) - Other Race
Year householder moved into unit - Moved in 1970 to 1979 (%)
Year householder moved into unit - Moved in 1970 to 1979 (%) - White
Year householder moved into unit - Moved in 1970 to 1979 (%) - Black or African American
Year householder moved into unit - Moved in 1970 to 1979 (%) - Asian
Year householder moved into unit - Moved in 1970 to 1979 (%) - Hispanic or Latino
Year householder moved into unit - Moved in 1970 to 1979 (%) - American Indian and Alaska Native
Year householder moved into unit - Moved in 1970 to 1979 (%) - Multirace
Year householder moved into unit - Moved in 1970 to 1979 (%) - Other Race
Year householder moved into unit - Moved in 1969 or earlier (%)
Year householder moved into unit - Moved in 1969 or earlier (%) - White
Year householder moved into unit - Moved in 1969 or earlier (%) - Black or African American
Year householder moved into unit - Moved in 1969 or earlier (%) - Asian
Year householder moved into unit - Moved in 1969 or earlier (%) - Hispanic or Latino
Year householder moved into unit - Moved in 1969 or earlier (%) - American Indian and Alaska Native
Year householder moved into unit - Moved in 1969 or earlier (%) - Multirace
Year householder moved into unit - Moved in 1969 or earlier (%) - Other Race
Housing units lacking complete plumbing facilities (%)
Housing units lacking complete kitchen facilities (%)
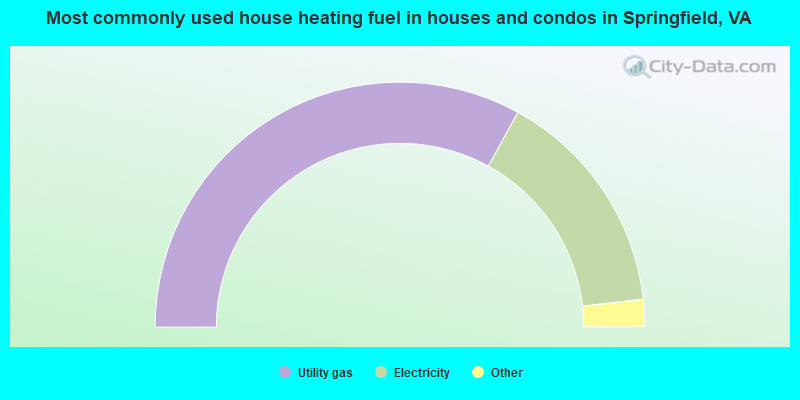
House heating fuel used in houses and condos - Utility gas (%)
House heating fuel used in houses and condos - Bottled, tank, or LP gas (%)
House heating fuel used in houses and condos - Electricity (%)
House heating fuel used in houses and condos - Fuel oil, kerosene, etc. (%)
House heating fuel used in houses and condos - Coal or coke (%)
House heating fuel used in houses and condos - Wood (%)
House heating fuel used in houses and condos - Solar energy (%)
House heating fuel used in houses and condos - Other fuel (%)
House heating fuel used in houses and condos - No fuel used (%)
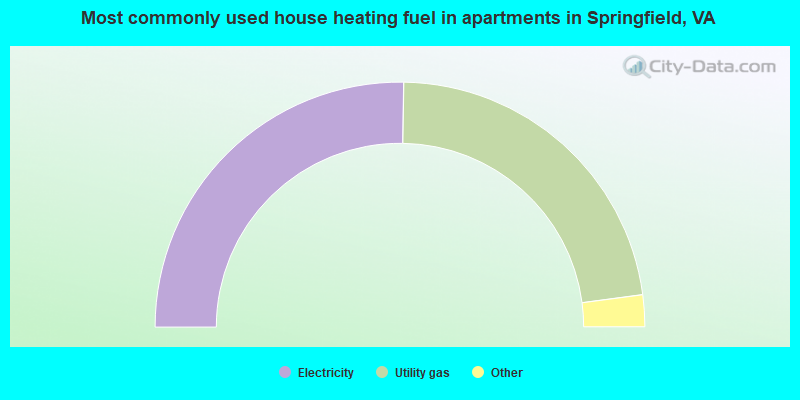
House heating fuel used in apartments - Utility gas (%)
House heating fuel used in apartments - Bottled, tank, or LP gas (%)
House heating fuel used in apartments - Electricity (%)
House heating fuel used in apartments - Fuel oil, kerosene, etc. (%)
House heating fuel used in apartments - Coal or coke (%)
House heating fuel used in apartments - Wood (%)
House heating fuel used in apartments - Solar energy (%)
House heating fuel used in apartments - Other fuel (%)
House heating fuel used in apartments - No fuel used (%)
Latest news about housing in Springfield, VA collected exclusively by city-data.com from local newspapers, TV, and radio stations
Median year house/condo built: 1966Median year apartment built: 1990Household type by relationship:
Households: 30,831
Male householders: 5,970 (1,337 living alone ), Female householders: 4,532 (1,778 living alone )5,687 spouses (5,642 opposite-sex spouses ), 259 unmarried partners , (259 opposite-sex unmarried partners ), 9,022 children (8,553 natural , 106 adopted , 362 stepchildren ), 526 grandchildren , 757 brothers or sisters , 1,015 parents , 0 foster children , 1,191 other relatives , 1,555 non-relatives In group quarters: 313
Size of family households: 2,783 2-persons , 1,394 3-persons , 1,485 4-persons , 707 5-persons , 472 6-persons , 288 7-or-more-persons .
Size of nonfamily households: 3,213 1-person , 134 2-persons , 124 3-persons , 40 4-persons , 19 5-persons , 15 7-or-more-persons .
3,974 married couples with children. single-parent households (380 men , 524 women ).
47.1% of residents of Springfield speak English at home. of residents speak Spanish at home (48% speak English very well , 23% speak English well , 18% speak English not well , 10% don't speak English at all ).of residents speak other Indo-European language at home (56% speak English very well , 32% speak English well , 6% speak English not well , 5% don't speak English at all ).of residents speak Asian or Pacific Island language at home (47% speak English very well , 27% speak English well , 23% speak English not well , 3% don't speak English at all ).of residents speak other language at home (76% speak English very well , 21% speak English well , 2% speak English not well , 1% don't speak English at all ).
Foreign born population: 12,538 (40.7%)of them are naturalized citizens )
Median number of rooms in houses and condos:
Median number of rooms in apartments
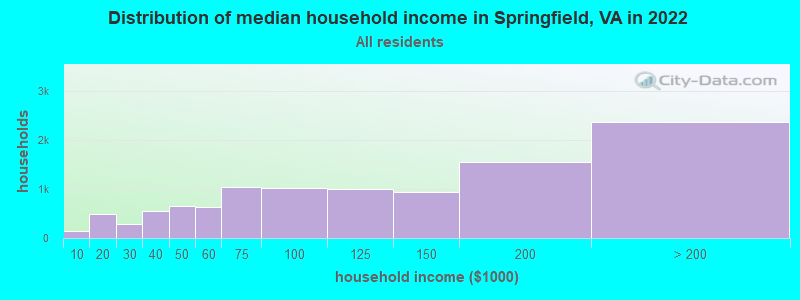
Springfield, VA household income distribution 143 Less than $10,000485 $10,000 to $19,999279 $20,000 to $29,999549 $30,000 to $39,999656 $40,000 to $49,999634 $50,000 to $59,9991,045 $60,000 to $74,9991,022 $75,000 to $99,9991,002 $100,000 to $124,999944 $125,000 to $149,9991,541 $150,000 to $199,9992,362 $200,000 or more
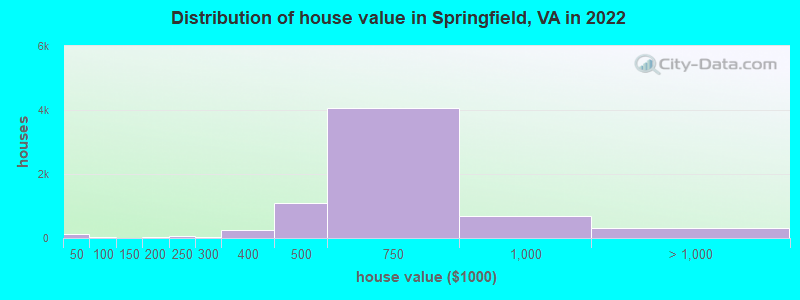
Home value of owner - occupied houses in 2022 in Springfield, VA 68 Less than $10,00041 $20,000 to $24,9995 $25,000 to $29,99914 $50,000 to $59,9996 $60,000 to $69,9996 $70,000 to $79,9994 $125,000 to $149,9999 $150,000 to $174,99917 $175,000 to $199,99952 $200,000 to $249,99925 $250,000 to $299,999253 $300,000 to $399,9991,108 $400,000 to $499,9994,076 $500,000 to $749,999674 $750,000 to $999,999253 $1,000,000 to $1,499,9997 $1,500,000 to $1,999,99939 $2,000,000 or moreRent paid by renters in 2022 in Springfield, VA 13 $350 to $3995 $400 to $4498 $550 to $59941 $800 to $89933 $900 to $999259 $1,000 to $1,249116 $1,250 to $1,499816 $1,500 to $1,999721 $2,000 to $2,499611 $2,500 to $2,999564 $3,000 to $3,499271 $3,500 or more243 No cash rent
Percentage of workers working in this county: 65.0%Number of people working at home: 2,559 (16.8% of all workers )
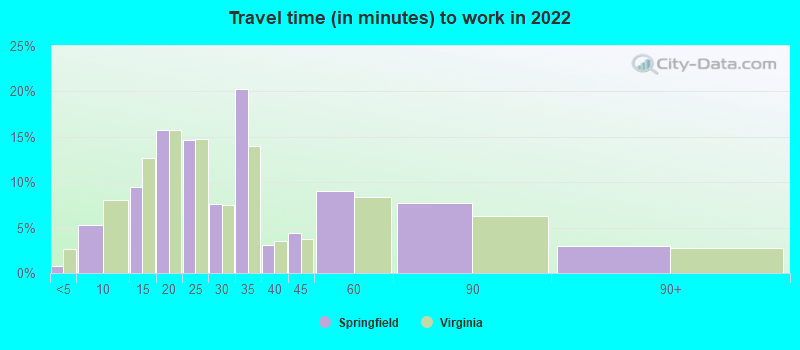
Travel time to work (commute)
Less than 5 minutes: 1035 to 9 minutes: 70210 to 14 minutes: 1,01315 to 19 minutes: 1,59720 to 24 minutes: 1,84325 to 29 minutes: 1,08030 to 34 minutes: 2,96035 to 39 minutes: 41440 to 44 minutes: 69345 to 59 minutes: 1,02760 to 89 minutes: 68090 or more minutes: 105
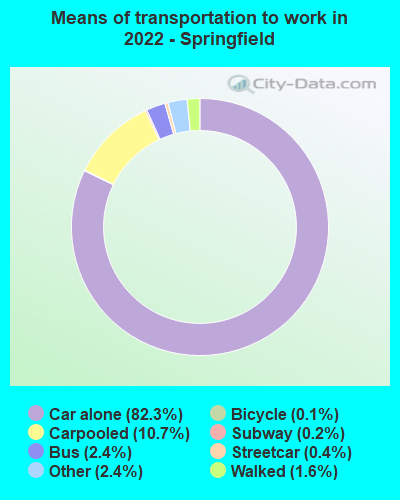
Means of transportation to work:
Drove a car alone: 14,603 (69.0%)Carpooled: 1,945 (9.2%)Bus : 285 (1.3%)Subway or elevated rail : 66 (0.3%)Long-distance train or commuter rail : 15 (0.1%)Light rail, streetcar or trolley : 5 (0.0%)Taxi: 570 (2.7%)Bicycle: 16 (0.1%)Walked: 317 (1.5%)Worked at home: 2,559 (12.1%)
Unemployment by race in 2022
Unemployment rate for White non-Hispanic residents 2.5% Males3.9% FemalesUnemployment rate for Black residents 5.2% Males9.9% FemalesUnemployment rate for Asian residents 9.3% Males3.5% FemalesUnemployment rate for other race residents 1.1% Males11.8% FemalesUnemployment rate for two or more race residents 0.6% Males9.0% FemalesUnemployment rate for Hispanic or Latino residents 1.9% Males8.8% Females
Year of entry for the foreign-born population in Springfield, Virginia
2,711 2010 or later 3,195 2000 to 2009 2,788 1990 to 1999 4,038 1980 to 1989 1,541 1970 to 1979 508 Before 1970
First ancestries reported:
American: 1,551 (7.9%)
English: 718 (3.7%)
Ethiopian: 649 (3.3%)
African: 488 (2.5%)
Irish: 477 (2.4%)
German: 397 (2.0%)
Afghan: 253 (1.3%)
Italian: 239 (1.2%)
European: 233 (1.2%)
Ghanaian: 196 (1.0%)
Romanian: 176 (0.9%)
Moroccan: 117 (0.6%)
Arab: 117 (0.6%)
Polish: 90 (0.5%)
Greek: 82 (0.4%)
French: 74 (0.4%)
South African: 72 (0.4%)
Egyptian: 71 (0.4%)
Jamaican: 68 (0.3%)
Ukrainian: 52 (0.3%)
Eastern European: 50 (0.3%)
Russian: 50 (0.3%)
Scottish: 47 (0.2%)
Austrian: 45 (0.2%)
Brazilian: 39 (0.2%)
Lebanese: 38 (0.2%)
Syrian: 38 (0.2%)
Scotch-Irish: 35 (0.2%)
Swedish: 35 (0.2%)
Dutch: 33 (0.2%)
Bulgarian: 30 (0.2%)
Hungarian: 27 (0.1%)
British: 27 (0.1%)
Finnish: 26 (0.1%)
Norwegian: 26 (0.1%)
Iraqi: 24 (0.1%)
Sudanese: 24 (0.1%)
Czech: 23 (0.1%)
Scandinavian: 19 (0.10%)
Danish: 18 (0.09%)
Iranian: 18 (0.09%)
Sierra Leonean: 16 (0.08%)
Lithuanian: 7 (0.04%)
Portuguese: 7 (0.04%)
Slavic: 7 (0.04%)
Haitian: 6 (0.03%)
French Canadian: 5 (0.03%)
Turkish: 4 (0.02%)
Slovak: 3 (0.02%)
Most common places of birth for foreign-born residents (%): Vietnam Springfield:
16.1% (2,015)Virginia:
4.2% (45,750)
Philippines Springfield:
7.5% (935)Virginia:
4.8% (52,629)
Honduras Springfield:
6.9% (871)Virginia:
3.0% (32,892)
Pakistan Springfield:
6.4% (807)Virginia:
2.3% (24,582)
El Salvador Springfield:
5.3% (667)Virginia:
9.9% (107,534)
China, excluding Hong Kong and Taiwan Springfield:
4.9% (615)Virginia:
3.9% (42,989)
Bangladesh Springfield:
4.8% (598)Virginia:
1.1% (12,049)
Peru Springfield:
4.6% (581)Virginia:
2.4% (26,366)
Bolivia Springfield:
4.4% (550)Virginia:
2.4% (25,722)
Africa, n.e.c. Springfield:
3.1% (390)Virginia:
0.3% (3,275)
Ethiopia Springfield:
3.1% (387)Virginia:
2.9% (32,082)
Eritrea Springfield:
2.8% (349)Virginia:
0.3% (3,058)
Korea Springfield:
2.7% (336)Virginia:
4.9% (52,857)
India Springfield:
2.6% (322)Virginia:
9.0% (97,830)
Afghanistan Springfield:
2.3% (286)Virginia:
1.8% (19,426)
Thailand Springfield:
1.5% (193)Virginia:
0.7% (7,672)
Place of birth for U.S.-born residents:
This state: 8,929Other state: 8,041Northeast: 2,605Midwest: 1,323South: 2,856West: 1,253 91.2% of Springfield residents lived in the same house 1 years ago.
Out of people who lived in different houses, 33.8% lived in this county.
Out of people who lived in different counties, 37.2% lived in Virginia.
Springfield:
91.2%State average:
86.6%
Education attainment for males 25 years and older:
No schooling: 433Nursery to 4th grade: 525th and 6th grade: 1257th and 8th grade: 779th grade: 7410th grade: 12711th grade: 16012th grade, no diploma: 309High school graduate (or equivalency): 1,931Less than 1 year of college: 394Some college more than 1 year, no degree: 915Associate degree: 909Bachelor's degree: 2,753Master's degree: 1,806Professional school degree: 506Doctorate degree: 302
Education attainment for females 25 years and older:
No schooling: 312Nursery to 4th grade: 815th and 6th grade: 2347th and 8th grade: 1409th grade: 10210th grade: 11411th grade: 3112th grade, no diploma: 190High school graduate (or equivalency): 2,191Less than 1 year of college: 585Some college more than 1 year, no degree: 1,152Associate degree: 890Bachelor's degree: 2,856Master's degree: 1,557Professional school degree: 208Doctorate degree: 128
Housing units in structures:
One, detached: 6,128One, attached: 1,5993 or 4: 345 to 9: 12610 to 19: 98620 to 49: 46350 or more: 1,599Mobile homes: 55Housing units lacking complete plumbing facilities in 2022: 0.2%Housing units lacking complete kitchen facilities in 2022: 1.3%House/condo owner moved in on average 14 years ago
Renter moved in on average 6 years ago
Private vs. public school enrollment:
Students in private schools in grades 1 to 8 (elementary and middle school): 300 Students in private schools in grades 9 to 12 (high school): 249 Students in private undergraduate colleges: 441