Races in Springfield, Virginia (VA) Detailed Stats
Data:
Races - White alone (%)
Races - White alone (% change since 2000)
Races - Black alone (%)
Races - Black alone (% change since 2000)
Races - American Indian alone (%)
Races - American Indian alone (% change since 2000)
Races - Asian alone (%)
Races - Asian alone (% change since 2000)
Races - Hispanic (%)
Races - Hispanic (% change since 2000)
Races - Native Hawaiian and Other Pacific Islander alone (%)
Races - Native Hawaiian and Other Pacific Islander alone (% change since 2000)
Races - Two or more races(%)
Races - Two or more races(% change since 2000)
Races - Other race alone (%)
Races - Other race alone (% change since 2000)
Racial diversity
Place of birth - Born in state of residence (%)
Place of birth - Born in state of residence (%) - White
Place of birth - Born in state of residence (%) - Black or African American
Place of birth - Born in state of residence (%) - Asian
Place of birth - Born in state of residence (%) - Hispanic or Latino
Place of birth - Born in state of residence (%) - American Indian and Alaska Native
Place of birth - Born in state of residence (%) - Multirace
Place of birth - Born in state of residence (%) - Other Race
Place of birth - Born in other state (%)
Place of birth - Born in other state (%) - White
Place of birth - Born in other state (%) - Black or African American
Place of birth - Born in other state (%) - Asian
Place of birth - Born in other state (%) - Hispanic or Latino
Place of birth - Born in other state (%) - American Indian and Alaska Native
Place of birth - Born in other state (%) - Multirace
Place of birth - Born in other state (%) - Other Race
Place of birth - Native, outside of US (%)
Place of birth - Native, outside of US (%) - White
Place of birth - Native, outside of US (%) - Black or African American
Place of birth - Native, outside of US (%) - Asian
Place of birth - Native, outside of US (%) - Hispanic or Latino
Place of birth - Native, outside of US (%) - American Indian and Alaska Native
Place of birth - Native, outside of US (%) - Multirace
Place of birth - Native, outside of US (%) - Other Race
Place of birth - Foreign born (%)
Place of birth - Foreign born (%) - White
Place of birth - Foreign born (%) - Black or African American
Place of birth - Foreign born (%) - Asian
Place of birth - Foreign born (%) - Hispanic or Latino
Place of birth - Foreign born (%) - American Indian and Alaska Native
Place of birth - Foreign born (%) - Multirace
Place of birth - Foreign born (%) - Other Race
Residents speaking English at home (%)
Residents speaking English at home - Born in the United States (%)
Residents speaking English at home - Native, born elsewhere (%)
Residents speaking English at home - Foreign born (%)
Residents speaking Spanish at home (%)
Residents speaking Spanish at home - Born in the United States (%)
Residents speaking Spanish at home - Native, born elsewhere (%)
Residents speaking Spanish at home - Foreign born (%)
Residents speaking other language at home (%)
Residents speaking other language at home - Born in the United States (%)
Residents speaking other language at home - Native, born elsewhere (%)
Residents speaking other language at home - Foreign born (%)
Marital status - Never married (%)
Marital status - Now married (%)
Marital status - Separated (%)
Marital status - Widowed (%)
Marital status - Divorced (%)
Ancestries Reported - Arab (%)
Ancestries Reported - Czech (%)
Ancestries Reported - Danish (%)
Ancestries Reported - Dutch (%)
Ancestries Reported - English (%)
Ancestries Reported - French (%)
Ancestries Reported - French Canadian (%)
Ancestries Reported - German (%)
Ancestries Reported - Greek (%)
Ancestries Reported - Hungarian (%)
Ancestries Reported - Irish (%)
Ancestries Reported - Italian (%)
Ancestries Reported - Lithuanian (%)
Ancestries Reported - Norwegian (%)
Ancestries Reported - Polish (%)
Ancestries Reported - Portuguese (%)
Ancestries Reported - Russian (%)
Ancestries Reported - Scotch-Irish (%)
Ancestries Reported - Scottish (%)
Ancestries Reported - Slovak (%)
Ancestries Reported - Subsaharan African (%)
Ancestries Reported - Swedish (%)
Ancestries Reported - Swiss (%)
Ancestries Reported - Ukrainian (%)
Ancestries Reported - United States (%)
Ancestries Reported - Welsh (%)
Ancestries Reported - West Indian (%)
Ancestries Reported - Other (%)
Geographical mobility - Same house 1 year ago (%)
Geographical mobility - Same house 1 year ago (%) - White
Geographical mobility - Same house 1 year ago (%) - Black or African American
Geographical mobility - Same house 1 year ago (%) - Asian
Geographical mobility - Same house 1 year ago (%) - Hispanic or Latino
Geographical mobility - Same house 1 year ago (%) - American Indian and Alaska Native
Geographical mobility - Same house 1 year ago (%) - Multirace
Geographical mobility - Same house 1 year ago (%) - Other Race
Geographical mobility - Moved within same county (%)
Geographical mobility - Moved within same county (%) - White
Geographical mobility - Moved within same county (%) - Black or African American
Geographical mobility - Moved within same county (%) - Asian
Geographical mobility - Moved within same county (%) - Hispanic or Latino
Geographical mobility - Moved within same county (%) - American Indian and Alaska Native
Geographical mobility - Moved within same county (%) - Multirace
Geographical mobility - Moved within same county (%) - Other Race
Geographical mobility - Moved from different county within same state (%)
Geographical mobility - Moved from different county within same state (%) - White
Geographical mobility - Moved from different county within same state (%) - Black or African American
Geographical mobility - Moved from different county within same state (%) - Asian
Geographical mobility - Moved from different county within same state (%) - Hispanic or Latino
Geographical mobility - Moved from different county within same state (%) - American Indian and Alaska Native
Geographical mobility - Moved from different county within same state (%) - Multirace
Geographical mobility - Moved from different county within same state (%) - Other Race
Geographical mobility - Moved from different state (%)
Geographical mobility - Moved from different state (%) - White
Geographical mobility - Moved from different state (%) - Black or African American
Geographical mobility - Moved from different state (%) - Asian
Geographical mobility - Moved from different state (%) - Hispanic or Latino
Geographical mobility - Moved from different state (%) - American Indian and Alaska Native
Geographical mobility - Moved from different state (%) - Multirace
Geographical mobility - Moved from different state (%) - Other Race
Geographical mobility - Moved from abroad (%)
Geographical mobility - Moved from abroad (%) - White
Geographical mobility - Moved from abroad (%) - Black or African American
Geographical mobility - Moved from abroad (%) - Asian
Geographical mobility - Moved from abroad (%) - Hispanic or Latino
Geographical mobility - Moved from abroad (%) - American Indian and Alaska Native
Geographical mobility - Moved from abroad (%) - Multirace
Geographical mobility - Moved from abroad (%) - Other Race
Place of birth for the foreign-born population - Ireland (%)
Place of birth for the foreign-born population - Denmark (%)
Place of birth for the foreign-born population - Norway (%)
Place of birth for the foreign-born population - Sweden (%)
Place of birth for the foreign-born population - United Kingdom (%)
Place of birth for the foreign-born population - England (%)
Place of birth for the foreign-born population - Scotland (%)
Place of birth for the foreign-born population - Other Northern Europe (%)
Place of birth for the foreign-born population - Austria (%)
Place of birth for the foreign-born population - Belgium (%)
Place of birth for the foreign-born population - France (%)
Place of birth for the foreign-born population - Germany (%)
Place of birth for the foreign-born population - Netherlands (%)
Place of birth for the foreign-born population - Switzerland (%)
Place of birth for the foreign-born population - Other Western Europe (%)
Place of birth for the foreign-born population - Greece (%)
Place of birth for the foreign-born population - Italy (%)
Place of birth for the foreign-born population - Portugal (%)
Place of birth for the foreign-born population - Spain (%)
Place of birth for the foreign-born population - Other Southern Europe (%)
Place of birth for the foreign-born population - Albania (%)
Place of birth for the foreign-born population - Belarus (%)
Place of birth for the foreign-born population - Bosnia and Herzegovina (%)
Place of birth for the foreign-born population - Bulgaria (%)
Place of birth for the foreign-born population - Croatia (%)
Place of birth for the foreign-born population - Czechoslovakia (%)
Place of birth for the foreign-born population - Hungary (%)
Place of birth for the foreign-born population - Latvia (%)
Place of birth for the foreign-born population - Lithuania (%)
Place of birth for the foreign-born population - North Macedonia (Macedonia) (%)
Place of birth for the foreign-born population - Moldova (%)
Place of birth for the foreign-born population - Poland (%)
Place of birth for the foreign-born population - Romania (%)
Place of birth for the foreign-born population - Russia (%)
Place of birth for the foreign-born population - Serbia (%)
Place of birth for the foreign-born population - Ukraine (%)
Place of birth for the foreign-born population - Other Eastern Europe (%)
Place of birth for the foreign-born population - China (%)
Place of birth for the foreign-born population - Hong Kong (%)
Place of birth for the foreign-born population - Taiwan (%)
Place of birth for the foreign-born population - Japan (%)
Place of birth for the foreign-born population - Korea (%)
Place of birth for the foreign-born population - Other Eastern Asia (%)
Place of birth for the foreign-born population - Afghanistan (%)
Place of birth for the foreign-born population - Bangladesh (%)
Place of birth for the foreign-born population - India (%)
Place of birth for the foreign-born population - Iran (%)
Place of birth for the foreign-born population - Kazakhstan (%)
Place of birth for the foreign-born population - Nepal (%)
Place of birth for the foreign-born population - Pakistan (%)
Place of birth for the foreign-born population - Sri Lanka (%)
Place of birth for the foreign-born population - Uzbekistan (%)
Place of birth for the foreign-born population - Other South Central Asia (%)
Place of birth for the foreign-born population - Burma (%)
Place of birth for the foreign-born population - Cambodia (%)
Place of birth for the foreign-born population - Indonesia (%)
Place of birth for the foreign-born population - Laos (%)
Place of birth for the foreign-born population - Malaysia (%)
Place of birth for the foreign-born population - Philippines (%)
Place of birth for the foreign-born population - Singapore (%)
Place of birth for the foreign-born population - Thailand (%)
Place of birth for the foreign-born population - Vietnam (%)
Place of birth for the foreign-born population - Other South Eastern Asia (%)
Place of birth for the foreign-born population - Armenia (%)
Place of birth for the foreign-born population - Iraq (%)
Place of birth for the foreign-born population - Israel (%)
Place of birth for the foreign-born population - Jordan (%)
Place of birth for the foreign-born population - Kuwait (%)
Place of birth for the foreign-born population - Lebanon (%)
Place of birth for the foreign-born population - Saudi Arabia (%)
Place of birth for the foreign-born population - Syria (%)
Place of birth for the foreign-born population - Turkey (%)
Place of birth for the foreign-born population - Yemen (%)
Place of birth for the foreign-born population - Other Western Asia (%)
Place of birth for the foreign-born population - Eritrea (%)
Place of birth for the foreign-born population - Ethiopia (%)
Place of birth for the foreign-born population - Kenya (%)
Place of birth for the foreign-born population - Somalia (%)
Place of birth for the foreign-born population - Uganda (%)
Place of birth for the foreign-born population - Zimbabwe (%)
Place of birth for the foreign-born population - Other Eastern Africa (%)
Place of birth for the foreign-born population - Cameroon (%)
Place of birth for the foreign-born population - Congo (%)
Place of birth for the foreign-born population - Democratic Republic of Congo (Zaire) (%)
Place of birth for the foreign-born population - Other Middle Africa (%)
Place of birth for the foreign-born population - Egypt (%)
Place of birth for the foreign-born population - Morocco (%)
Place of birth for the foreign-born population - Sudan (%)
Place of birth for the foreign-born population - Other Northern Africa (%)
Place of birth for the foreign-born population - South Africa (%)
Place of birth for the foreign-born population - Other Southern Africa (%)
Place of birth for the foreign-born population - Cabo Verde (%)
Place of birth for the foreign-born population - Ghana (%)
Place of birth for the foreign-born population - Liberia (%)
Place of birth for the foreign-born population - Nigeria (%)
Place of birth for the foreign-born population - Senegal (%)
Place of birth for the foreign-born population - Sierra Leone (%)
Place of birth for the foreign-born population - Other Western Africa (%)
Place of birth for the foreign-born population - Australia (%)
Place of birth for the foreign-born population - New Zealand (%)
Place of birth for the foreign-born population - Fiji (%)
Place of birth for the foreign-born population - Micronesia (%)
Place of birth for the foreign-born population - Bahamas (%)
Place of birth for the foreign-born population - Barbados (%)
Place of birth for the foreign-born population - Cuba (%)
Place of birth for the foreign-born population - Dominica (%)
Place of birth for the foreign-born population - Dominican Republic (%)
Place of birth for the foreign-born population - Grenada (%)
Place of birth for the foreign-born population - Haiti (%)
Place of birth for the foreign-born population - Jamaica (%)
Place of birth for the foreign-born population - St. Vincent and the Grenadines (%)
Place of birth for the foreign-born population - Trinidad and Tobago (%)
Place of birth for the foreign-born population - West Indies (%)
Place of birth for the foreign-born population - Other Caribbean (%)
Place of birth for the foreign-born population - Belize (%)
Place of birth for the foreign-born population - Costa Rica (%)
Place of birth for the foreign-born population - El Salvador (%)
Place of birth for the foreign-born population - Guatemala (%)
Place of birth for the foreign-born population - Honduras (%)
Place of birth for the foreign-born population - Mexico (%)
Place of birth for the foreign-born population - Nicaragua (%)
Place of birth for the foreign-born population - Panama (%)
Place of birth for the foreign-born population - Other Central America (%)
Place of birth for the foreign-born population - Argentina (%)
Place of birth for the foreign-born population - Bolivia (%)
Place of birth for the foreign-born population - Brazil (%)
Place of birth for the foreign-born population - Chile (%)
Place of birth for the foreign-born population - Colombia (%)
Place of birth for the foreign-born population - Ecuador (%)
Place of birth for the foreign-born population - Guyana (%)
Place of birth for the foreign-born population - Peru (%)
Place of birth for the foreign-born population - Uruguay (%)
Place of birth for the foreign-born population - Venezuela (%)
Place of birth for the foreign-born population - Other South America (%)
Place of birth for the foreign-born population - Canada (%)
Place of birth for the foreign-born population - Other Northern America (%)
Place of birth for the foreign-born population - Other (%)
Latest news about races in Springfield, VA collected exclusively by city-data.com from local newspapers, TV, and radio stations
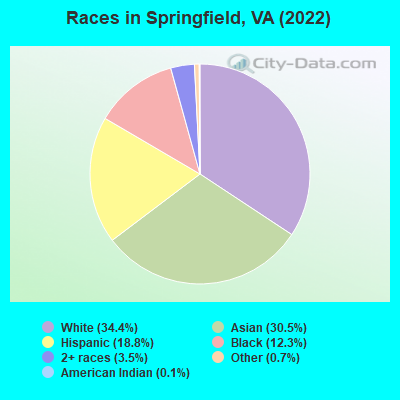
According to 2022 data, the most numerous races in Springfield, VA are White alone (10,610 residents), Black alone (3,794 residents), and Hispanic (5,784 residents). 46.8% of Springfield residents speak English at home. 40.7% of Springfield, VA residents are foreign-born (22.2% born in Asia, 10.2% born in Latin America, 6.0% born in Africa), which is 70.5% greater than the foreign-born rate of 12.0% across the entire state of Virginia.
Race distribution in Springfield
2000 2022
4,965,637 70.2% White alone 1,376,378 19.4% Black alone 329,540 4.7% Hispanic 259,277 3.7% Asian alone 114,022 1.6% Two or more races 18,596 0.3% American Indian alone 11,685 0.2% Other race alone 3,380 0.05% Native Hawaiian and Other
5,095,130 58.7% White alone 1,594,785 18.4% Black alone 905,750 10.4% Hispanic 602,881 6.9% Asian alone 406,047 4.7% Two or more races 60,419 0.7% Other race alone 11,738 0.1% American Indian alone 6,869 0.08% Native Hawaiian and Other
Income and house value in Springfield Median household income in 2022 $114,993 White non-Hispanic householders$127,191 Black householders$95,633 Asian householders$85,175 Some other race householders$98,022 Two or more races householders$114,873 Hispanic or Latino race householdersMedian 2022 house value $633,187 White Non-Hispanic householders$646,609 Black or African American householders$551,648 American Indian or Alaska Native householders $599,632 Asian householders$578,157 Some other race householders$594,599 Two or more races householders$572,788 Hispanic or Latino householders
Median age by race in Springfield
46.9 Median age for White residents43.0 52.6 42.6 Median age for Black or African American residents43.5 41.4 -754,182,753.4 Median age for American Indian / Alaska Native residents-964,539,006.1 -669,005,847.3 48.7 Median age for Asian residents48.0 48.5 -666,666,666.0 Median age for Native Hawaiian / Pacific Islander residents-558,791,801.0 -584,518,166.9 37.5 Median age for Other race residents38.2 28.6 27.9 Median age for Two or more races residents36.7 22.8 49.8 Median age for White alone residents44.2 54.8 34.0 Median age for Hispanic or Latino residents37.3 29.0
Owner/renter occupied households by race in Springfield
House owners and renters - White residents 3,272 63.7% Owner occupied1,864 36.3% Renter occupiedHouse owners and renters - Black or African American residents 532 46.9% Owner occupied603 53.1% Renter occupiedHouse owners and renters - Asian residents 2,405 85.3% Owner occupied414 14.7% Renter occupiedHouse owners and renters - Other race residents 407 50.0% Owner occupied407 50.0% Renter occupiedHouse owners and renters - Two or more races residents 490 55.6% Owner occupied391 44.4% Renter occupiedHouse owners and renters - White alone residents 2,964 61.9% Owner occupied1,826 38.1% Renter occupiedHouse owners and renters - Hispanic or Latino residents 831 51.8% Owner occupied773 48.2% Renter occupied
Language usage in Springfield
English speakers - Total 46.8% of residents of Springfield speak English at home.
17.6% of residents speak Spanish at home 2,443 47.8% Speak English very well2,663 52.2% Speak English less than very well35.3% of residents speak other language at home 5,710 55.8% Speak English very well4,532 44.2% Speak English less than very well
English speakers - Born in the United States 88.5% of residents of Springfield speak English at home.
8.2% of residents speak Spanish at home 375 59.1% Speak English very well259 40.9% Speak English less than very well4.2% of residents speak other language at home 276 84.4% Speak English very well51 15.6% Speak English less than very well
English speakers - Native, born elsewhere 45.2% of residents of Springfield speak English at home.
27.0% of residents speak Spanish at home 290 88.4% Speak English very well38 11.6% Speak English less than very well28.5% of residents speak other language at home 335 96.5% Speak English very well12 3.5% Speak English less than very well
English speakers - Foreign-born 9.6% of residents of Springfield speak English at home.
25.0% of residents speak Spanish at home 834 26.7% Speak English very well2,286 73.3% Speak English less than very well65.1% of residents speak other language at home 3,786 46.6% Speak English very well4,337 53.4% Speak English less than very well
White (Caucasian) - Speak only English Native:
87.2% (8,134)Foreign-born:
18.7% (327)
White (Caucasian) - Speak another language Native:
11.0% (1,026)Foreign-born:
78.8% (1,380)
Black or African American - Speak only English Native:
85.8% (1,734)Foreign-born:
13.3% (216)
Black or African American - Speak another language Native:
14.7% (297)Foreign-born:
84.2% (1,368)
Asian - Speak only English Native:
38.9% (917)Foreign-born:
8.5% (552)
Asian - Speak another language Native:
62.0% (1,461)Foreign-born:
90.9% (5,922)
Other race - Speak only English Native:
52.3% (571)Foreign-born:
1.8% (23)
Other race - Speak another language Native:
50.4% (551)Foreign-born:
96.8% (1,253)
Two or more races - Speak only English Native:
57.6% (1,105)Foreign-born:
5.4% (66)
Two or more races - Speak another language Native:
43.6% (836)Foreign-born:
94.7% (1,173)
White alone - Speak only English Native:
90.4% (8,030)Foreign-born:
24.4% (309)
White alone - Speak another language Native:
9.1% (813)Foreign-born:
75.0% (948)
Hispanic or Latino - Speak only English Native:
34.2% (803)Foreign-born:
2.6% (76)
Hispanic or Latino - Speak another language Native:
63.5% (1,491)Foreign-born:
97.4% (2,855)
Foreign-born residents in Springfield 12,538 residents are foreign born (22.2% Asia , 10.2% Latin America , 6.0% Africa ).
This city:
40.7%Virginia:
12.6%
Marital status for residents in Springfield Marital status - White (Caucasian) population 15 years and over
Males 35.9% Never married52.0% Now married0.6% Separated5.8% Widowed5.7% DivorcedFemales 23.3% Never married45.4% Now married3.4% Separated18.7% Widowed9.2% DivorcedWomen who gave birth in the past 12 months Now married:
63.5% (101)Unmarried:
36.5% (58)
Women who did not give birth in the past 12 months Now married:
53.2% (1,097)Unmarried:
46.8% (965)
Marital status - Black or African American population 15 years and over
Males 46.1% Never married49.6% Now married0.0% Separated2.4% Widowed1.8% DivorcedFemales 49.6% Never married36.4% Now married3.5% Separated1.0% Widowed9.5% DivorcedWomen who did not give birth in the past 12 months Now married:
38.6% (356)Unmarried:
61.4% (565)
Marital status - American Indian / Alaska Native population 15 years and over
Males 0.0% Never married0.0% Now married0.0% Separated0.0% Widowed100.0% DivorcedFemales 0.0% Never married100.0% Now married0.0% Separated0.0% Widowed0.0% DivorcedWomen who did not give birth in the past 12 months Now married:
100.0% (5)Unmarried:
0.0% (0)
Marital status - Asian population 15 years and over
Males 33.5% Never married58.2% Now married0.0% Separated1.6% Widowed6.6% DivorcedFemales 20.1% Never married61.4% Now married0.6% Separated11.9% Widowed5.9% DivorcedWomen who gave birth in the past 12 months Now married:
100.0% (88)Unmarried:
0.0% (0)
Women who did not give birth in the past 12 months Now married:
55.6% (1,001)Unmarried:
44.4% (800)
Marital status - Other race population 15 years and over
Males 46.5% Never married37.1% Now married4.3% Separated7.6% Widowed4.5% DivorcedFemales 42.2% Never married42.8% Now married2.6% Separated6.6% Widowed5.7% DivorcedWomen who gave birth in the past 12 months Now married:
100.0% (103)Unmarried:
0.0% (0)
Women who did not give birth in the past 12 months Now married:
24.7% (118)Unmarried:
75.3% (360)
Marital status - Two or more races population 15 years and over
Males 42.3% Never married46.9% Now married2.1% Separated5.9% Widowed2.8% DivorcedFemales 51.8% Never married35.2% Now married0.0% Separated5.1% Widowed7.9% DivorcedWomen who gave birth in the past 12 months Now married:
5.1% (3)Unmarried:
94.9% (49)
Women who did not give birth in the past 12 months Now married:
25.9% (247)Unmarried:
74.1% (706)
Marital status - White alone, not Hispanic / Latino population 15 years and over
Males 35.2% Never married52.1% Now married0.7% Separated6.9% Widowed5.1% DivorcedFemales 20.6% Never married45.9% Now married2.4% Separated20.4% Widowed10.6% DivorcedWomen who gave birth in the past 12 months Now married:
79.1% (99)Unmarried:
20.9% (26)
Women who did not give birth in the past 12 months Now married:
53.7% (947)Unmarried:
46.3% (818)
Marital status - Hispanic or Latino population 15 years and over
Males 43.5% Never married43.3% Now married0.7% Separated5.5% Widowed6.9% DivorcedFemales 42.6% Never married40.1% Now married4.5% Separated7.8% Widowed5.1% DivorcedWomen who gave birth in the past 12 months Now married:
48.3% (70)Unmarried:
51.7% (75)
Women who did not give birth in the past 12 months Now married:
35.7% (458)Unmarried:
64.3% (827)
Ancestries in Springfield
1,551 7.9% American718 3.7% English649 3.3% Ethiopian488 2.5% African477 2.4% Irish397 2.0% German253 1.3% Afghan239 1.2% Italian233 1.2% European196 1.0% Ghanaian176 0.9% Romanian117 0.6% Moroccan117 0.6% Arab90 0.5% Polish82 0.4% Greek74 0.4% French72 0.4% South African71 0.4% Egyptian68 0.3% Jamaican52 0.3% Ukrainian50 0.3% Eastern European50 0.3% Russian47 0.2% Scottish45 0.2% Austrian39 0.2% Brazilian38 0.2% Lebanese38 0.2% Syrian35 0.2% Scotch-Irish35 0.2% Swedish33 0.2% Dutch30 0.2% Bulgarian27 0.1% Hungarian27 0.1% British26 0.1% Finnish26 0.1% Norwegian24 0.1% Iraqi24 0.1% Sudanese23 0.1% Czech19 0.10% Scandinavian18 0.09% Danish18 0.09% Iranian16 0.08% Sierra Leonean7 0.04% Lithuanian7 0.04% Portuguese7 0.04% Slavic6 0.03% Haitian5 0.03% French Canadian4 0.02% Turkish3 0.02% Slovak
Geographical mobility in Springfield Same house 1 year ago 10,601 90.5% White (Caucasian)3,613 95.8% Black or African American5 12.6% American Indian / Alaska Native8,592 92.4% Asian2,426 95.0% Other race3,008 86.7% Two or more races9,524 90.3% White alone, not Hispanic / Latino5,057 88.9% Hispanic or LatinoMoved within same county 434 3.7% White / Caucasian82 2.2% Black or African American393 4.2% Asian40 1.6% Other race260 7.5% Two or more races415 3.9% White alone, not Hispanic / Latino267 4.7% Hispanic or LatinoMoved within same state 178 1.5% White / Caucasian8 0.2% Black or African American68 0.7% Asian135 5.3% Other race13 0.4% Two or more races164 1.6% White alone, not Hispanic / Latino119 2.1% Hispanic or LatinoMoved from different state 410 3.5% White / Caucasian111 2.9% Black or African American33 78.3% American Indian / Alaska Native61 0.7% Asian8 0.3% Other race57 1.6% Two or more races403 3.8% White alone, not Hispanic / Latino63 1.1% Hispanic or LatinoMoved from abroad 77 0.7% White13 0.3% Black or African American163 1.7% Asian63 1.8% Two or more races30 0.3% White alone, not Hispanic / Latino117 2.1% Hispanic or Latino
Children Nativity (place of birth) in Springfield
Children under 6 years - Living with two parents Both parents native 484 99.4% Native3 0.6% Foreign-bornBoth parents foreign-born 572 94.0% Native37 6.0% Foreign-bornOne native, one foreign-born parent 224 87.4% Native32 12.6% Foreign-bornChildren under 6 years - Living with one parent Native parent 246 100.0% NativeForeign-born parent 432 95.6% Native20 4.4% Foreign-bornChildren 6 to 17 years - Living with two parents Both parents native 789 100.0% NativeBoth parents foreign-born 1,259 86.9% Native189 13.1% Foreign-bornOne native, one foreign-born parent 440 100.0% NativeChildren 6 to 17 years - Living with one parent Native parent 193 100.0% NativeForeign-born parent 529 55.1% Native431 44.9% Foreign-born
Place of birth for residents in Springfield 6,871 Asia3,362 South Eastern Asia3,184 Americas3,153 Latin America2,096 South Central Asia1,857 Africa1,705 Central America1,412 South America1,097 Eastern Asia802 Eastern Africa723 China616 Europe448 Northern Africa314 Western Asia268 Eastern Europe216 Western Europe198 Middle Africa113 Western Africa71 Southern Europe59 Northern Europe35 Southern Africa34 Caribbean30 Northern America7 Oceania2,133 Vietnam996 Pakistan936 Philippines875 El Salvador630 Honduras625 China600 Bolivia485 Peru453 Ethiopia406 Bangladesh354 Korea318 India249 Eritrea208 Afghanistan200 Morocco194 Iraq164 Egypt147 Nepal139 Germany136 Thailand108 Cambodia98 Argentina86 Kenya83 Sudan77 Moldova76 Mexico72 Ecuador71 France69 Guatemala59 Ukraine59 Brazil54 Sierra Leone50 Hong Kong49 Colombia47 Taiwan46 Turkey45 Lebanon43 Panama40 England40 Ghana39 Bulgaria35 South Africa35 Greece34 Guyana30 Canada28 Poland24 Laos22 Czechoslovakia21 Indonesia20 Italy19 Russia19 Romania18 Japan16 Syria14 Spain13 Iran10 Jamaica10 Venezuela9 Nicaragua7 Nigeria7 Fiji5 Saudi Arabia5 Kazakhstan4 Belgium4 Jordan3 Zimbabwe
Grandparents responsible for own grandchildren in Springfield
Grandparents (30 to 59 years) White / Caucasian 5 17.0% Responsible for grandchildren26 83.0% Not responsible for grandchildrenBlack or African American 21 100.0% Not responsible for grandchildrenAsian 79 100.0% Not responsible for grandchildrenTwo or more races 8 100.0% Not responsible for grandchildrenWhite alone, not Hispanic / Latino 42 100.0% Not responsible for grandchildrenHispanic or Latino 10 36.3% Responsible for grandchildren18 63.7% Not responsible for grandchildrenGrandparents (60 years and over) White / Caucasian 7 10.7% Responsible for grandchildren60 89.3% Not responsible for grandchildrenBlack or African American 26 100.0% Not responsible for grandchildrenAsian 14 5.5% Responsible for grandchildren244 94.5% Not responsible for grandchildrenTwo or more races 84 100.0% Not responsible for grandchildrenWhite alone, not Hispanic / Latino 8 10.5% Responsible for grandchildren67 89.5% Not responsible for grandchildrenHispanic or Latino 60 100.0% Not responsible for grandchildren