Snoqualmie, WA (Washington) Houses and Residents
| Snoqualmie: | $964,781 |
| Washington: | $569,500 |
Total population: 12,630 (Urban population: 1,385 (all inside urban clusters), Rural population: 274 (all nonfarm))
Houses: 4,981 (4,687 occupied: 3,978 owner occupied, 703 renter occupied)
| % of renters here: | 15% |
| State: | 36% |
Housing density: 969 houses/condos per square mile
Median price asked for vacant for-sale houses and condos in 2022: $340,845.
Median contract rent in 2022: over $2,000 (lower quartile is $1,830, upper quartile is over $2,000)
Median rent asked for vacant for-rent units in 2022: $2,303
Median gross rent in Snoqualmie, WA in 2022: over $2,000
Housing units in Snoqualmie with a mortgage: 3,406 (410 second mortgage, 20 home equity loan, 310 both second mortgage and home equity loan)
Houses without a mortgage: 0
Median household income for houses/condos with a mortgage: $224,866
Median household income for apartments without a mortgage: $142,016
Median monthly housing costs: $3,104
Compare current foreclosures near Snoqualmie, WA:
| Photo | Address | Area | Beds / Baths | Price | Details |
|---|---|---|---|---|---|

|
#1
SE Ridge St
Snoqualmie, WA 98065
|
1,548 sq. feet
|
2 baths 3 beds |
show details | |

|
#2
SE Leitz St
Snoqualmie, WA 98065
|
2,950 sq. feet
|
2 baths 4 beds |
show details | |

|
#3
Douglas Ave SE
Snoqualmie, WA 98065
|
- sq. feet
|
- baths - beds |
show details | |

|
#4
SE Moses St
Snoqualmie, WA 98065
|
- sq. feet
|
- baths - beds |
show details | |

|
#5
254th Way SE
Maple Valley, WA 98038
|
3,120 sq. feet
|
2 baths 4 beds |
show details | |

|
#6
Wildwood Blvd SW
Issaquah, WA 98027
|
1,590 sq. feet
|
2 baths 3 beds |
show details | |

|
#7
115th Ct SE
Renton, WA 98056
|
2,970 sq. feet
|
2 baths 4 beds |
show details | |

|
#8
230th Way SE
Sammamish, WA 98075
|
3,036 sq. feet
|
3 baths 4 beds |
show details | |

|
#9
Lyons Ave NE
Renton, WA 98059
|
2,510 sq. feet
|
2 baths 3 beds |
show details | |

|
#10
320th Ave NE
Duvall, WA 98019
|
3,140 sq. feet
|
2 baths 3 beds |
show details |
| Photo | Address | Area | Beds / Baths | Price | Details |
|---|---|---|---|---|---|

|
#11
SE 170th St
Renton, WA 98058
|
960 sq. feet
|
1 baths 3 beds |
show details | |

|
#12
260th Ave SE
Maple Valley, WA 98038
|
- sq. feet
|
2 baths 4 beds |
show details | |

|
#13
NE 64th St
Redmond, WA 98053
|
1,540 sq. feet
|
1 baths 3 beds |
show details | |

|
#14
SE 47th Pl
Issaquah, WA 98029
|
2,610 sq. feet
|
2 baths 3 beds |
show details | |

|
#15
269th Ave SE
Maple Valley, WA 98038
|
2,660 sq. feet
|
2 baths 3 beds |
show details | |

|
#16
NE 13th Pl
Renton, WA 98059
|
3,190 sq. feet
|
2 baths 3 beds |
show details | |

|
#17
SE 14th St
Sammamish, WA 98075
|
3,520 sq. feet
|
3 baths 6 beds |
show details | |

|
#18
126th Pl SE
Renton, WA 98056
|
2,450 sq. feet
|
2 baths 4 beds |
show details | |

|
#19
SE 5th St
Sammamish, WA 98074
|
3,180 sq. feet
|
2 baths 4 beds |
show details | |

|
#20
Lake Alice Rd SE
Fall City, WA 98024
|
1,750 sq. feet
|
2 baths 3 beds |
show details |
| Photo | Address | Area | Beds / Baths | Price | Details |
|---|---|---|---|---|---|

|
#21
226th Pl NE
Sammamish, WA 98074
|
1,650 sq. feet
|
2 baths 3 beds |
show details | |

|
#22
NE 172nd St
Duvall, WA 98019
|
3,780 sq. feet
|
3 baths 4 beds |
show details | |

|
#23
Boxley Pl NE
North Bend, WA 98045
|
1,230 sq. feet
|
1 baths 3 beds |
show details | |

|
#24
185th Pl SE
Kent, WA 98042
|
2,550 sq. feet
|
2 baths 3 beds |
show details | |

|
#25
SE 24th Way
Sammamish, WA 98075
|
770 sq. feet
|
1 baths 2 beds |
show details | |

|
#26
NE 5th St
Renton, WA 98056
|
1,930 sq. feet
|
2 baths 3 beds |
show details | |

|
#27
Stilson Ave SE
North Bend, WA 98045
|
1,550 sq. feet
|
1 baths 4 beds |
show details | |

|
#28
SE 185th St
Renton, WA 98058
|
2,830 sq. feet
|
2 baths 3 beds |
show details | |

|
#29
196th Ave SE
Renton, WA 98058
|
1,340 sq. feet
|
1 baths 3 beds |
show details | |

|
#30
SE 49th Pl
Bellevue, WA 98006
|
3,740 sq. feet
|
4 baths 5 beds |
show details |
| Photo | Address | Area | Beds / Baths | Price | Details |
|---|---|---|---|---|---|

|
#31
186th Pl SE
Kent, WA 98042
|
1,230 sq. feet
|
2 baths 3 beds |
show details | |

|
#32
SE Petrovitsky Rd
Renton, WA 98058
|
1,530 sq. feet
|
1 baths 3 beds |
show details | |

|
#33
150th Ave SE
Bellevue, WA 98007
|
1,420 sq. feet
|
1 baths 4 beds |
show details | |

|
#34
SE Petrovitsky Rd
Renton, WA 98058
|
1,600 sq. feet
|
2 baths 3 beds |
show details | |

|
#35
164th Pl NE
Bellevue, WA 98008
|
990 sq. feet
|
1 baths 3 beds |
show details | |

|
#36
NE 1st Pl
Bellevue, WA 98008
|
1,300 sq. feet
|
1 baths 3 beds |
show details | |

|
#37
SE 256th St
Kent, WA 98042
|
2,800 sq. feet
|
3 baths 5 beds |
show details | |

|
#38
NE 8th St Apt E303
Bellevue, WA 98005
|
- sq. feet
|
1 baths 2 beds |
show details | |

|
#39
218th Ave SE
Black Diamond, WA 98010
|
1,290 sq. feet
|
1 baths 3 beds |
show details | |

|
#40
149th Ave SE
Bellevue, WA 98006
|
1,250 sq. feet
|
1 baths 3 beds |
show details |
| Photo | Address | Area | Beds / Baths | Price | Details |
|---|---|---|---|---|---|

|
#41
SE 244th Pl
Maple Valley, WA 98038
|
1,540 sq. feet
|
3 baths 3 beds |
show details | |

|
#42
NE 76th Pl
Redmond, WA 98053
|
1,520 sq. feet
|
1 baths 3 beds |
show details | |

|
#43
265th Ct SE
Ravensdale, WA 98051
|
3,380 sq. feet
|
2 baths 5 beds |
show details | |

|
#44
SE 185th St
Renton, WA 98058
|
2,830 sq. feet
|
2 baths 3 beds |
show details | |

|
#45
NE 2nd Pl
Bellevue, WA 98008
|
2,450 sq. feet
|
4 baths 3 beds |
show details | |

|
#46
SE 239th Pl
Maple Valley, WA 98038
|
1,720 sq. feet
|
3 baths 3 beds |
show details | |

|
#47
SE 244th St
Maple Valley, WA 98038
|
1,300 sq. feet
|
2 baths 3 beds |
show details | |

|
#48
SE 168th St
Renton, WA 98058
|
1,490 sq. feet
|
1 baths 4 beds |
show details | |

|
#49
Batten Rd NE
Duvall, WA 98019
|
1,380 sq. feet
|
1 baths 2 beds |
show details | |

|
Check over 1 million property listings on Foreclosure.com!
|
browse all offers | |||

Latest news about housing in Snoqualmie, WA collected exclusively by city-data.com from local newspapers, TV, and radio stations


Median year apartment built: 2002
Household type by relationship:
Households: 13,837- Male householders: 2,426 (241 living alone), Female householders: 2,137 (243 living alone)
3,517 spouses (3,461 opposite-sex spouses), 147 unmarried partners, (141 opposite-sex unmarried partners), 4,809 children (4,534 natural, 115 adopted, 158 stepchildren), 76 grandchildren, 27 brothers or sisters, 223 parents, 0 foster children, 205 other relatives, 267 non-relatives
Size of family households: 1,518 2-persons, 790 3-persons, 1,076 4-persons, 398 5-persons, 51 6-persons, 88 7-or-more-persons.
Size of nonfamily households: 521 1-person, 74 2-persons, 19 3-persons.
3,464 married couples with children.
616 single-parent households (60 men, 556 women).
82.2% of residents of Snoqualmie speak English at home.
1.5% of residents speak Spanish at home (75% speak English very well, 25% speak English well).
8.7% of residents speak other Indo-European language at home (85% speak English very well, 6% speak English well, 8% speak English not well).
5.4% of residents speak Asian or Pacific Island language at home (68% speak English very well, 25% speak English well, 5% speak English not well, 1% don't speak English at all).
0.4% of residents speak other language at home (100% speak English very well).
Foreign born population: 1,967 (14.2%)
(47.2% of them are naturalized citizens)
| Here: | 6.8 |
| State: | 6.5 |
| Here: | 5.9 |
| State: | 3.9 |

- Bedrooms in owner-occupied houses and condos in Snoqualmie, Washington
- 6no bedroom
- 331 bedroom
- 2322 bedrooms
- 1,5583 bedrooms
- 1,5864 bedrooms
- 5625+ bedrooms

- Bedrooms in renter-occupied apartments in Snoqualmie, Washington
- 19no bedroom
- 401 bedroom
- 2862 bedrooms
- 1983 bedrooms
- 1304 bedrooms
- 315+ bedrooms

- Cars and other vehicles available in Snoqualmie in owner-occupied houses/condos
- 41no vehicle
- 4851 vehicle
- 2,5002 vehicles
- 7033 vehicles
- 2174 vehicles
- 325+ vehicles

- Cars and other vehicles available in Snoqualmie in renter-occupied apartments
- 26no vehicle
- 3031 vehicle
- 2592 vehicles
- 573 vehicles
- 424 vehicles
- 175+ vehicles

- Rooms in owner-occupied houses in Snoqualmie, Washington
- 01 room
- 212 rooms
- 203 rooms
- 1534 rooms
- 7335 rooms
- 8126 rooms
- 6717 rooms
- 4428 rooms
- 1,1269+ rooms

- Rooms in renter-occupied apartments in Snoqualmie, Washington
- 51 room
- 132 rooms
- 753 rooms
- 1334 rooms
- 705 rooms
- 1526 rooms
- 507 rooms
- 638 rooms
- 1429+ rooms


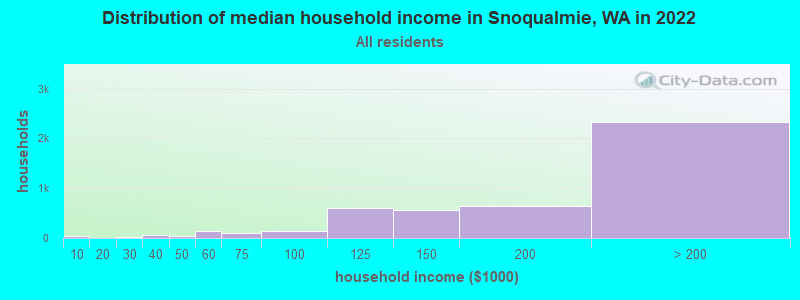
Snoqualmie, WA household income distribution

- 32Less than $10,000
- 20$20,000 to $29,999
- 61$30,000 to $39,999
- 39$40,000 to $49,999
- 145$50,000 to $59,999
- 105$60,000 to $74,999
- 142$75,000 to $99,999
- 611$100,000 to $124,999
- 572$125,000 to $149,999
- 651$150,000 to $199,999
- 2,330$200,000 or more
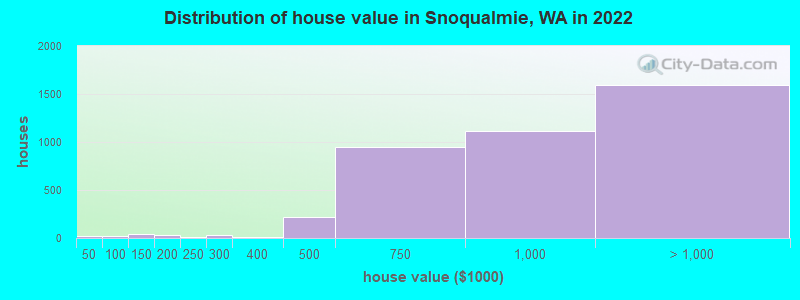
Home value of owner - occupied houses in 2022 in Snoqualmie, WA
-
- 12Less than $10,000
- 6$15,000 to $19,999
- 11$60,000 to $69,999
- 7$70,000 to $79,999
- 37$100,000 to $124,999
- 27$150,000 to $174,999
- 13$200,000 to $249,999
- 30$250,000 to $299,999
- 11$300,000 to $399,999
- 222$400,000 to $499,999
- 942$500,000 to $749,999
- 1,115$750,000 to $999,999
- 1,026$1,000,000 to $1,499,999
- 358$1,500,000 to $1,999,999
- 205$2,000,000 or more
Rent paid by renters in 2022 in Snoqualmie, WA
-
- 66$1,000 to $1,249
- 5$1,250 to $1,499
- 151$1,500 to $1,999
- 78$2,000 to $2,499
- 190$2,500 to $2,999
- 97$3,000 to $3,499
- 139$3,500 or more


Percentage of workers working in this county: 98.0%
Number of people working at home: 2,664 (33.8% of all workers)
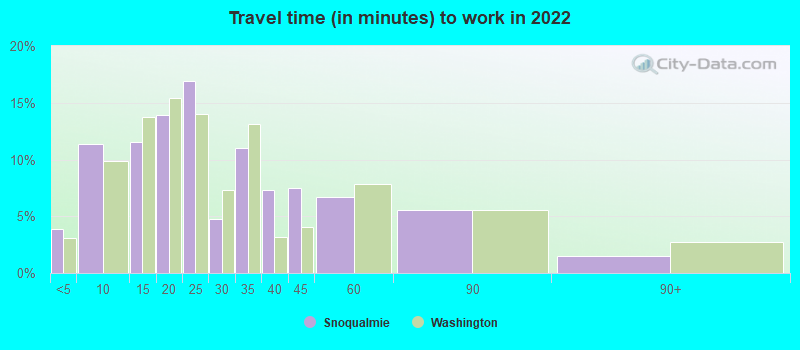
Travel time to work (commute)
- Less than 5 minutes: 185
- 5 to 9 minutes: 732
- 10 to 14 minutes: 395
- 15 to 19 minutes: 325
- 20 to 24 minutes: 540
- 25 to 29 minutes: 302
- 30 to 34 minutes: 600
- 35 to 39 minutes: 462
- 40 to 44 minutes: 489
- 45 to 59 minutes: 685
- 60 to 89 minutes: 465
- 90 or more minutes: 8
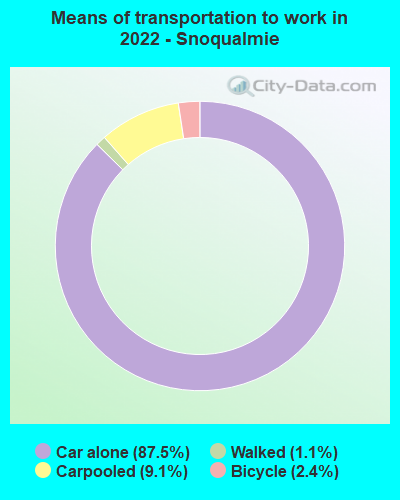
Means of transportation to work:
- Drove a car alone: 3,898 (59.1%)
- Carpooled: 387 (5.9%)
- Bicycle: 98 (1.5%)
- Walked: 42 (0.6%)
- Worked at home: 2,664 (40.4%)

- Unemployment by race in 2022
- Unemployment rate for White non-Hispanic residents
- 0.7%Males
- 4.1%Females
- Unemployment rate for Black residents
- 23.3%Males

- Year of entry for the foreign-born population in Snoqualmie, Washington
- 7732010 or later
- 6762000 to 2009
- 3251990 to 1999
- 141980 to 1989
- 211970 to 1979
- 21Before 1970

First ancestries reported:
- English: 1,035 (18.0%)
- American: 444 (7.7%)
- Irish: 298 (5.2%)
- German: 279 (4.8%)
- European: 236 (4.1%)
- French: 196 (3.4%)
- Swedish: 184 (3.2%)
- Norwegian: 110 (1.9%)
- Scotch-Irish: 98 (1.7%)
- Scandinavian: 91 (1.6%)
- Italian: 82 (1.4%)
- Russian: 66 (1.1%)
- Romanian: 54 (0.9%)
- Northern European: 52 (0.9%)
- British: 51 (0.9%)
- Egyptian: 43 (0.7%)
- Scottish: 41 (0.7%)
- Polish: 33 (0.6%)
- Welsh: 29 (0.5%)
- Jamaican: 24 (0.4%)
- Eastern European: 23 (0.4%)
- Dutch: 22 (0.4%)
- Danish: 14 (0.2%)
- Lithuanian: 11 (0.2%)
- Lebanese: 4 (0.07%)
- Palestinian: 4 (0.07%)
Most common places of birth for foreign-born residents (%):
| Snoqualmie: | 30.8% (605) |
| Washington: | 8.9% (101,353) |
| Snoqualmie: | 10.8% (212) |
| Washington: | 7.4% (84,470) |
| Snoqualmie: | 9.0% (177) |
| Washington: | 0.4% (4,951) |
| Snoqualmie: | 8.4% (165) |
| Washington: | 1.9% (21,540) |
| Snoqualmie: | 7.3% (144) |
| Washington: | 0.1% (802) |
| Snoqualmie: | 5.5% (108) |
| Washington: | 0.8% (9,359) |
| Snoqualmie: | 5.3% (104) |
| Washington: | 0.9% (9,937) |
| Snoqualmie: | 4.0% (78) |
| Washington: | 6.3% (71,661) |
| Snoqualmie: | 3.4% (67) |
| Washington: | 1.0% (10,943) |
| Snoqualmie: | 1.9% (38) |
| Washington: | 0.3% (3,083) |
| Snoqualmie: | 1.8% (35) |
| Washington: | 0.7% (7,568) |
| Snoqualmie: | 1.7% (34) |
| Washington: | 0.2% (2,506) |
| Snoqualmie: | 1.6% (32) |
| Washington: | 0.1% (670) |
Place of birth for U.S.-born residents:
- This state: 6,168
- Other state: 5,498
- Northeast: 600
- Midwest: 1,375
- South: 1,006
- West: 2,517
86.0% of Snoqualmie residents lived in the same house 1 years ago.
Out of people who lived in different houses, 44.1% lived in this county.
Out of people who lived in different counties, 42.1% lived in Washington.
| Snoqualmie: | 86.0% |
| State average: | 85.2% |
Education attainment for males 25 years and older:
- No schooling: 0
- Nursery to 4th grade: 0
- 5th and 6th grade: 0
- 7th and 8th grade: 0
- 9th grade: 0
- 10th grade: 0
- 11th grade: 18
- 12th grade, no diploma: 14
- High school graduate (or equivalency): 418
- Less than 1 year of college: 172
- Some college more than 1 year, no degree: 468
- Associate degree: 299
- Bachelor's degree: 2,053
- Master's degree: 810
- Professional school degree: 163
- Doctorate degree: 154

Education attainment for females 25 years and older:
- No schooling: 40
- Nursery to 4th grade: 16
- 5th and 6th grade: 0
- 7th and 8th grade: 0
- 9th grade: 0
- 10th grade: 6
- 11th grade: 0
- 12th grade, no diploma: 23
- High school graduate (or equivalency): 422
- Less than 1 year of college: 245
- Some college more than 1 year, no degree: 383
- Associate degree: 284
- Bachelor's degree: 1,924
- Master's degree: 1,063
- Professional school degree: 51
- Doctorate degree: 190


Housing units in structures:
- One, detached: 3,951
- One, attached: 582
- Two: 131
- 3 or 4: 133
- 5 to 9: 84
- 10 to 19: 34
- 20 to 49: 44
- 50 or more: 7
- Mobile homes: 6
- Boats, RVs, vans, etc.: 6
Housing units lacking complete kitchen facilities in 2022: 1.9%
House/condo owner moved in on average 7 years ago
Renter moved in on average 1 years ago

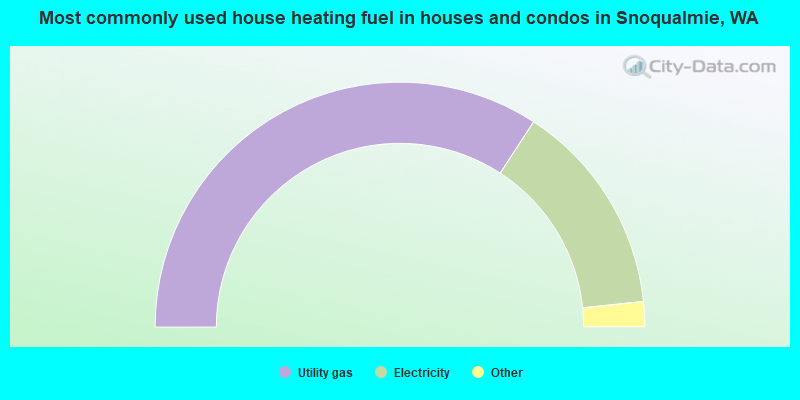
- 68.4%Utility gas
- 28.3%Electricity
- 2.0%Bottled, tank, or LP gas
- 0.7%Solar energy
- 0.3%Wood
- 0.3%No fuel used
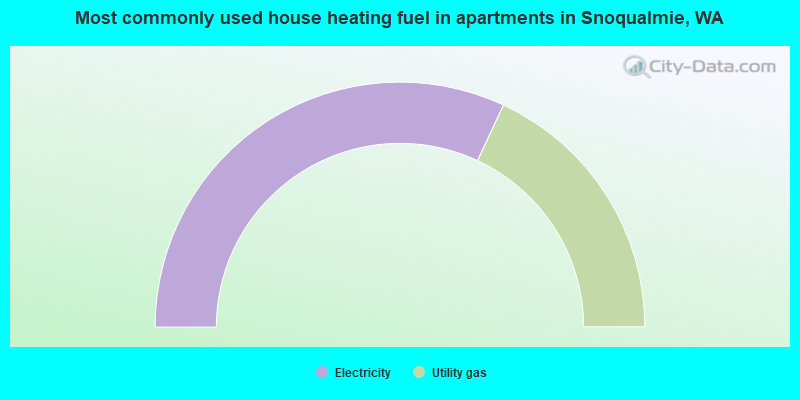
- 63.9%Electricity
- 36.1%Utility gas
Private vs. public school enrollment:
| Here: | 16.2% |
| Washington: | 12.4% |
| Here: | 10.6% |
| Washington: | 9.2% |
| Here: | 31.3% |
| Washington: | 16.5% |


