Snoqualmie, Washington
Snoqualmie: Snoqualmie Falls
Snoqualmie: Snoqualmie Falls
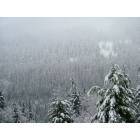
Snoqualmie: Snow in the mountains near Snoqualmie
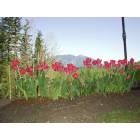
Snoqualmie: Tulips and Mount Si
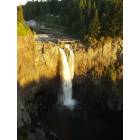
Snoqualmie: Snoqualmie Falls
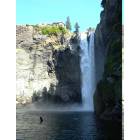
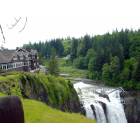
Snoqualmie: Summer time at the base of the falls + Hotel
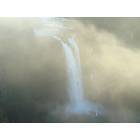
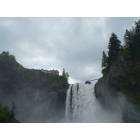
Snoqualmie: The Mist of Snoqualmie Falls
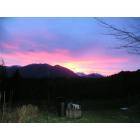
Snoqualmie: Sunrise over the valley
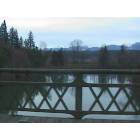
Snoqualmie: A neat little bridge in Snoqualmie
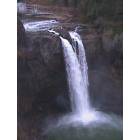
Snoqualmie: Snaqualmie Falls....Feel the mist
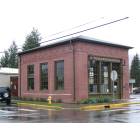
Snoqualmie: city hall
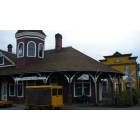
Snoqualmie: Snoqualmie Depot Museum
- add
your


Submit your own pictures of this city and show them to the world
- OSM Map
- General Map
- Google Map
- MSN Map

Population change since 2000: +735.1%
| Males: 6,716 | |
| Females: 6,905 |
| Median resident age: | 38.9 years |
| Washington median age: | 38.4 years |
Zip codes: 98065.
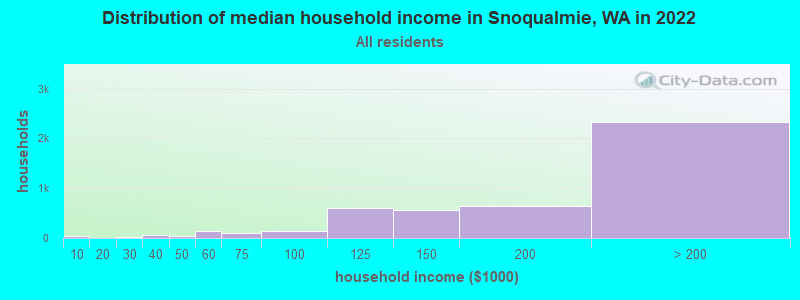
| Snoqualmie: | $186,217 |
| WA: | $91,306 |
Estimated per capita income in 2022: $77,984 (it was $22,239 in 2000)
Snoqualmie city income, earnings, and wages data
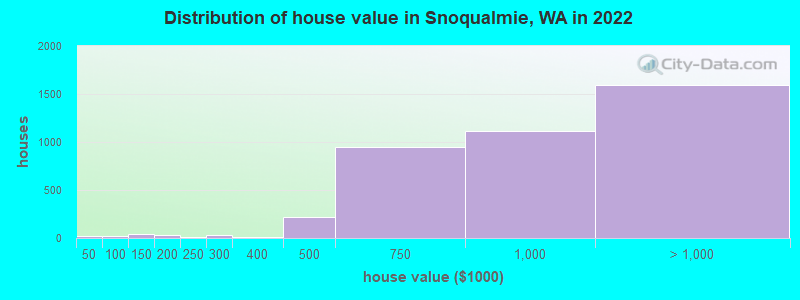
Estimated median house or condo value in 2022: $964,781 (it was $172,700 in 2000)
| Snoqualmie: | $964,781 |
| WA: | $569,500 |
Mean prices in 2022: all housing units: over $1,000,000; detached houses: over $1,000,000; townhouses or other attached units: $797,959; in 2-unit structures: $602,104; in 3-to-4-unit structures: $645,645; in 5-or-more-unit structures: $562,830; mobile homes: $271,735; occupied boats, rvs, vans, etc.: $635,138
Median gross rent in 2022: $2,949.
(0.3% for White Non-Hispanic residents, 1.0% for Hispanic or Latino residents, 1.0% for two or more races residents)
Detailed information about poverty and poor residents in Snoqualmie, WA


Compare current foreclosures near Snoqualmie, WA:
| Photo | Address | Area | Beds / Baths | Price | Details |
|---|---|---|---|---|---|

|
#1
SE Ridge St
Snoqualmie, WA 98065
|
1,548 sq. feet
|
2 baths 3 beds |
show details | |

|
#2
SE Leitz St
Snoqualmie, WA 98065
|
2,950 sq. feet
|
2 baths 4 beds |
show details | |

|
#3
Douglas Ave SE
Snoqualmie, WA 98065
|
- sq. feet
|
- baths - beds |
show details | |

|
#4
SE Moses St
Snoqualmie, WA 98065
|
- sq. feet
|
- baths - beds |
show details | |

|
#5
226th Pl NE
Sammamish, WA 98074
|
1,650 sq. feet
|
2 baths 3 beds |
show details | |

|
#6
SE 14th St
Sammamish, WA 98075
|
3,520 sq. feet
|
3 baths 6 beds |
show details | |

|
#7
186th Pl SE
Kent, WA 98042
|
1,230 sq. feet
|
2 baths 3 beds |
show details | |

|
#8
269th Ave SE
Maple Valley, WA 98038
|
2,660 sq. feet
|
2 baths 3 beds |
show details | |

|
#9
SE 200th St
Maple Valley, WA 98038
|
1,530 sq. feet
|
1 baths 3 beds |
show details | |

|
#10
SE 266th St
Kent, WA 98042
|
920 sq. feet
|
1 baths 3 beds |
show details |
| Photo | Address | Area | Beds / Baths | Price | Details |
|---|---|---|---|---|---|

|
#11
320th Ave NE
Duvall, WA 98019
|
3,140 sq. feet
|
2 baths 3 beds |
show details | |

|
#12
Lyons Ave NE
Renton, WA 98059
|
2,510 sq. feet
|
2 baths 3 beds |
show details | |

|
#13
NE 172nd St
Duvall, WA 98019
|
3,780 sq. feet
|
3 baths 4 beds |
show details | |

|
#14
205th Ave SE
Renton, WA 98059
|
2,130 sq. feet
|
2 baths 3 beds |
show details | |

|
#15
SE 24th Way
Sammamish, WA 98075
|
770 sq. feet
|
1 baths 2 beds |
show details | |

|
#16
230th Way SE
Sammamish, WA 98075
|
3,036 sq. feet
|
3 baths 4 beds |
show details | |

|
#17
185th Pl SE
Kent, WA 98042
|
2,550 sq. feet
|
2 baths 3 beds |
show details | |

|
#18
SE 170th St
Renton, WA 98058
|
960 sq. feet
|
1 baths 3 beds |
show details | |

|
#19
NE 5th St
Renton, WA 98056
|
1,930 sq. feet
|
2 baths 3 beds |
show details | |

|
#20
NE 64th St
Redmond, WA 98053
|
1,540 sq. feet
|
1 baths 3 beds |
show details |
| Photo | Address | Area | Beds / Baths | Price | Details |
|---|---|---|---|---|---|

|
#21
126th Pl SE
Renton, WA 98056
|
2,450 sq. feet
|
2 baths 4 beds |
show details | |

|
#22
254th Way SE
Maple Valley, WA 98038
|
3,120 sq. feet
|
2 baths 4 beds |
show details | |

|
#23
Wildwood Blvd SW
Issaquah, WA 98027
|
1,590 sq. feet
|
2 baths 3 beds |
show details | |

|
#24
SE 5th St
Sammamish, WA 98074
|
3,180 sq. feet
|
2 baths 4 beds |
show details | |

|
#25
Boxley Pl NE
North Bend, WA 98045
|
1,230 sq. feet
|
1 baths 3 beds |
show details | |

|
#26
Lake Alice Rd SE
Fall City, WA 98024
|
1,750 sq. feet
|
2 baths 3 beds |
show details | |

|
#27
SE Petrovitsky Rd
Renton, WA 98058
|
1,360 sq. feet
|
1 baths 3 beds |
show details | |

|
#28
SE 47th Pl
Issaquah, WA 98029
|
2,610 sq. feet
|
2 baths 3 beds |
show details | |

|
#29
Stilson Ave SE
North Bend, WA 98045
|
1,550 sq. feet
|
1 baths 4 beds |
show details | |

|
#30
NE 13th Pl
Renton, WA 98056
|
3,340 sq. feet
|
2 baths 4 beds |
show details |
| Photo | Address | Area | Beds / Baths | Price | Details |
|---|---|---|---|---|---|

|
#31
NE 19th St
Renton, WA 98056
|
2,740 sq. feet
|
2 baths 4 beds |
show details | |

|
#32
Shelton Ave NE
Renton, WA 98056
|
2,040 sq. feet
|
2 baths 5 beds |
show details | |

|
#33
Redmond Ave NE
Renton, WA 98056
|
1,540 sq. feet
|
1 baths 3 beds |
show details | |

|
#34
125th Ave SE
Renton, WA 98058
|
1,250 sq. feet
|
1 baths 3 beds |
show details | |

|
#35
172nd Ave SE
Kent, WA 98042
|
1,200 sq. feet
|
1 baths 3 beds |
show details | |

|
#36
N 28th Pl
Renton, WA 98056
|
1,850 sq. feet
|
2 baths 4 beds |
show details | |

|
#37
227th Pl SE
Maple Valley, WA 98038
|
1,570 sq. feet
|
3 baths 3 beds |
show details | |

|
#38
NE 50th St
Redmond, WA 98052
|
2,770 sq. feet
|
2 baths 3 beds |
show details | |

|
#39
SE 267th Pl
Kent, WA 98042
|
1,390 sq. feet
|
1 baths 4 beds |
show details | |

|
#40
NE 155th Pl
Duvall, WA 98019
|
2,410 sq. feet
|
2 baths 3 beds |
show details |
| Photo | Address | Area | Beds / Baths | Price | Details |
|---|---|---|---|---|---|

|
#41
143rd Ave SE
Renton, WA 98058
|
3,590 sq. feet
|
2 baths 3 beds |
show details | |

|
#42
Union Ave NE
Renton, WA 98059
|
940 sq. feet
|
1 baths 3 beds |
show details | |

|
#43
SE 265th Way
Maple Valley, WA 98038
|
1,010 sq. feet
|
1 baths 2 beds |
show details | |

|
#44
SE 273rd Ct
Maple Valley, WA 98038
|
1,720 sq. feet
|
2 baths 3 beds |
show details | |

|
#45
143rd Pl SE
Bellevue, WA 98007
|
1,620 sq. feet
|
2 baths 4 beds |
show details | |

|
#46
237th Pl SE
Maple Valley, WA 98038
|
3,110 sq. feet
|
2 baths 4 beds |
show details | |

|
#47
SE 284th St
Kent, WA 98042
|
1,830 sq. feet
|
3 baths 4 beds |
show details | |

|
#48
SE 269th St
Maple Valley, WA 98038
|
1,910 sq. feet
|
2 baths 4 beds |
show details | |

|
#49
NE 24th St
Renton, WA 98059
|
1,210 sq. feet
|
1 baths 3 beds |
show details | |

|
Check over 1 million property listings on Foreclosure.com!
|
browse all offers | |||


- 10,33374.7%White alone
- 1,54611.2%Asian alone
- 8796.4%Two or more races
- 6334.6%Hispanic
- 820.6%Black alone
- 710.5%Other race alone
- 50.04%American Indian alone
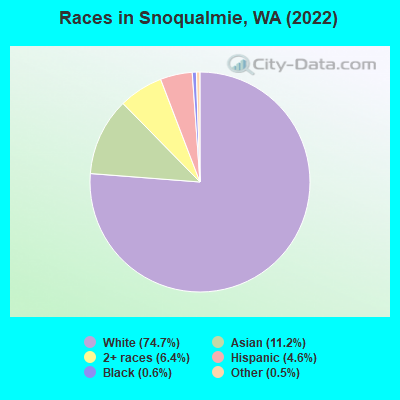
Races in Snoqualmie detailed stats: ancestries, foreign born residents, place of birth
According to our research of Washington and other state lists, there were 2 registered sex offenders living in Snoqualmie, Washington as of May 13, 2024.
The ratio of all residents to sex offenders in Snoqualmie is 6,467 to 1.
The ratio of registered sex offenders to all residents in this city is much lower than the state average.
Type |
2009 |
2010 |
2011 |
2012 |
2013 |
2014 |
2015 |
2016 |
2017 |
2018 |
2019 |
2020 |
2021 |
2022 |
|---|---|---|---|---|---|---|---|---|---|---|---|---|---|---|
| Murders (per 100,000) | 0 (0.0) | 0 (0.0) | 0 (0.0) | 0 (0.0) | 0 (0.0) | 0 (0.0) | 0 (0.0) | 0 (0.0) | 0 (0.0) | 0 (0.0) | 0 (0.0) | 0 (0.0) | 0 (0.0) | 0 (0.0) |
| Rapes (per 100,000) | 2 (20.5) | 0 (0.0) | 1 (9.2) | 0 (0.0) | 2 (16.8) | 1 (8.1) | 0 (0.0) | 1 (7.3) | 1 (7.3) | 1 (7.2) | 1 (7.1) | 1 (7.1) | 0 (0.0) | 0 (0.0) |
| Robberies (per 100,000) | 0 (0.0) | 2 (18.7) | 0 (0.0) | 0 (0.0) | 0 (0.0) | 1 (8.1) | 1 (7.6) | 0 (0.0) | 1 (7.3) | 1 (7.2) | 3 (21.2) | 0 (0.0) | 0 (0.0) | 1 (7.4) |
| Assaults (per 100,000) | 7 (71.6) | 5 (46.9) | 4 (36.9) | 2 (18.2) | 1 (8.4) | 8 (64.7) | 2 (15.2) | 2 (14.6) | 0 (0.0) | 1 (7.2) | 2 (14.1) | 4 (28.6) | 5 (36.0) | 0 (0.0) |
| Burglaries (per 100,000) | 11 (112.6) | 10 (93.7) | 19 (175.3) | 29 (263.9) | 17 (143.0) | 14 (113.3) | 19 (144.5) | 24 (175.0) | 13 (95.3) | 10 (71.7) | 15 (105.8) | 14 (100.1) | 33 (237.8) | 27 (199.7) |
| Thefts (per 100,000) | 131 (1,341) | 171 (1,603) | 112 (1,033) | 112 (1,019) | 65 (546.7) | 134 (1,084) | 135 (1,027) | 191 (1,393) | 127 (930.5) | 148 (1,061) | 145 (1,022) | 143 (1,022) | 222 (1,600) | 258 (1,908) |
| Auto thefts (per 100,000) | 10 (102.3) | 7 (65.6) | 13 (120.0) | 3 (27.3) | 8 (67.3) | 6 (48.5) | 12 (91.3) | 19 (138.6) | 9 (65.9) | 11 (78.9) | 10 (70.5) | 8 (57.2) | 34 (245.0) | 41 (303.2) |
| Arson (per 100,000) | 7 (71.6) | 2 (18.7) | 1 (9.2) | 1 (9.1) | 0 (0.0) | 1 (8.1) | 1 (7.6) | 1 (7.3) | 1 (7.3) | 2 (14.3) | 1 (7.1) | 0 (0.0) | 1 (7.2) | 1 (7.4) |
| City-Data.com crime index | 100.4 | 90.9 | 78.0 | 65.1 | 52.4 | 77.0 | 63.8 | 87.8 | 57.2 | 63.1 | 68.7 | 63.9 | 107.5 | 116.8 |
The City-Data.com crime index weighs serious crimes and violent crimes more heavily. Higher means more crime, U.S. average is 246.1. It adjusts for the number of visitors and daily workers commuting into cities.
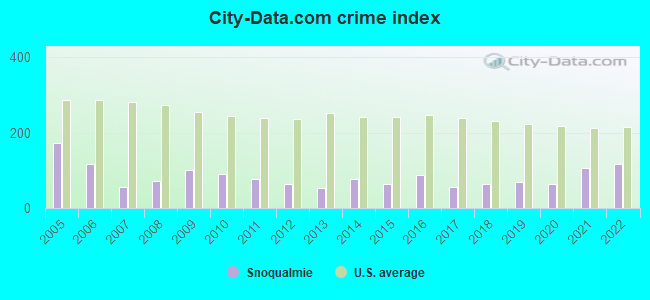
Crime rate in Snoqualmie detailed stats: murders, rapes, robberies, assaults, burglaries, thefts, arson
Full-time law enforcement employees in 2021, including police officers: 24 (20 officers - 19 male; 1 female).
| Officers per 1,000 residents here: | 1.44 |
| Washington average: | 1.35 |
 Recent articles from our blog. Our writers, many of them Ph.D. graduates or candidates, create easy-to-read articles on a wide variety of topics.


 | Commuting from Snoqualmie to Seattle (4 replies) |
| Snoqualmie Ridge vs Kirkland Finn Hill (4 replies) |
| Snoqualmie growth (22 replies) |
| Husband works in Work in West Seattle & I work in Snoqualmie Ridge where to buy house (10 replies) |
| Move to Mill Creek or to Snoqualmie? (4 replies) |
| Poulsbo/Kingston or Duvall or Snohomish/Cottage Lake or Snoqualmie/North Bend (6 replies) |
Latest news from Snoqualmie, WA collected exclusively by city-data.com from local newspapers, TV, and radio stations
Snoqualmie, WA City Guides:
Ancestries: English (16.6%), American (7.9%), Irish (5.0%), European (4.7%), German (4.7%), French (4.3%).
Current Local Time: PST time zone
Incorporated in 1903
Elevation: 410 feet
Land area: 5.14 square miles.
Population density: 2,649 people per square mile (average).
1,967 residents are foreign born (8.1% Asia, 4.0% Europe).
| This city: | 14.2% |
| Washington: | 14.9% |
Median real estate property taxes paid for housing units with mortgages in 2022: $7,800 (0.8%)
Median real estate property taxes paid for housing units with no mortgage in 2022: $7,787 (0.9%)
Nearest city with pop. 50,000+: Issaquah Plateau, WA (8.4 miles  , pop. 50,237).
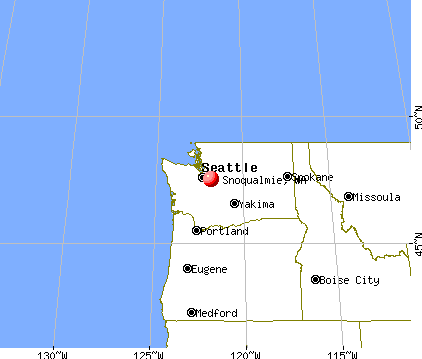
Nearest city with pop. 200,000+: East Seattle, WA (16.1 miles , pop. 480,100).
Nearest city with pop. 1,000,000+: Los Angeles, CA (947.4 miles , pop. 3,694,820).
Nearest cities:
), ), ), ), Latitude: 47.53 N, Longitude: 121.84 W
Area code commonly used in this area: 425
Property values in Snoqualmie, WA
Snoqualmie tourist attractions:
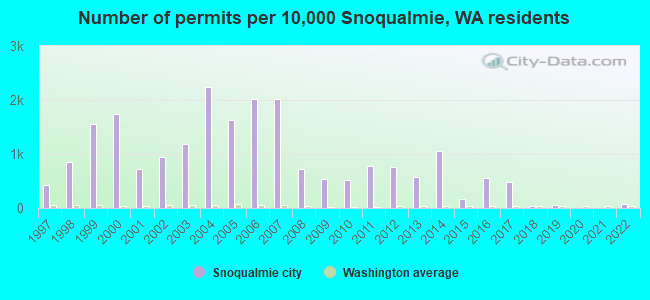
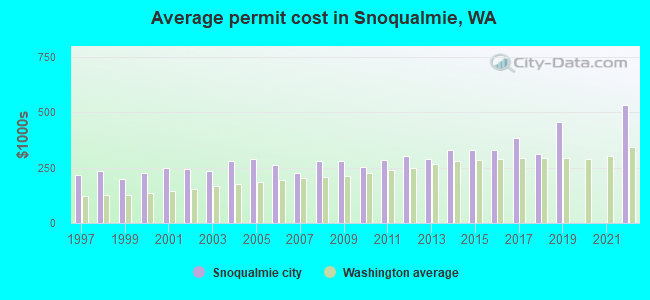
Single-family new house construction building permits:
- 2022: 11 buildings, average cost: $533,800
- 2019: 9 buildings, average cost: $457,000
- 2018: 5 buildings, average cost: $311,000
- 2017: 80 buildings, average cost: $385,500
- 2016: 91 buildings, average cost: $328,200
- 2015: 26 buildings, average cost: $330,300
- 2014: 173 buildings, average cost: $329,000
- 2013: 93 buildings, average cost: $290,900
- 2012: 125 buildings, average cost: $304,400
- 2011: 128 buildings, average cost: $283,300
- 2010: 86 buildings, average cost: $254,100
- 2009: 87 buildings, average cost: $279,200
- 2008: 119 buildings, average cost: $279,200
- 2007: 329 buildings, average cost: $223,500
- 2006: 330 buildings, average cost: $262,300
- 2005: 267 buildings, average cost: $291,200
- 2004: 366 buildings, average cost: $278,300
- 2003: 194 buildings, average cost: $233,700
- 2002: 155 buildings, average cost: $242,400
- 2001: 119 buildings, average cost: $246,800
- 2000: 284 buildings, average cost: $223,800
- 1999: 254 buildings, average cost: $196,700
- 1998: 140 buildings, average cost: $232,500
- 1997: 71 buildings, average cost: $219,300
| Here: | 3.5% |
| Washington: | 4.6% |
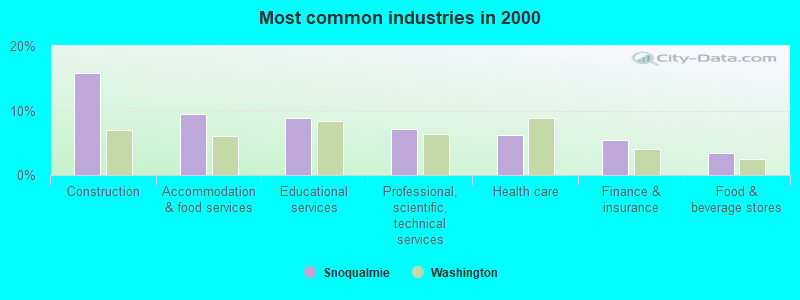
- Construction (15.8%)
- Accommodation & food services (9.4%)
- Educational services (8.8%)
- Professional, scientific, technical services (7.1%)
- Health care (6.3%)
- Finance & insurance (5.4%)
- Food & beverage stores (3.4%)
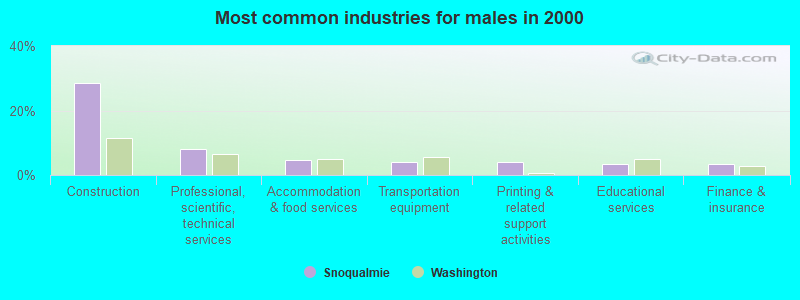
- Construction (28.4%)
- Professional, scientific, technical services (8.0%)
- Accommodation & food services (4.5%)
- Transportation equipment (4.1%)
- Printing & related support activities (4.1%)
- Educational services (3.4%)
- Finance & insurance (3.4%)
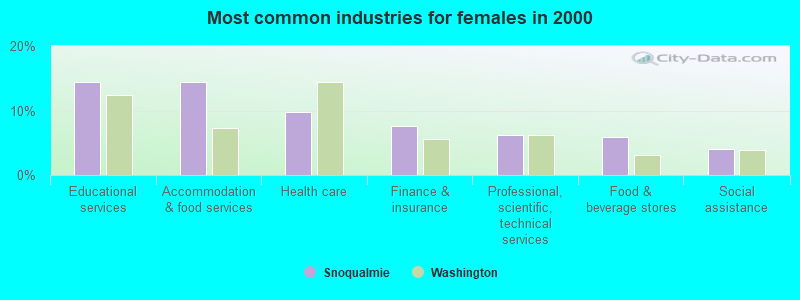
- Educational services (14.4%)
- Accommodation & food services (14.4%)
- Health care (9.7%)
- Finance & insurance (7.6%)
- Professional, scientific, technical services (6.1%)
- Food & beverage stores (5.9%)
- Social assistance (4.0%)
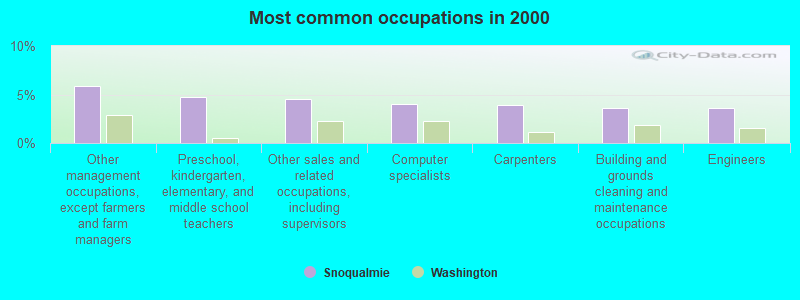
- Other management occupations, except farmers and farm managers (5.9%)
- Preschool, kindergarten, elementary, and middle school teachers (4.8%)
- Other sales and related occupations, including supervisors (4.5%)
- Computer specialists (4.1%)
- Carpenters (3.9%)
- Building and grounds cleaning and maintenance occupations (3.6%)
- Engineers (3.6%)

- Other management occupations, except farmers and farm managers (8.2%)
- Carpenters (7.7%)
- Computer specialists (6.8%)
- Construction traders workers except carpenters, electricians, painters, plumbers, and construction laborers (5.0%)
- Engineers (4.8%)
- Construction laborers (4.5%)
- Advertising, marketing, promotions, public relations, and sales managers (4.3%)
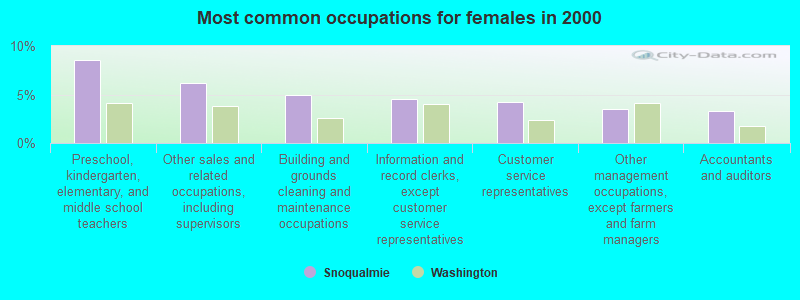
- Preschool, kindergarten, elementary, and middle school teachers (8.5%)
- Other sales and related occupations, including supervisors (6.1%)
- Building and grounds cleaning and maintenance occupations (5.0%)
- Information and record clerks, except customer service representatives (4.5%)
- Customer service representatives (4.3%)
- Other management occupations, except farmers and farm managers (3.5%)
- Accountants and auditors (3.3%)
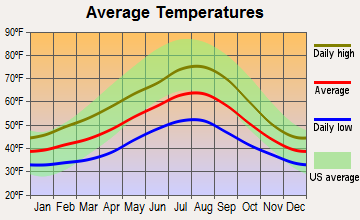
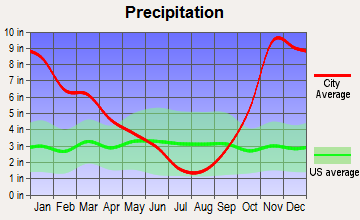
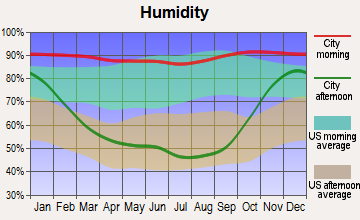
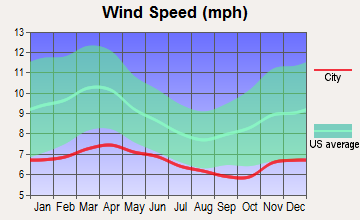
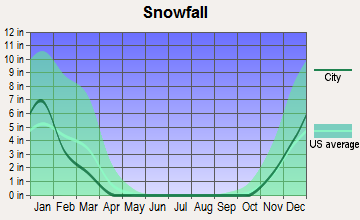
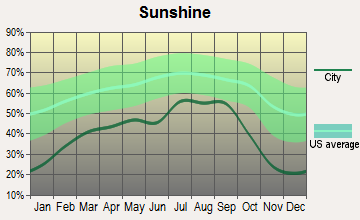
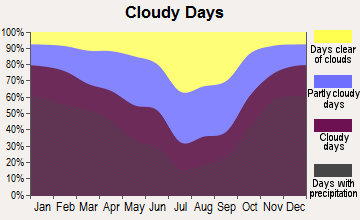
Average climate in Snoqualmie, Washington
Based on data reported by over 4,000 weather stations
|
|

(lower is better)

Air Quality Index (AQI) level in 2022 was 93.0. This is worse than average.
| City: | 93.0 |
| U.S.: | 72.6 |
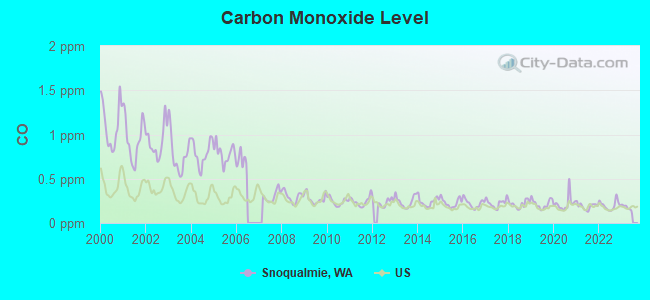
Carbon Monoxide (CO) [ppm] level in 2022 was 0.200. This is better than average. Closest monitor was 17.4 miles away from the city center.
| City: | 0.200 |
| U.S.: | 0.251 |
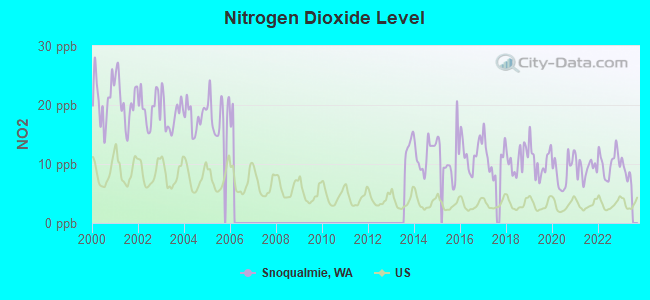
Nitrogen Dioxide (NO2) [ppb] level in 2022 was 10.2. This is significantly worse than average. Closest monitor was 17.1 miles away from the city center.
| City: | 10.2 |
| U.S.: | 5.1 |
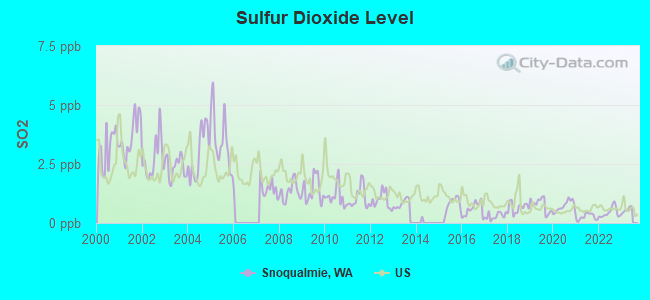
Sulfur Dioxide (SO2) [ppb] level in 2022 was 0.443. This is significantly better than average. Closest monitor was 17.1 miles away from the city center.
| City: | 0.443 |
| U.S.: | 1.515 |
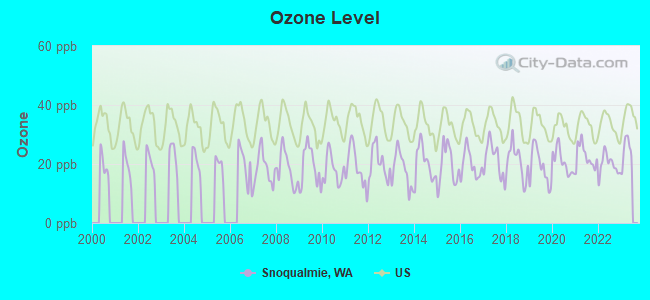
Ozone [ppb] level in 2022 was 19.7. This is significantly better than average. Closest monitor was 4.5 miles away from the city center.
| City: | 19.7 |
| U.S.: | 33.3 |
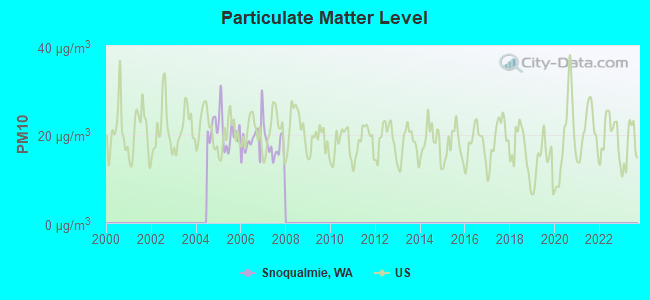
Particulate Matter (PM10) [µg/m3] level in 2007 was 17.2. This is about average. Closest monitor was 20.5 miles away from the city center.
| City: | 17.2 |
| U.S.: | 19.2 |
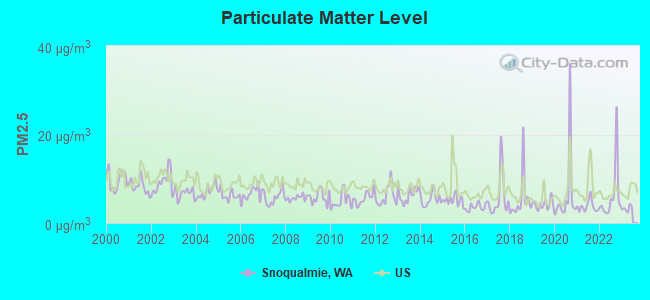
Particulate Matter (PM2.5) [µg/m3] level in 2022 was 6.15. This is better than average. Closest monitor was 4.5 miles away from the city center.
| City: | 6.15 |
| U.S.: | 8.11 |
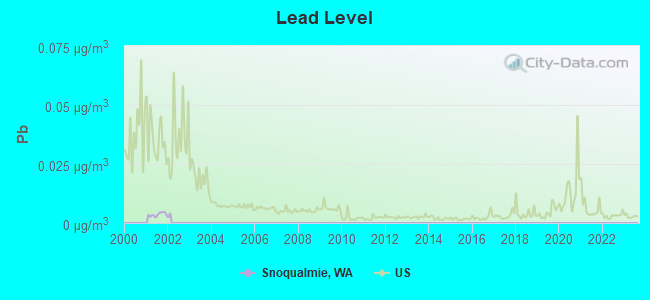
Lead (Pb) [µg/m3] level in 2001 was 0.00360. This is significantly better than average. Closest monitor was 10.4 miles away from the city center.
| City: | 0.00360 |
| U.S.: | 0.00931 |
Earthquake activity:
Snoqualmie-area historical earthquake activity is significantly above Washington state average. It is 1326% greater than the overall U.S. average.On 4/13/1949 at 19:55:42, a magnitude 7.0 (7.0 UK, Class: Major, Intensity: VIII - XII) earthquake occurred 36.4 miles away from Snoqualmie center, causing $80,000,000 total damage
On 2/28/2001 at 18:54:32, a magnitude 6.8 (6.5 MB, 6.6 MS, 6.8 MW, Class: Strong, Intensity: VII - IX) earthquake occurred 46.1 miles away from Snoqualmie center, causing $2,000,000,000 total damage and $305,000,000 insured losses
On 2/28/2001 at 18:54:32, a magnitude 6.8 (6.8 MD, Depth: 32.2 mi) earthquake occurred 49.1 miles away from the city center
On 4/29/1965 at 15:28:43, a magnitude 6.6 (6.6 UK) earthquake occurred 27.3 miles away from Snoqualmie center, causing $28,000,000 total damage
On 7/3/1999 at 01:43:54, a magnitude 5.8 (5.4 MB, 5.5 MS, 5.8 MW, 5.3 ME, Depth: 25.2 mi, Class: Moderate, Intensity: VI - VII) earthquake occurred 72.9 miles away from Snoqualmie center
On 5/3/1996 at 04:04:22, a magnitude 5.5 (5.2 MB, 5.3 MD, 5.5 ML, Depth: 2.5 mi) earthquake occurred 21.4 miles away from Snoqualmie center
Magnitude types: body-wave magnitude (MB), duration magnitude (MD), energy magnitude (ME), local magnitude (ML), surface-wave magnitude (MS), moment magnitude (MW)
Natural disasters:
The number of natural disasters in King County (30) is a lot greater than the US average (15).Major Disasters (Presidential) Declared: 27
Emergencies Declared: 1
Causes of natural disasters: Floods: 21, Storms: 16, Mudslides: 11, Landslides: 9, Winter Storms: 7, Earthquakes: 2, Heavy Rains: 2, Winds: 2, Hurricane: 1, Snow: 1, Volcanic Eruption: 1, Other: 1 (Note: some incidents may be assigned to more than one category).
Hospitals and medical centers in Snoqualmie:
- SNOQUALMIE VALLEY HOSPITAL (Government - Hospital District or Authority, 9575 ETHAN WADE WAY SE)
- NKC SNOQUALMIE RIDGE KIDNEY CENTER (35131 SE DOUGLAS ST SUITE 113)
Other hospitals and medical centers near Snoqualmie:
- MOUNT SI TRANSITIONAL HEALTH CENTER (Nursing Home, about 4 miles away; NORTH BEND, WA)
- NORTH BEND NURSING HOME (Nursing Home, about 4 miles away; NORTH BEND, WA)
- ISSAQUAH NURSING AND REHABILITATION CENTER (Nursing Home, about 9 miles away; ISSAQUAH, WA)
- ISSAQUAH VILLA CARE CENTER (Nursing Home, about 9 miles away; ISSAQUAH, WA)
- MARIANWOOD (Nursing Home, about 10 miles away; ISSAQUAH, WA)
- PROVIDENCE MARIANWOOD (Nursing Home, about 10 miles away; ISSAQUAH, WA)
- BELLEVUE CENTER NURSING FACILITY (Nursing Home, about 15 miles away; BELLEVUE, WA)
Heliports located in Snoqualmie:
Colleges/universities with over 2000 students nearest to Snoqualmie:
- Bellevue College (about 15 miles; Bellevue, WA; Full-time enrollment: 10,940)
- Renton Technical College (about 16 miles; Renton, WA; FT enrollment: 2,549)
- Lake Washington Institute of Technology (about 20 miles; Kirkland, WA; FT enrollment: 2,947)
- Green River Community College (about 22 miles; Auburn, WA; FT enrollment: 7,425)
- Cascadia Community College (about 23 miles; Bothell, WA; FT enrollment: 2,238)
- University of Washington-Bothell Campus (about 23 miles; Bothell, WA; FT enrollment: 3,902)
- Seattle University (about 23 miles; Seattle, WA; FT enrollment: 5,808)
Public high schools in Snoqualmie:
- ECHO GLEN SCHOOL (Location: 33010 SE 99TH ST, Grades: 5-12)
- MOUNT SI HIGH SCHOOL (Location: 8651 MEADOWBROOK WAY SE, Grades: 9-12)
- SNOQUALMIE ACCESS (Location: 8001 SILVA AVE SE, Grades: PK-12)
- SVSD OPEN DOORS (Location: 8001 SILVA AVE SE, Grades: 9-12)
Public elementary/middle schools in Snoqualmie:
- SNOQUALMIE ELEMENTARY (Location: 755 PARK ST, Grades: PK-5)
- CASCADE VIEW ELEMENTARY SCHOOL (Location: 34816 SE RIDGE STREET, Grades: KG-5)
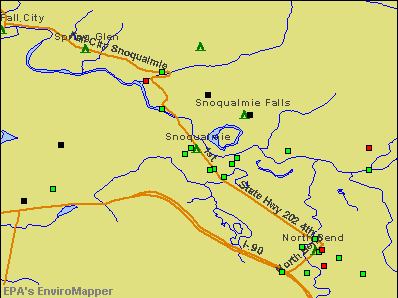
Points of interest:
Notable locations in Snoqualmie: Mount Si Golf Course (A), Snoqualmie Ridge Golf Course (B), Snoqualmie Fire Department (C). Display/hide their locations on the map
Lake: Meadowbrook Slough (A). Display/hide its location on the map
Creek: Kimball Creek (A). Display/hide its location on the map
Tourist attractions: Snoqualmie Valley Railroad (Cultural Attractions- Events- & Facilities; 28625 Southeast King Street) (1), Northwest Railway Museum (Cultural Attractions- Events- & Facilities; 38625 Southeast King Street) (2). Display/hide their approximate locations on the map
Hotel: House in the Trees B & B at Bethabara Farms (35909 Southeast 96th Way) (1). Display/hide its approximate location on the map
Birthplace of: J. D. Beach - Motorcyclist, Larry Springer - Politician.
| This city: | 3.0 people |
| Washington: | 2.5 people |
| This city: | 82.1% |
| Whole state: | 64.4% |
| This city: | 5.8% |
| Whole state: | 7.7% |
Likely homosexual households (counted as self-reported same-sex unmarried-partner households)
- Lesbian couples: 0.3% of all households
- Gay men: 0.3% of all households
Banks with branches in Snoqualmie (2011 data):
- KeyBank National Association: Snoqualmie Ridge Branch at 7917 Center Blvd Se, branch established on 2002/08/12. Info updated 2008/03/03: Bank assets: $86,198.8 mil, Deposits: $64,214.8 mil, headquarters in Cleveland, OH, positive income, Commercial Lending Specialization, 1067 total offices, Holding Company: Keycorp
For population 15 years and over in Snoqualmie:
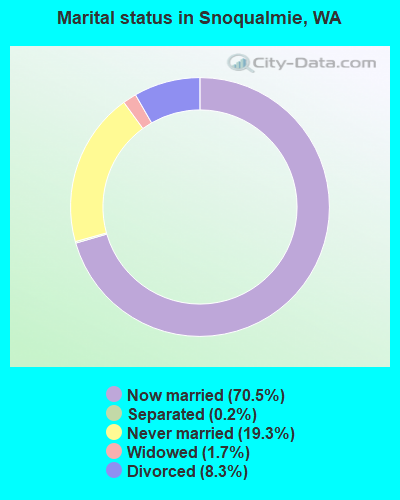
- Never married: 19.3%
- Now married: 70.5%
- Separated: 0.2%
- Widowed: 1.7%
- Divorced: 8.3%
For population 25 years and over in Snoqualmie:
- High school or higher: 98.8%
- Bachelor's degree or higher: 68.1%
- Graduate or professional degree: 25.0%
- Unemployed: 9.0%
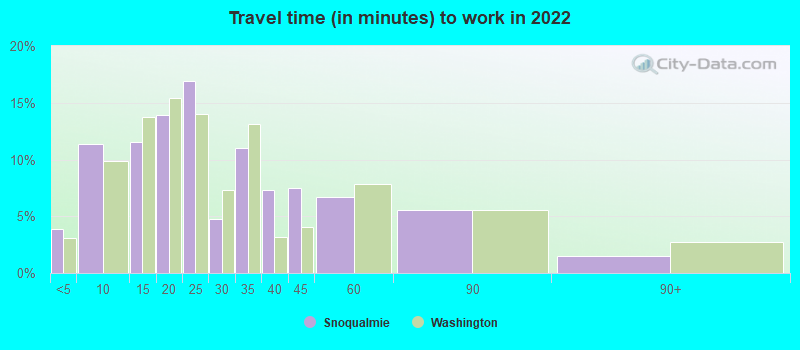
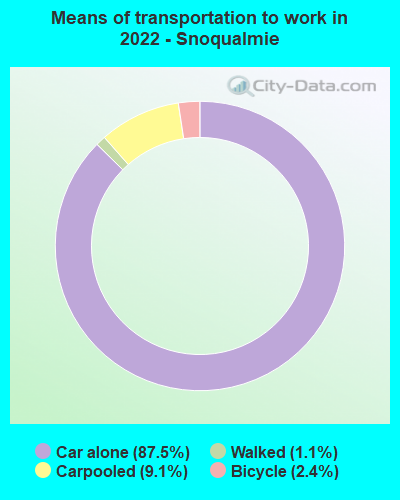
- Mean travel time to work (commute): 19.0 minutes

| Here: | 8.0 |
| Washington average: | 11.6 |
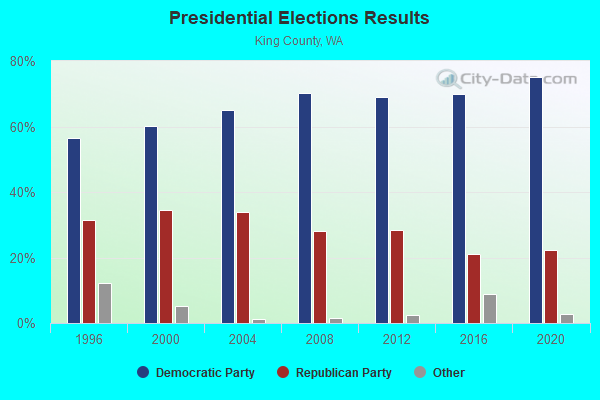
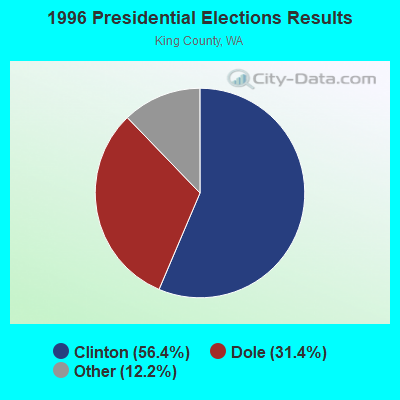
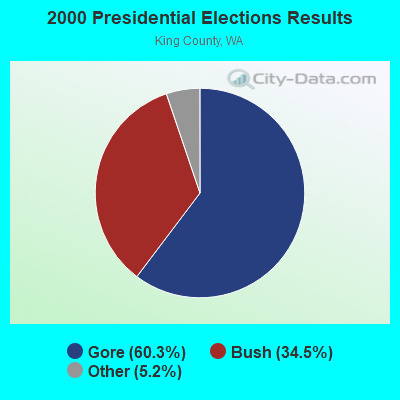
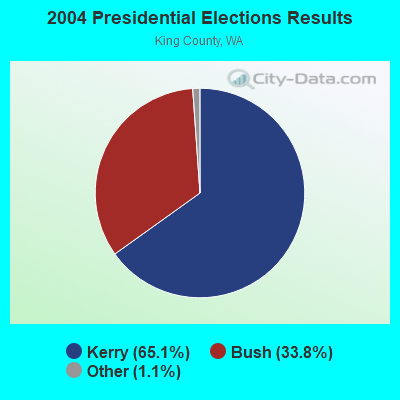
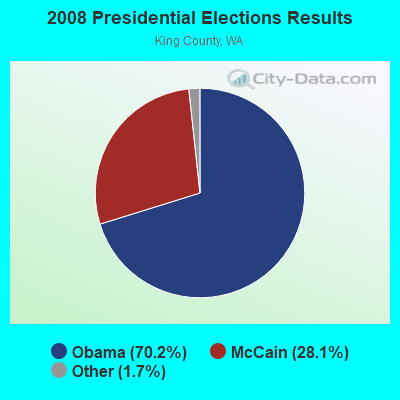
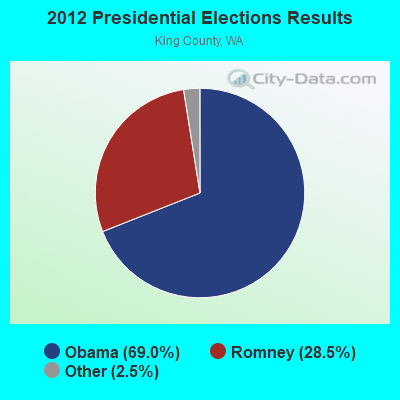
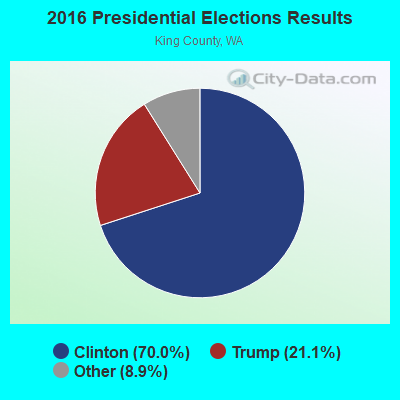
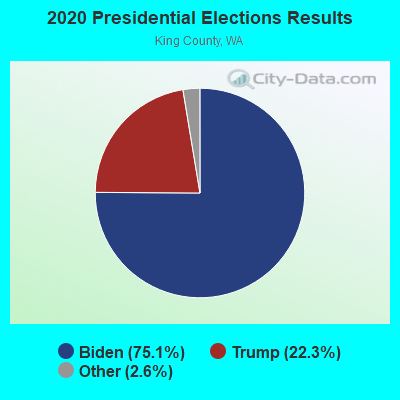
Graphs represent county-level data. Detailed 2008 Election Results
Religion statistics for Snoqualmie, WA (based on King County data)
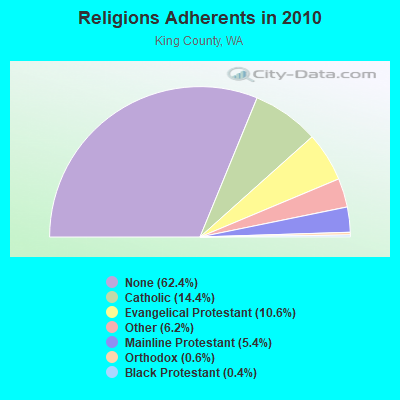
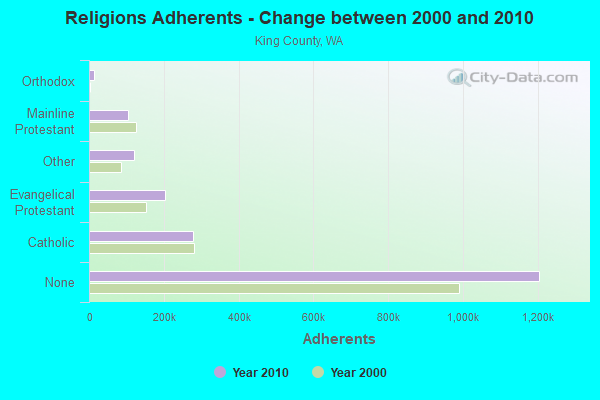
| Religion | Adherents | Congregations |
|---|---|---|
| Catholic | 278,340 | 71 |
| Evangelical Protestant | 204,523 | 711 |
| Other | 119,713 | 329 |
| Mainline Protestant | 104,806 | 304 |
| Orthodox | 12,257 | 20 |
| Black Protestant | 7,030 | 24 |
| None | 1,204,580 | - |
Food Environment Statistics:
| King County: | 2.37 / 10,000 pop. |
| Washington: | 2.06 / 10,000 pop. |
| King County: | 0.16 / 10,000 pop. |
| State: | 0.19 / 10,000 pop. |
| Here: | 1.19 / 10,000 pop. |
| Washington: | 1.18 / 10,000 pop. |
| King County: | 2.16 / 10,000 pop. |
| Washington: | 2.67 / 10,000 pop. |
| King County: | 10.95 / 10,000 pop. |
| Washington: | 8.26 / 10,000 pop. |
| This county: | 6.7% |
| State: | 7.7% |
| This county: | 20.5% |
| Washington: | 25.7% |
| King County: | 14.6% |
| State: | 13.9% |
Health and Nutrition:
| Snoqualmie: | 53.4% |
| Washington: | 49.9% |
| Snoqualmie: | 53.9% |
| State: | 47.2% |
| Snoqualmie: | 27.6 |
| State: | 28.4 |
| This city: | 20.2% |
| Washington: | 20.9% |
| This city: | 7.3% |
| Washington: | 10.5% |
| Here: | 6.9 |
| Washington: | 6.8 |
| Snoqualmie: | 30.4% |
| Washington: | 32.8% |
| Here: | 61.6% |
| Washington: | 56.8% |
| Here: | 83.2% |
| Washington: | 79.4% |
More about Health and Nutrition of Snoqualmie, WA Residents
| Local government employment and payroll (March 2022) | |||||
| Function | Full-time employees | Monthly full-time payroll | Average yearly full-time wage | Part-time employees | Monthly part-time payroll |
|---|---|---|---|---|---|
| Police Protection - Officers | 24 | $367,637 | $183,819 | 0 | $0 |
| Financial Administration | 15 | $108,719 | $86,975 | 0 | $0 |
| Firefighters | 14 | $127,997 | $109,712 | 0 | $0 |
| Other and Unallocable | 12 | $89,902 | $89,902 | 1 | $2,466 |
| Parks and Recreation | 8 | $57,290 | $85,935 | 0 | $0 |
| Sewerage | 7 | $52,345 | $89,734 | 0 | $0 |
| Other Government Administration | 7 | $80,552 | $138,089 | 7 | $8,744 |
| Streets and Highways | 4 | $31,788 | $95,364 | 0 | $0 |
| Police - Other | 3 | $19,012 | $76,048 | 0 | $0 |
| Fire - Other | 1 | $5,818 | $69,816 | 0 | $0 |
| Judicial and Legal | 1 | $16,786 | $201,432 | 1 | $4,385 |
| Totals for Government | 96 | $957,846 | $119,731 | 9 | $15,595 |
Snoqualmie government finances - Expenditure in 2021 (per resident):
- Construction - Regular Highways: $670,000 ($49.19)
Natural Resources - Other: $450,000 ($33.04)
Health - Other: $13,000 ($0.95)
Parks and Recreation: $10,000 ($0.73)
- Current Operations - Police Protection: $6,184,000 ($454.00)
Sewerage: $3,820,000 ($280.45)
Central Staff Services: $3,227,000 ($236.91)
Local Fire Protection: $3,026,000 ($222.16)
Water Utilities: $2,229,000 ($163.64)
Parks and Recreation: $2,197,000 ($161.30)
Financial Administration: $1,587,000 ($116.51)
Regular Highways: $1,318,000 ($96.76)
Housing and Community Development: $770,000 ($56.53)
General - Other: $766,000 ($56.24)
Natural Resources - Other: $607,000 ($44.56)
Judicial and Legal Services: $327,000 ($24.01)
Correctional Institutions: $224,000 ($16.45)
Health - Other: $111,000 ($8.15)
Public Welfare - Other: $98,000 ($7.19)
- General - Interest on Debt: $1,009,000 ($74.08)
- Other Capital Outlay - Water Utilities: $1,166,000 ($85.60)
Sewerage: $1,156,000 ($84.87)
Natural Resources - Other: $458,000 ($33.62)
Regular Highways: $139,000 ($10.20)
Parks and Recreation: $3,000 ($0.22)
- Total Salaries and Wages: $11,009,000 ($808.24)
- Water Utilities - Interest on Debt: $455,000 ($33.40)
Snoqualmie government finances - Revenue in 2021 (per resident):
- Charges - Sewerage: $8,169,000 ($599.74)
Other: $4,208,000 ($308.93)
Parks and Recreation: $55,000 ($4.04)
- Local Intergovernmental - Other: $505,000 ($37.08)
- Miscellaneous - Interest Earnings: $355,000 ($26.06)
Rents: $109,000 ($8.00)
Fines and Forfeits: $38,000 ($2.79)
General Revenue - Other: $9,000 ($0.66)
- Revenue - Water Utilities: $4,200,000 ($308.35)
- State Intergovernmental - Highways: $852,000 ($62.55)
Other: $649,000 ($47.65)
General Local Government Support: $196,000 ($14.39)
Health and Hospitals: $1,000 ($0.07)
- Tax - Property: $8,375,000 ($614.86)
Public Utilities Sales: $2,901,000 ($212.98)
General Sales and Gross Receipts: $2,828,000 ($207.62)
Documentary and Stock Transfer: $1,316,000 ($96.62)
Occupation and Business License - Other: $833,000 ($61.16)
Motor Vehicle License: $298,000 ($21.88)
Other License: $207,000 ($15.20)
Other Selective Sales: $97,000 ($7.12)
Amusements Sales: $2,000 ($0.15)
Snoqualmie government finances - Debt in 2021 (per resident):
- Long Term Debt - Beginning Outstanding - Unspecified Public Purpose: $41,216,000 ($3025.92)
Outstanding Unspecified Public Purpose: $39,641,000 ($2910.29)
Retired Unspecified Public Purpose: $2,500,000 ($183.54)
Issue, Unspecified Public Purpose: $925,000 ($67.91)
6.69% of this county's 2021 resident taxpayers lived in other counties in 2020 ($106,002 average adjusted gross income)
| Here: | 6.69% |
| Washington average: | 7.53% |
0.02% of residents moved from foreign countries ($181 average AGI)
King County: 0.02% Washington average: 0.05%
Top counties from which taxpayers relocated into this county between 2020 and 2021:
| from Snohomish County, WA | |
| from Pierce County, WA | |
| from Los Angeles County, CA |
7.71% of this county's 2020 resident taxpayers moved to other counties in 2021 ($123,052 average adjusted gross income)
| Here: | 7.71% |
| Washington average: | 7.40% |
0.01% of residents moved to foreign countries ($183 average AGI)
King County: 0.01% Washington average: 0.04%
Top counties to which taxpayers relocated from this county between 2020 and 2021:
| to Snohomish County, WA | |
| to Pierce County, WA | |
| to Maricopa County, AZ |
| Businesses in Snoqualmie, WA | ||||
| Name | Count | Name | Count | |
|---|---|---|---|---|
| FedEx | 2 | True Value | 1 | |
| Papa John's Pizza | 1 | U-Haul | 1 | |
| Starbucks | 1 | UPS | 1 | |
| Subway | 1 | |||
Strongest AM radio stations in Snoqualmie:
- KIXI (880 AM; 50 kW; MERCER ISLAND/SEATTL, WA; Owner: BELLEVUE RADIO, INC.)
- KIRO (710 AM; 50 kW; SEATTLE, WA; Owner: ENTERCOM SEATTLE LICENSE, LLC)
- KTTH (770 AM; 50 kW; SEATTLE, WA; Owner: ENTERCOM SEATTLE LICENSE, LLC)
- KGNW (820 AM; 50 kW; BURIEN-SEATTLE, WA; Owner: INSPIRATION MEDIA, INC.)
- KOMO (1000 AM; 50 kW; SEATTLE, WA; Owner: FISHER BROADCASTING - SEATTLE RADIO, L.L.C.)
- KYCW (1090 AM; 50 kW; SEATTLE, WA; Owner: INFINITY RADIO SUBSIDIARY OPERATIONS INC.)
- KRKO (1380 AM; 50 kW; EVERETT, WA; Owner: S-R BROADCASTING, CO.)
- KJR (950 AM; 50 kW; SEATTLE, WA)
- KNWX (1210 AM; 28 kW; AUBURN-FEDERAL WAY, WA; Owner: ENTERCOM SEATTLE LICENSE, LLC)
- KKOL (1300 AM; 50 kW; SEATTLE, WA; Owner: INSPIRATION MEDIA, INC.)
- KKNW (1150 AM; 10 kW; SEATTLE, WA; Owner: ORCA RADIO, INC.)
- KRIZ (1420 AM; 10 kW; RENTON, WA; Owner: KRIZ BROADCASTING, INC.)
- KYIZ (1620 AM; 10 kW; RENTON, WA; Owner: KRIZ BROADCASTING, INC.)
Strongest FM radio stations in Snoqualmie:
- KZOK-FM (102.5 FM; SEATTLE, WA; Owner: INFINITY RADIO SUBSIDIARY OPERATIONS INC.)
- KMPS-FM (94.1 FM; SEATTLE, WA; Owner: INFINITY RADIO SUBSIDIARY OPERATIONS INC.)
- KBKS (106.1 FM; TACOMA, WA; Owner: INFINITY RADIO SUBSIDIARY OPERATIONS INC.)
- KING-FM (98.1 FM; SEATTLE, WA; Owner: CLASSIC RADIO, INC.)
- KLSY-FM (92.5 FM; BELLEVUE, WA; Owner: BELLEVUE RADIO INC.)
- KPLU-FM (88.5 FM; TACOMA, WA; Owner: PACIFIC LUTHERAN UNIVERSITY, INC.)
- KWJZ (98.9 FM; SEATTLE, WA; Owner: ORCA RADIO, INC.)
- KBSG-FM (97.3 FM; TACOMA, WA; Owner: ENTERCOM SEATTLE LICENSE, LLC)
- KMTT (103.7 FM; TACOMA, WA; Owner: ENTERCOM SEATTLE LICENSE, LLC)
- KNDD (107.7 FM; SEATTLE, WA; Owner: ENTERCOM SEATTLE LICENSE, LLC)
- KYPT (96.5 FM; SEATTLE, WA; Owner: INFINITY RADIO SUBSIDIARY OPERATIONS INC.)
- KJR-FM (95.7 FM; SEATTLE, WA; Owner: ACKERLEY MEDIA GROUP, INC.)
- KUBE (93.3 FM; SEATTLE, WA; Owner: ACKERLEY MEDIA GROUP, INC.)
- KPLZ-FM (101.5 FM; SEATTLE, WA; Owner: FISHER BROADCASTING - SEATTLE RADIO, L.L.C.)
- KNHC (89.5 FM; SEATTLE, WA; Owner: SEATTLE PUBLIC SCHOOLS)
- K201EX (88.1 FM; GREENWATER, WA; Owner: CALVARY CHAPEL OF TWIN FALLS, INC.)
- KISW (99.9 FM; SEATTLE, WA; Owner: ENTERCOM SEATTLE LICENSE, LLC)
- KQBZ (100.7 FM; SEATTLE, WA; Owner: ENTERCOM SEATTLE LICENSE, LLC)
- KRWM (106.9 FM; BREMERTON, WA; Owner: SEASCAPE RADIO, INC.)
- KCMS (105.3 FM; EDMONDS, WA; Owner: CRISTA MINISTRIES, INC.)
TV broadcast stations around Snoqualmie:
- KHCV (Channel 45; SEATTLE, WA; Owner: NORTH PACIFIC INTERNATIONAL TELEVISION, INC.)
- KWPX (Channel 33; BELLEVUE, WA; Owner: PAXSON COMMUNICATIONS LICENSE COMPANY, LLC)
- KWDK (Channel 56; TACOMA, WA; Owner: PUGET SOUND EDUCATIONAL TV, INC.)
- KSTW (Channel 11; TACOMA, WA; Owner: UPN TELEVISION STATIONS INC.)
- KING-TV (Channel 5; SEATTLE, WA; Owner: KING BROADCASTING COMPANY)
- K58DP (Channel 58; SEATTLE, WA; Owner: WORD OF GOD FELLOWSHIP, INC.)
- KTWB-TV (Channel 22; SEATTLE, WA; Owner: TRIBUNE TELEVISION HOLDINGS, INC.)
- KWOG (Channel 51; BELLEVUE, WA; Owner: AFRICAN-AMERICAN BROADCASTING CO.OF BELLEVUE, INC.)
- KCTS-TV (Channel 9; SEATTLE, WA; Owner: KCTS TELEVISION)
- KOMO-TV (Channel 4; SEATTLE, WA; Owner: FISHER BROADCASTING - SEATTLE TV, L.L.C.)
- KIRO-TV (Channel 7; SEATTLE, WA; Owner: KIRO-TV HOLDINGS, INC.)
- K57HB (Channel 57; EUREKA, CA; Owner: MS COMMUNICATIONS, LLC)
- KONG-TV (Channel 16; EVERETT, WA; Owner: KONG-TV, INC.)
- K68DL (Channel 68; SEATTLE, WA; Owner: THREE ANGELS BROADCASTING NETWORK)
- K03FA (Channel 3; ISSAQUAH, ETC., WA; Owner: KING CTY. T.V. RECPT. DIST. #2)
- K10LA (Channel 10; ISSAQUAH, ETC., WA; Owner: KING CTY. T.V. RECPT. DIST. #2)
- Snoqualmie, Washington
- Fatal accident count10
- Vehicles involved in fatal accidents15
- Fatal accidents involving drunk persons:3
- Fatalities11
- Persons involved in fatal accidents20
- Pedestrians involved in fatal accidents2
- Washington average
- Fatal accident count4237
- Vehicles involved in fatal accidents6378
- Fatal accidents involving drunk persons1746
- Fatalities4703
- Persons involved in fatal accidents10660
- Pedestrians involved in fatal accidents677
- National Bridge Inventory (NBI) Statistics
- 28Number of bridges
- 351ft / 107mTotal length
- $85,588,000Total costs
- 357,113Total average daily traffic
- 47,589Total average daily truck traffic

- New bridges - historical statistics
- 11910-1919
- 31920-1929
- 11930-1939
- 11940-1949
- 31950-1959
- 61960-1969
- 91970-1979
- 21980-1989
- 11990-1999
- 12000-2009
FCC Registered Cell Phone Towers:
1 (See the full list of FCC Registered Cell Phone Towers in Snoqualmie)FCC Registered Antenna Towers:
30 (See the full list of FCC Registered Antenna Towers)FCC Registered Broadcast Land Mobile Towers:
14 (See the full list of FCC Registered Broadcast Land Mobile Towers in Snoqualmie, WA)FCC Registered Microwave Towers:
14 (See the full list of FCC Registered Microwave Towers in this town)FCC Registered Paging Towers:
2 (See the full list of FCC Registered Paging Towers)FCC Registered Amateur Radio Licenses:
147 (See the full list of FCC Registered Amateur Radio Licenses in Snoqualmie)FAA Registered Aircraft:
4- Aircraft: ANDERSON DARIN D VANS RV-9A (Category: Land, Seats: 2, Weight: Up to 12,499 Pounds), Engine: LYCOMING IO-360-M1B (180 HP) (Reciprocating)
N-Number: 1605A, N1605A, N-1605A, Serial Number: 92153, Year manufactured: 2015, Airworthiness Date: 03/02/2015, Certificate Issue Date: 10/09/2014
Registrant (Individual): Darin D Anderson, 9110 Jacobia Ave Se, Snoqualmie, WA 98065 - Aircraft: CIRRUS DESIGN CORP SR22T (Category: Land, Seats: 5, Weight: Up to 12,499 Pounds), Engine: CONT MOTOR TSIO-550-K (315 HP) (Reciprocating)
N-Number: 183X, N183X, N-183X, Serial Number: 1479, Year manufactured: 2017, Airworthiness Date: 01/11/2017, Certificate Issue Date: 08/15/2019
Registrant (LLC): Lapa Consulting LLC, 7126 Saint Andrews Ln Se, Snoqualmie, WA 98065 - Aircraft: LAPA CONSULTING LLC CCX-2000 (Category: Amphibian, Seats: 2, Weight: Up to 12,499 Pounds), Engine: AEROSPORT CC363I (187 HP) (Reciprocating)
N-Number: 6598B, N6598B, N-6598B, Serial Number: CCX-2000-0035, Year manufactured: 2019, Airworthiness Date: 01/02/2019, Certificate Issue Date: 11/30/2018
Registrant (LLC): Lapa Consulting LLC, 7126 Saint Andrews Ln Se, Snoqualmie, WA 98065 - Aircraft: COURTNEY FRIZT J 162F (Category: Land, Seats: 2, Weight: Up to 12,499 Pounds), Engine: BOMBARDIER ROTAX (ALL) (Reciprocating)
N-Number: 82018, N82018, N-82018, Serial Number: 6067, Year manufactured: 1995, Airworthiness Date: 06/12/1995
Registrant (Individual): Pending Registration, 35332 Se Center St, Snoqualmie, WA 98065
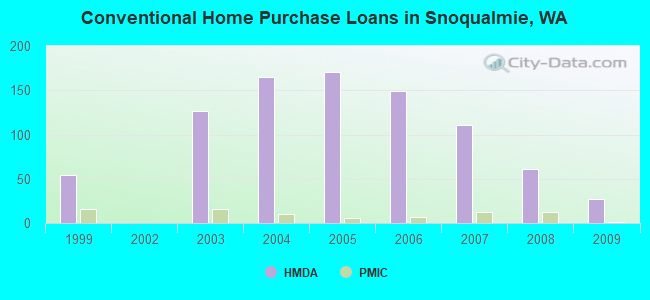
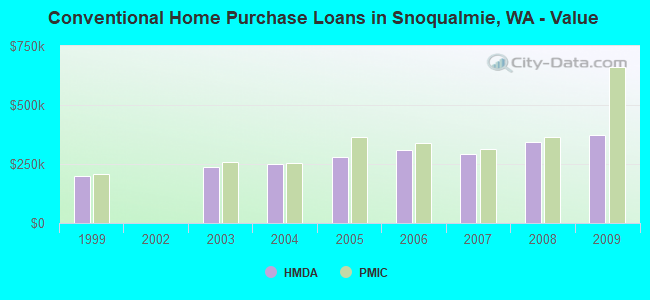
| Home Mortgage Disclosure Act Aggregated Statistics For Year 2009 (Based on 3 partial tracts) | ||||||||||
| A) FHA, FSA/RHS & VA Home Purchase Loans | B) Conventional Home Purchase Loans | C) Refinancings | D) Home Improvement Loans | F) Non-occupant Loans on < 5 Family Dwellings (A B C & D) | ||||||
|---|---|---|---|---|---|---|---|---|---|---|
| Number | Average Value | Number | Average Value | Number | Average Value | Number | Average Value | Number | Average Value | |
| LOANS ORIGINATED | 24 | $377,523 | 27 | $371,369 | 173 | $315,912 | 2 | $121,320 | 5 | $289,770 |
| APPLICATIONS APPROVED, NOT ACCEPTED | 2 | $395,130 | 4 | $273,690 | 15 | $319,162 | 0 | $0 | 0 | $0 |
| APPLICATIONS DENIED | 3 | $298,223 | 3 | $361,913 | 43 | $325,356 | 1 | $56,650 | 3 | $199,707 |
| APPLICATIONS WITHDRAWN | 4 | $382,478 | 5 | $374,760 | 36 | $347,099 | 0 | $0 | 1 | $191,960 |
| FILES CLOSED FOR INCOMPLETENESS | 1 | $258,120 | 1 | $257,380 | 5 | $279,656 | 0 | $0 | 0 | $0 |
Detailed HMDA statistics for the following Tracts: 0326.02 , 0327.02, 0327.03
| Private Mortgage Insurance Companies Aggregated Statistics For Year 2009 (Based on 3 partial tracts) | ||||
| A) Conventional Home Purchase Loans | B) Refinancings | |||
|---|---|---|---|---|
| Number | Average Value | Number | Average Value | |
| LOANS ORIGINATED | 1 | $661,980 | 3 | $330,927 |
| APPLICATIONS APPROVED, NOT ACCEPTED | 1 | $242,390 | 0 | $0 |
| APPLICATIONS DENIED | 0 | $0 | 1 | $276,050 |
| APPLICATIONS WITHDRAWN | 0 | $0 | 0 | $0 |
| FILES CLOSED FOR INCOMPLETENESS | 0 | $0 | 0 | $0 |
Detailed PMIC statistics for the following Tracts: 0326.02 , 0327.02, 0327.03
2002 - 2018 National Fire Incident Reporting System (NFIRS) incidents
- Fire incident types reported to NFIRS in Snoqualmie, WA
- 24460.7%Structure Fires
- 9724.1%Outside Fires
- 4811.9%Mobile Property/Vehicle Fires
- 133.2%Other
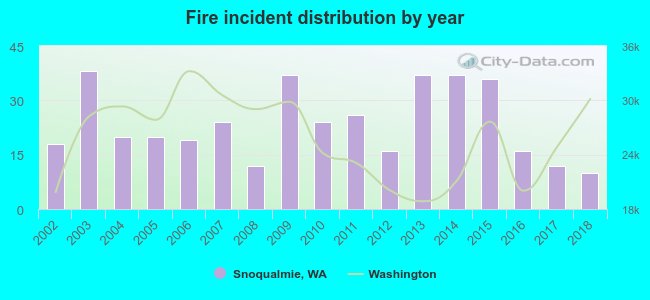 Based on the data from the years 2002 - 2018 the average number of fires per year is 24. The highest number of reported fires - 38 took place in 2003, and the least - 10 in 2018. The data has a declining trend.
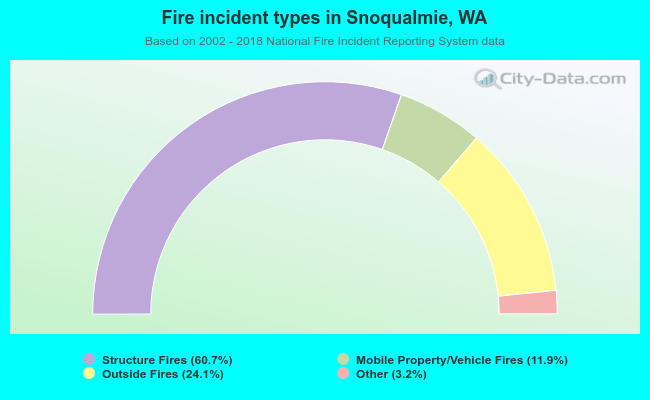 When looking into fire subcategories, the most reports belonged to: Structure Fires (60.7%), and Outside Fires (24.1%).
| Most common first names in Snoqualmie, WA among deceased individuals | ||
| Name | Count | Lived (average) |
|---|---|---|
| John | 19 | 77.4 years |
| William | 16 | 79.4 years |
| James | 12 | 80.6 years |
| Robert | 12 | 78.0 years |
| Mary | 10 | 75.7 years |
| George | 9 | 82.1 years |
| Charles | 9 | 77.9 years |
| Richard | 8 | 66.0 years |
| Walter | 8 | 82.8 years |
| Virginia | 7 | 78.0 years |
| Most common last names in Snoqualmie, WA among deceased individuals | ||
| Last name | Count | Lived (average) |
|---|---|---|
| Smith | 9 | 73.5 years |
| Anderson | 8 | 84.2 years |
| Johnson | 7 | 75.3 years |
| Wallace | 6 | 78.2 years |
| Nelson | 6 | 68.8 years |
| Carlson | 5 | 70.0 years |
| Vezzoni | 5 | 78.0 years |
| Davis | 5 | 73.4 years |
| Peterson | 5 | 68.0 years |
| Gere | 5 | 77.6 years |
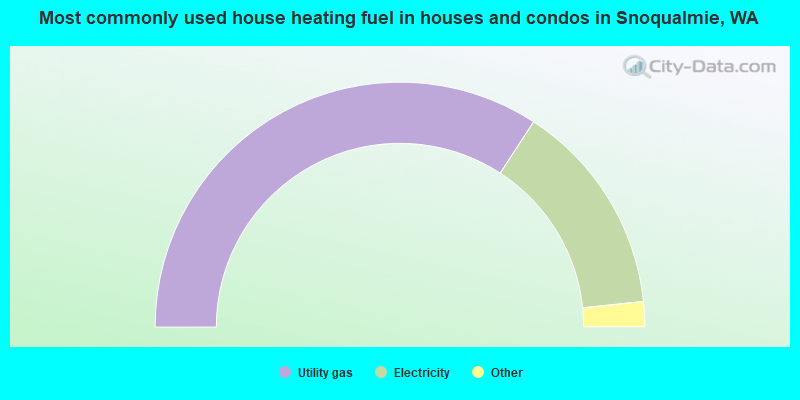
- 68.4%Utility gas
- 28.3%Electricity
- 2.0%Bottled, tank, or LP gas
- 0.7%Solar energy
- 0.3%Wood
- 0.3%No fuel used
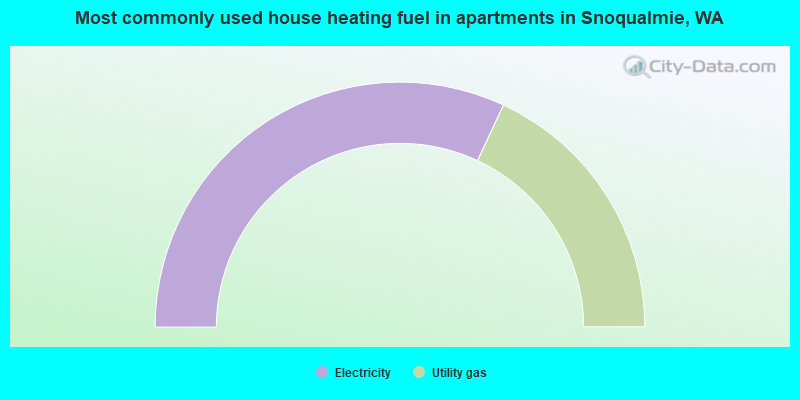
- 63.9%Electricity
- 36.1%Utility gas
Snoqualmie compared to Washington state average:
- Median household income above state average.
- Median house value above state average.
- Hispanic race population percentage above state average.
- Foreign-born population percentage significantly above state average.
- Renting percentage below state average.
- Length of stay since moving in above state average.
- House age significantly below state average.
- Number of college students significantly above state average.
- Percentage of population with a bachelor's degree or higher significantly above state average.
Snoqualmie on our top lists:
- #12 on the list of "Top 100 cities with highest median household income and median resident age less than 35"
- #18 on the list of "Top 101 cities with largest percentage of females in occupations: management occupations (population 5,000+)"
- #19 on the list of "Top 101 cities with largest percentage of males in industries: information (population 5,000+)"
- #28 on the list of "Top 101 cities with most building permits per 10,000 residents (population 5,000+)"
- #32 on the list of "Top 100 fastest growing cities from 2000 to 2014"
- #51 on the list of "Top 101 cities with largest percentage of females in industries: management of companies and enterprises (population 5,000+)"
- #53 on the list of "Top 101 cities with largest percentage of females in industries: professional, scientific, and technical services (population 5,000+)"
- #56 on the list of "Top 101 cities with largest percentage of females in industries: construction (population 5,000+)"
- #61 on the list of "Top 101 cities with largest percentage of females in occupations: legal occupations (population 5,000+)"
- #82 on the list of "Top 101 cities with largest percentage of males in industries: wholesale trade (population 5,000+)"
- #5 on the list of "Top 101 counties with the most Mainline Protestant congregations"
- #8 on the list of "Top 101 counties with the lowest Ozone (1-hour) air pollution readings in 2012 (ppm)"
- #9 on the list of "Top 101 counties with the most Other congregations"
- #11 on the list of "Top 101 counties with the most Mainline Protestant adherents"
- #11 on the list of "Top 101 counties with the highest percentage of residents that exercised in the past month"

|
|
Total of 749 patent applications in 2008-2024.