Snellville, GA (Georgia) Houses and Residents
| Snellville: | $322,327 |
| Georgia: | $297,400 |
Total population: 19,439 (Urban population: 14,956, Rural population: 0)
Houses: 7,549 (6,982 occupied: 5,560 owner occupied, 1,424 renter occupied)
| % of renters here: | 20% |
| State: | 34% |
Housing density: 781 houses/condos per square mile
Median price asked for vacant for-sale houses and condos in 2022: $494,100.
Median contract rent in 2022: $1,684 (lower quartile is $1,252, upper quartile is $1,939)
Median rent asked for vacant for-rent units in 2022: $1,159
Median gross rent in Snellville, GA in 2022: $1,940
Housing units in Snellville with a mortgage: 3,716 (261 second mortgage, 10 home equity loan, 202 both second mortgage and home equity loan)
Houses without a mortgage: 26
Median household income for houses/condos with a mortgage: $102,057
Median household income for apartments without a mortgage: $83,840
Median monthly housing costs: $1,494
Compare current foreclosures in Snellville, GA:
| Photo | Address | Area | Beds / Baths | Price | Details |
|---|---|---|---|---|---|

|
#1
Cranbrook Glen Ln
Snellville, GA 30078
|
3,979 sq. feet
|
3 baths 5 beds |
$749,900
|
show details |

|
#2
Prairie Dr
Snellville, GA 30039
|
2,336 sq. feet
|
2 baths 4 beds |
show details | |

|
#3
Madison Farm Way
Snellville, GA 30039
|
1,534 sq. feet
|
2 baths 3 beds |
show details | |

|
#4
Megan Carly Way
Snellville, GA 30039
|
3,056 sq. feet
|
2 baths 4 beds |
show details | |

|
#5
Ash Tree St
Snellville, GA 30039
|
2,762 sq. feet
|
2 baths 4 beds |
show details | |

|
#6
Concourse Trl
Snellville, GA 30039
|
2,934 sq. feet
|
2 baths 4 beds |
show details | |

|
#7
Hill Gate Ct
Snellville, GA 30039
|
4,241 sq. feet
|
3 baths 4 beds |
show details | |

|
#8
Hillsborough Dr
Snellville, GA 30039
|
2,303 sq. feet
|
2 baths 4 beds |
show details | |

|
#9
Yosemite Park Ln
Snellville, GA 30039
|
2,864 sq. feet
|
2 baths 5 beds |
show details | |

|
#10
Brownwood Dr
Snellville, GA 30078
|
2,336 sq. feet
|
2 baths 3 beds |
show details |
| Photo | Address | Area | Beds / Baths | Price | Details |
|---|---|---|---|---|---|

|
#11
James Wade Dr
Snellville, GA 30039
|
1,960 sq. feet
|
2 baths 3 beds |
show details | |

|
#12
Tower View Trl
Snellville, GA 30039
|
3,334 sq. feet
|
3 baths 4 beds |
show details | |

|
#13
Ash Tree St
Snellville, GA 30039
|
2,955 sq. feet
|
3 baths 5 beds |
show details | |

|
#14
Cooper Gayle Dr
Snellville, GA 30078
|
2,630 sq. feet
|
3 baths 6 beds |
show details | |

|
#15
Willow Bend Dr
Snellville, GA 30078
|
2,280 sq. feet
|
2 baths 3 beds |
show details | |

|
#16
Raptor Pl
Snellville, GA 30039
|
1,279 sq. feet
|
2 baths 3 beds |
show details | |

|
#17
Ashly Brooke Dr
Snellville, GA 30078
|
1,900 sq. feet
|
2 baths 3 beds |
show details | |

|
#18
Emperors Cv
Snellville, GA 30039
|
1,831 sq. feet
|
2 baths 4 beds |
show details | |

|
#19
Thunderwood Ln
Snellville, GA 30039
|
3,561 sq. feet
|
3 baths 4 beds |
show details | |

|
#20
Tuscan Ridge Dr
Snellville, GA 30039
|
3,681 sq. feet
|
3 baths 5 beds |
show details |
| Photo | Address | Area | Beds / Baths | Price | Details |
|---|---|---|---|---|---|

|
#21
Silvery Way
Snellville, GA 30039
|
2,500 sq. feet
|
2 baths 4 beds |
show details | |

|
#22
James Wade Dr
Snellville, GA 30039
|
1,854 sq. feet
|
2 baths 4 beds |
show details | |

|
#23
Brooks Dr
Snellville, GA 30078
|
2,160 sq. feet
|
2 baths 4 beds |
show details | |

|
#24
Meadowsweet Trl
Snellville, GA 30078
|
2,405 sq. feet
|
2 baths 4 beds |
show details | |

|
#25
Lake Port Ln
Snellville, GA 30039
|
3,005 sq. feet
|
2 baths 4 beds |
show details | |

|
#26
Tanglewood Rd
Snellville, GA 30039
|
1,140 sq. feet
|
2 baths 3 beds |
show details | |

|
#27
Commons Xing
Snellville, GA 30078
|
2,674 sq. feet
|
2 baths 3 beds |
show details | |

|
#28
Glen Summit Ln
Snellville, GA 30039
|
2,309 sq. feet
|
2 baths 4 beds |
show details | |

|
#29
Gayle Manor Ln
Snellville, GA 30078
|
3,055 sq. feet
|
3 baths 5 beds |
show details | |

|
#30
Laurel View Ct
Snellville, GA 30078
|
2,253 sq. feet
|
3 baths 4 beds |
show details |
| Photo | Address | Area | Beds / Baths | Price | Details |
|---|---|---|---|---|---|

|
#31
Tuscan Ridge Dr
Snellville, GA 30039
|
3,312 sq. feet
|
3 baths 4 beds |
show details | |

|
#32
Springdale Dr
Snellville, GA 30078
|
1,709 sq. feet
|
2 baths 3 beds |
show details | |

|
#33
Waterfront Pl
Snellville, GA 30039
|
3,023 sq. feet
|
2 baths 4 beds |
show details | |

|
#34
Sterling Creek Pointe
Snellville, GA 30078
|
1,852 sq. feet
|
2 baths 3 beds |
show details | |

|
#35
Driftwood Pl
Snellville, GA 30078
|
1,906 sq. feet
|
2 baths 3 beds |
show details | |

|
#36
Meadow Point Dr
Snellville, GA 30039
|
3,002 sq. feet
|
2 baths 4 beds |
show details | |

|
#37
Summit View Way
Snellville, GA 30078
|
1,848 sq. feet
|
2 baths 4 beds |
show details | |

|
#38
Janmar Rd
Snellville, GA 30078
|
5,196 sq. feet
|
2 baths 4 beds |
show details | |

|
#39
Lenora Springs Dr
Snellville, GA 30039
|
2,552 sq. feet
|
2 baths 3 beds |
show details | |

|
#40
Kingstream Dr
Snellville, GA 30039
|
3,544 sq. feet
|
4 baths 5 beds |
show details |
| Photo | Address | Area | Beds / Baths | Price | Details |
|---|---|---|---|---|---|

|
#41
Lenora Springs Dr
Snellville, GA 30039
|
2,373 sq. feet
|
2 baths 3 beds |
show details | |

|
#42
Pate Dr
Snellville, GA 30078
|
2,465 sq. feet
|
2 baths 4 beds |
show details | |

|
#43
Savannah Bay Ct
Snellville, GA 30078
|
1,642 sq. feet
|
2 baths 3 beds |
show details | |

|
#44
Hampton Ridge Way
Snellville, GA 30078
|
2,336 sq. feet
|
2 baths 3 beds |
show details | |

|
#45
Emerson Lake Cir
Snellville, GA 30078
|
1,726 sq. feet
|
2 baths 3 beds |
show details | |

|
#46
Meadowchase Ct
Snellville, GA 30078
|
2,026 sq. feet
|
2 baths 4 beds |
show details | |

|
#47
Bridle Point Pkwy
Snellville, GA 30039
|
1,831 sq. feet
|
2 baths 3 beds |
show details | |

|
#48
Travelers Ct
Snellville, GA 30039
|
2,799 sq. feet
|
3 baths 4 beds |
show details | |

|
#49
Ashworth Lake Rd
Snellville, GA 30078
|
1,627 sq. feet
|
2 baths 3 beds |
show details | |

|
Check over 1 million property listings on Foreclosure.com!
|
browse all offers | |||

Latest news about housing in Snellville, GA collected exclusively by city-data.com from local newspapers, TV, and radio stations


Median year apartment built: 1990
Household type by relationship:
Households: 21,273- Male householders: 3,151 (348 living alone), Female householders: 3,764 (928 living alone)
4,351 spouses (4,351 opposite-sex spouses), 544 unmarried partners, (499 opposite-sex unmarried partners), 6,613 children (6,344 natural, 11 adopted, 258 stepchildren), 600 grandchildren, 311 brothers or sisters, 560 parents, 0 foster children, 446 other relatives, 459 non-relatives
- In group quarters: 469
Size of family households: 2,219 2-persons, 1,083 3-persons, 1,195 4-persons, 602 5-persons, 118 6-persons, 218 7-or-more-persons.
Size of nonfamily households: 1,245 1-person, 241 2-persons, 3 4-persons, 33 5-persons.
2,647 married couples with children.
965 single-parent households (296 men, 669 women).
69.9% of residents of Snellville speak English at home.
11.2% of residents speak Spanish at home (60% speak English very well, 20% speak English well, 15% speak English not well, 6% don't speak English at all).
6.9% of residents speak other Indo-European language at home (81% speak English very well, 11% speak English well, 8% speak English not well).
7.1% of residents speak Asian or Pacific Island language at home (58% speak English very well, 41% speak English well, 2% speak English not well).
4.9% of residents speak other language at home (80% speak English very well, 11% speak English well, 7% speak English not well, 2% don't speak English at all).
Foreign born population: 5,016 (23.6%)
(78.5% of them are naturalized citizens)
| Here: | 7.5 |
| State: | 6.8 |
| Here: | 6.7 |
| State: | 4.6 |

- Bedrooms in owner-occupied houses and condos in Snellville, Georgia
- 0no bedroom
- 01 bedroom
- 1622 bedrooms
- 2,5853 bedrooms
- 2,4094 bedrooms
- 4055+ bedrooms

- Bedrooms in renter-occupied apartments in Snellville, Georgia
- 33no bedroom
- 01 bedroom
- 2902 bedrooms
- 4773 bedrooms
- 6114 bedrooms
- 135+ bedrooms

- Cars and other vehicles available in Snellville in owner-occupied houses/condos
- 87no vehicle
- 1,5331 vehicle
- 2,3182 vehicles
- 1,0983 vehicles
- 4424 vehicles
- 815+ vehicles

- Cars and other vehicles available in Snellville in renter-occupied apartments
- 104no vehicle
- 2701 vehicle
- 8312 vehicles
- 1983 vehicles
- 04 vehicles
- 215+ vehicles

- Rooms in owner-occupied houses in Snellville, Georgia
- 01 room
- 02 rooms
- 03 rooms
- 1974 rooms
- 5265 rooms
- 9126 rooms
- 1,2467 rooms
- 1,1858 rooms
- 1,4949+ rooms

- Rooms in renter-occupied apartments in Snellville, Georgia
- 161 room
- 02 rooms
- 353 rooms
- 1674 rooms
- 1725 rooms
- 2576 rooms
- 2977 rooms
- 2628 rooms
- 2189+ rooms


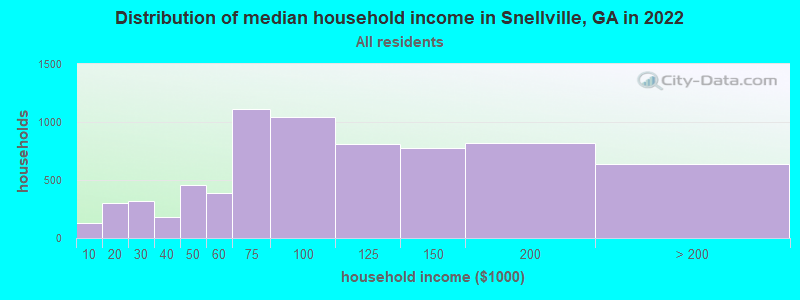
Snellville, GA household income distribution

- 132Less than $10,000
- 300$10,000 to $19,999
- 315$20,000 to $29,999
- 182$30,000 to $39,999
- 455$40,000 to $49,999
- 385$50,000 to $59,999
- 1,111$60,000 to $74,999
- 1,040$75,000 to $99,999
- 810$100,000 to $124,999
- 772$125,000 to $149,999
- 820$150,000 to $199,999
- 634$200,000 or more
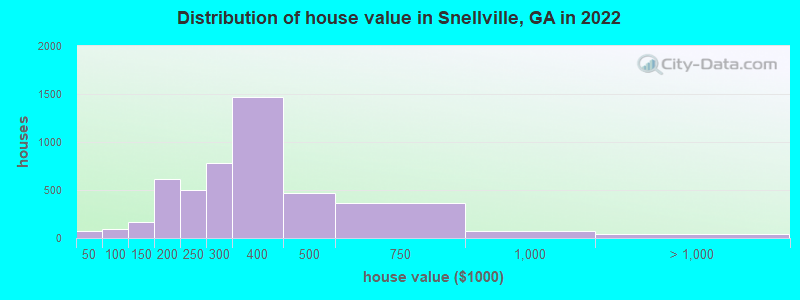
Home value of owner - occupied houses in 2022 in Snellville, GA
-
- 4Less than $10,000
- 20$15,000 to $19,999
- 43$25,000 to $29,999
- 20$50,000 to $59,999
- 30$80,000 to $89,999
- 42$90,000 to $99,999
- 117$100,000 to $124,999
- 46$125,000 to $149,999
- 177$150,000 to $174,999
- 438$175,000 to $199,999
- 497$200,000 to $249,999
- 785$250,000 to $299,999
- 1,472$300,000 to $399,999
- 471$400,000 to $499,999
- 363$500,000 to $749,999
- 69$750,000 to $999,999
- 42$2,000,000 or more
Rent paid by renters in 2022 in Snellville, GA
-
- 24$450 to $499
- 58$800 to $899
- 46$900 to $999
- 212$1,000 to $1,249
- 148$1,250 to $1,499
- 838$1,500 to $1,999
- 163$2,000 to $2,499


Percentage of workers working in this county: 59.4%
Number of people working at home: 1,488 (14.7% of all workers)
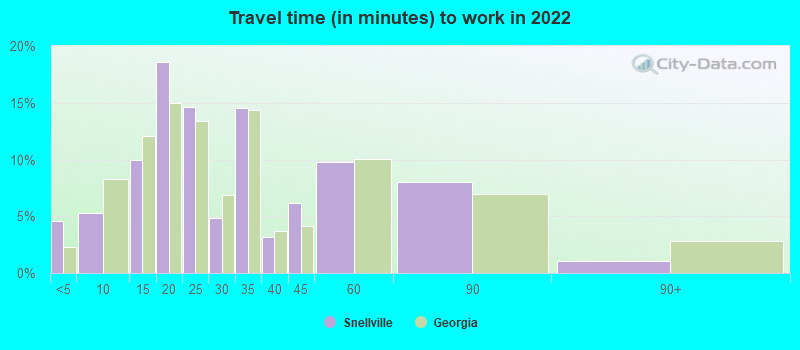
Travel time to work (commute)
- Less than 5 minutes: 116
- 5 to 9 minutes: 649
- 10 to 14 minutes: 407
- 15 to 19 minutes: 739
- 20 to 24 minutes: 708
- 25 to 29 minutes: 409
- 30 to 34 minutes: 1,406
- 35 to 39 minutes: 550
- 40 to 44 minutes: 395
- 45 to 59 minutes: 1,252
- 60 to 89 minutes: 1,413
- 90 or more minutes: 390
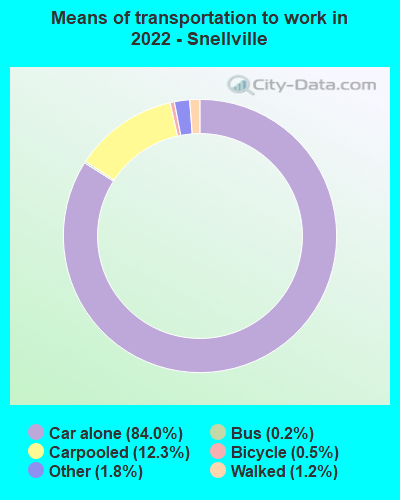
Means of transportation to work:
- Drove a car alone: 10,577 (72.1%)
- Carpooled: 1,850 (12.6%)
- Bus: 38 (0.3%)
- Taxi: 304 (2.1%)
- Bicycle: 81 (0.6%)
- Walked: 193 (1.3%)
- Worked at home: 1,488 (10.1%)

- Unemployment by race in 2022
- Unemployment rate for White non-Hispanic residents
- 3.5%Males
- 1.6%Females
- Unemployment rate for Black residents
- 9.1%Males
- 1.9%Females
- Unemployment rate for two or more race residents
- 9.6%Males
- 3.9%Females
- Unemployment rate for Hispanic or Latino residents
- 7.2%Males

- Year of entry for the foreign-born population in Snellville, Georgia
- 1,5112010 or later
- 1,4632000 to 2009
- 6081990 to 1999
- 3041980 to 1989
- 971970 to 1979
- 94Before 1970

First ancestries reported:
- English: 1,107 (9.1%)
- American: 780 (6.4%)
- Jamaican: 557 (4.6%)
- German: 540 (4.4%)
- Ethiopian: 411 (3.4%)
- Haitian: 288 (2.4%)
- African: 234 (1.9%)
- Scotch-Irish: 233 (1.9%)
- Irish: 231 (1.9%)
- Romanian: 160 (1.3%)
- European: 130 (1.1%)
- Guyanese: 117 (1.0%)
- Nigerian: 103 (0.8%)
- West Indian: 97 (0.8%)
- Trinidadian and Tobagonian: 91 (0.7%)
- Italian: 69 (0.6%)
- Polish: 56 (0.5%)
- Scottish: 54 (0.4%)
- British: 51 (0.4%)
- Liberian: 48 (0.4%)
- Northern European: 37 (0.3%)
- Slovene: 20 (0.2%)
- French: 18 (0.1%)
- Lebanese: 16 (0.1%)
- French Canadian: 11 (0.09%)
- Serbian: 11 (0.09%)
- Syrian: 10 (0.08%)
- Bahamian: 10 (0.08%)
- Swedish: 8 (0.07%)
- Norwegian: 7 (0.06%)
- Russian: 5 (0.04%)
- Swiss: 4 (0.03%)
- Bulgarian: 2 (0.02%)
Most common places of birth for foreign-born residents (%):
| Snellville: | 18.8% (936) |
| Georgia: | 1.6% (17,476) |
| Snellville: | 14.3% (709) |
| Georgia: | 9.2% (103,325) |
| Snellville: | 10.0% (495) |
| Georgia: | 4.6% (51,270) |
| Snellville: | 9.9% (492) |
| Georgia: | 0.4% (4,565) |
| Snellville: | 5.8% (290) |
| Georgia: | 1.1% (11,847) |
| Snellville: | 5.3% (263) |
| Georgia: | 1.6% (17,643) |
| Snellville: | 4.1% (202) |
| Georgia: | 1.2% (12,946) |
| Snellville: | 3.6% (177) |
| Georgia: | 20.0% (223,400) |
| Snellville: | 3.5% (173) |
| Georgia: | 2.5% (27,794) |
| Snellville: | 3.2% (161) |
| Georgia: | 4.1% (45,797) |
| Snellville: | 2.7% (136) |
| Georgia: | 0.1% (1,667) |
| Snellville: | 2.0% (99) |
| Georgia: | 0.8% (9,101) |
| Snellville: | 1.8% (91) |
| Georgia: | 0.6% (6,388) |
| Snellville: | 1.8% (88) |
| Georgia: | 2.5% (27,846) |
| Snellville: | 1.7% (87) |
| Georgia: | 0.7% (7,441) |
| Snellville: | 1.7% (87) |
| Georgia: | 2.1% (23,813) |
Place of birth for U.S.-born residents:
- This state: 7,693
- Other state: 8,084
- Northeast: 1,972
- Midwest: 2,028
- South: 3,242
- West: 824
92.0% of Snellville residents lived in the same house 1 years ago.
Out of people who lived in different houses, 29.9% lived in this county.
Out of people who lived in different counties, 68.0% lived in Georgia.
| Snellville: | 92.0% |
| State average: | 86.6% |
Education attainment for males 25 years and older:
- No schooling: 89
- Nursery to 4th grade: 0
- 5th and 6th grade: 38
- 7th and 8th grade: 33
- 9th grade: 79
- 10th grade: 42
- 11th grade: 99
- 12th grade, no diploma: 203
- High school graduate (or equivalency): 1,845
- Less than 1 year of college: 366
- Some college more than 1 year, no degree: 1,217
- Associate degree: 628
- Bachelor's degree: 2,312
- Master's degree: 351
- Professional school degree: 6
- Doctorate degree: 35

Education attainment for females 25 years and older:
- No schooling: 24
- Nursery to 4th grade: 0
- 5th and 6th grade: 0
- 7th and 8th grade: 72
- 9th grade: 135
- 10th grade: 55
- 11th grade: 31
- 12th grade, no diploma: 343
- High school graduate (or equivalency): 1,796
- Less than 1 year of college: 709
- Some college more than 1 year, no degree: 771
- Associate degree: 997
- Bachelor's degree: 2,029
- Master's degree: 609
- Professional school degree: 127
- Doctorate degree: 114


Housing units in structures:
- One, detached: 7,040
- One, attached: 228
- Two: 48
- 3 or 4: 193
- 5 to 9: 22
- 10 to 19: 16
Housing units lacking complete kitchen facilities in 2022: 2.1%
House/condo owner moved in on average 13 years ago
Renter moved in on average 5 years ago

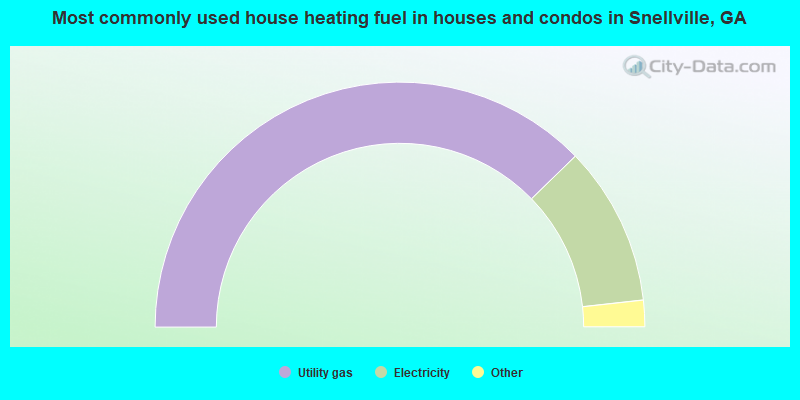
- 75.5%Utility gas
- 21.1%Electricity
- 1.7%Bottled, tank, or LP gas
- 1.1%Other fuel
- 0.4%No fuel used
- 0.3%Wood
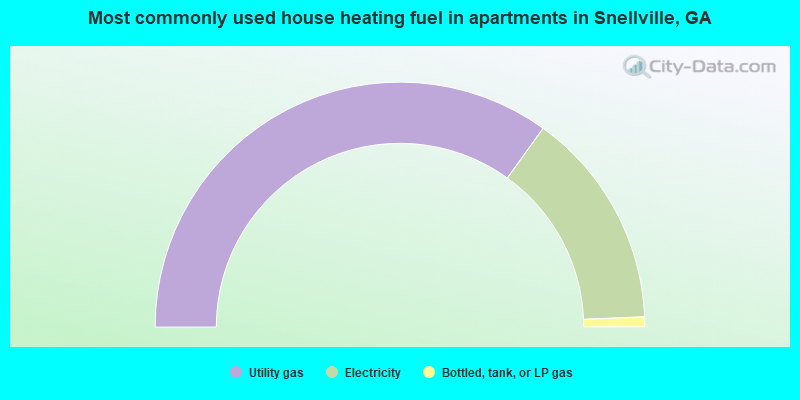
- 69.9%Utility gas
- 28.8%Electricity
- 1.3%Bottled, tank, or LP gas
Private vs. public school enrollment:
| Here: | 11.7% |
| Georgia: | 12.1% |
| Here: | 6.2% |
| Georgia: | 10.8% |
| Here: | 9.3% |
| Georgia: | 17.1% |


