Races in Snellville, Georgia (GA) Detailed Stats
Data:
Races - White alone (%)
Races - White alone (% change since 2000)
Races - Black alone (%)
Races - Black alone (% change since 2000)
Races - American Indian alone (%)
Races - American Indian alone (% change since 2000)
Races - Asian alone (%)
Races - Asian alone (% change since 2000)
Races - Hispanic (%)
Races - Hispanic (% change since 2000)
Races - Native Hawaiian and Other Pacific Islander alone (%)
Races - Native Hawaiian and Other Pacific Islander alone (% change since 2000)
Races - Two or more races(%)
Races - Two or more races(% change since 2000)
Races - Other race alone (%)
Races - Other race alone (% change since 2000)
Racial diversity
Place of birth - Born in state of residence (%)
Place of birth - Born in state of residence (%) - White
Place of birth - Born in state of residence (%) - Black or African American
Place of birth - Born in state of residence (%) - Asian
Place of birth - Born in state of residence (%) - Hispanic or Latino
Place of birth - Born in state of residence (%) - American Indian and Alaska Native
Place of birth - Born in state of residence (%) - Multirace
Place of birth - Born in state of residence (%) - Other Race
Place of birth - Born in other state (%)
Place of birth - Born in other state (%) - White
Place of birth - Born in other state (%) - Black or African American
Place of birth - Born in other state (%) - Asian
Place of birth - Born in other state (%) - Hispanic or Latino
Place of birth - Born in other state (%) - American Indian and Alaska Native
Place of birth - Born in other state (%) - Multirace
Place of birth - Born in other state (%) - Other Race
Place of birth - Native, outside of US (%)
Place of birth - Native, outside of US (%) - White
Place of birth - Native, outside of US (%) - Black or African American
Place of birth - Native, outside of US (%) - Asian
Place of birth - Native, outside of US (%) - Hispanic or Latino
Place of birth - Native, outside of US (%) - American Indian and Alaska Native
Place of birth - Native, outside of US (%) - Multirace
Place of birth - Native, outside of US (%) - Other Race
Place of birth - Foreign born (%)
Place of birth - Foreign born (%) - White
Place of birth - Foreign born (%) - Black or African American
Place of birth - Foreign born (%) - Asian
Place of birth - Foreign born (%) - Hispanic or Latino
Place of birth - Foreign born (%) - American Indian and Alaska Native
Place of birth - Foreign born (%) - Multirace
Place of birth - Foreign born (%) - Other Race
Residents speaking English at home (%)
Residents speaking English at home - Born in the United States (%)
Residents speaking English at home - Native, born elsewhere (%)
Residents speaking English at home - Foreign born (%)
Residents speaking Spanish at home (%)
Residents speaking Spanish at home - Born in the United States (%)
Residents speaking Spanish at home - Native, born elsewhere (%)
Residents speaking Spanish at home - Foreign born (%)
Residents speaking other language at home (%)
Residents speaking other language at home - Born in the United States (%)
Residents speaking other language at home - Native, born elsewhere (%)
Residents speaking other language at home - Foreign born (%)
Marital status - Never married (%)
Marital status - Now married (%)
Marital status - Separated (%)
Marital status - Widowed (%)
Marital status - Divorced (%)
Ancestries Reported - Arab (%)
Ancestries Reported - Czech (%)
Ancestries Reported - Danish (%)
Ancestries Reported - Dutch (%)
Ancestries Reported - English (%)
Ancestries Reported - French (%)
Ancestries Reported - French Canadian (%)
Ancestries Reported - German (%)
Ancestries Reported - Greek (%)
Ancestries Reported - Hungarian (%)
Ancestries Reported - Irish (%)
Ancestries Reported - Italian (%)
Ancestries Reported - Lithuanian (%)
Ancestries Reported - Norwegian (%)
Ancestries Reported - Polish (%)
Ancestries Reported - Portuguese (%)
Ancestries Reported - Russian (%)
Ancestries Reported - Scotch-Irish (%)
Ancestries Reported - Scottish (%)
Ancestries Reported - Slovak (%)
Ancestries Reported - Subsaharan African (%)
Ancestries Reported - Swedish (%)
Ancestries Reported - Swiss (%)
Ancestries Reported - Ukrainian (%)
Ancestries Reported - United States (%)
Ancestries Reported - Welsh (%)
Ancestries Reported - West Indian (%)
Ancestries Reported - Other (%)
Geographical mobility - Same house 1 year ago (%)
Geographical mobility - Same house 1 year ago (%) - White
Geographical mobility - Same house 1 year ago (%) - Black or African American
Geographical mobility - Same house 1 year ago (%) - Asian
Geographical mobility - Same house 1 year ago (%) - Hispanic or Latino
Geographical mobility - Same house 1 year ago (%) - American Indian and Alaska Native
Geographical mobility - Same house 1 year ago (%) - Multirace
Geographical mobility - Same house 1 year ago (%) - Other Race
Geographical mobility - Moved within same county (%)
Geographical mobility - Moved within same county (%) - White
Geographical mobility - Moved within same county (%) - Black or African American
Geographical mobility - Moved within same county (%) - Asian
Geographical mobility - Moved within same county (%) - Hispanic or Latino
Geographical mobility - Moved within same county (%) - American Indian and Alaska Native
Geographical mobility - Moved within same county (%) - Multirace
Geographical mobility - Moved within same county (%) - Other Race
Geographical mobility - Moved from different county within same state (%)
Geographical mobility - Moved from different county within same state (%) - White
Geographical mobility - Moved from different county within same state (%) - Black or African American
Geographical mobility - Moved from different county within same state (%) - Asian
Geographical mobility - Moved from different county within same state (%) - Hispanic or Latino
Geographical mobility - Moved from different county within same state (%) - American Indian and Alaska Native
Geographical mobility - Moved from different county within same state (%) - Multirace
Geographical mobility - Moved from different county within same state (%) - Other Race
Geographical mobility - Moved from different state (%)
Geographical mobility - Moved from different state (%) - White
Geographical mobility - Moved from different state (%) - Black or African American
Geographical mobility - Moved from different state (%) - Asian
Geographical mobility - Moved from different state (%) - Hispanic or Latino
Geographical mobility - Moved from different state (%) - American Indian and Alaska Native
Geographical mobility - Moved from different state (%) - Multirace
Geographical mobility - Moved from different state (%) - Other Race
Geographical mobility - Moved from abroad (%)
Geographical mobility - Moved from abroad (%) - White
Geographical mobility - Moved from abroad (%) - Black or African American
Geographical mobility - Moved from abroad (%) - Asian
Geographical mobility - Moved from abroad (%) - Hispanic or Latino
Geographical mobility - Moved from abroad (%) - American Indian and Alaska Native
Geographical mobility - Moved from abroad (%) - Multirace
Geographical mobility - Moved from abroad (%) - Other Race
Place of birth for the foreign-born population - Ireland (%)
Place of birth for the foreign-born population - Denmark (%)
Place of birth for the foreign-born population - Norway (%)
Place of birth for the foreign-born population - Sweden (%)
Place of birth for the foreign-born population - United Kingdom (%)
Place of birth for the foreign-born population - England (%)
Place of birth for the foreign-born population - Scotland (%)
Place of birth for the foreign-born population - Other Northern Europe (%)
Place of birth for the foreign-born population - Austria (%)
Place of birth for the foreign-born population - Belgium (%)
Place of birth for the foreign-born population - France (%)
Place of birth for the foreign-born population - Germany (%)
Place of birth for the foreign-born population - Netherlands (%)
Place of birth for the foreign-born population - Switzerland (%)
Place of birth for the foreign-born population - Other Western Europe (%)
Place of birth for the foreign-born population - Greece (%)
Place of birth for the foreign-born population - Italy (%)
Place of birth for the foreign-born population - Portugal (%)
Place of birth for the foreign-born population - Spain (%)
Place of birth for the foreign-born population - Other Southern Europe (%)
Place of birth for the foreign-born population - Albania (%)
Place of birth for the foreign-born population - Belarus (%)
Place of birth for the foreign-born population - Bosnia and Herzegovina (%)
Place of birth for the foreign-born population - Bulgaria (%)
Place of birth for the foreign-born population - Croatia (%)
Place of birth for the foreign-born population - Czechoslovakia (%)
Place of birth for the foreign-born population - Hungary (%)
Place of birth for the foreign-born population - Latvia (%)
Place of birth for the foreign-born population - Lithuania (%)
Place of birth for the foreign-born population - North Macedonia (Macedonia) (%)
Place of birth for the foreign-born population - Moldova (%)
Place of birth for the foreign-born population - Poland (%)
Place of birth for the foreign-born population - Romania (%)
Place of birth for the foreign-born population - Russia (%)
Place of birth for the foreign-born population - Serbia (%)
Place of birth for the foreign-born population - Ukraine (%)
Place of birth for the foreign-born population - Other Eastern Europe (%)
Place of birth for the foreign-born population - China (%)
Place of birth for the foreign-born population - Hong Kong (%)
Place of birth for the foreign-born population - Taiwan (%)
Place of birth for the foreign-born population - Japan (%)
Place of birth for the foreign-born population - Korea (%)
Place of birth for the foreign-born population - Other Eastern Asia (%)
Place of birth for the foreign-born population - Afghanistan (%)
Place of birth for the foreign-born population - Bangladesh (%)
Place of birth for the foreign-born population - India (%)
Place of birth for the foreign-born population - Iran (%)
Place of birth for the foreign-born population - Kazakhstan (%)
Place of birth for the foreign-born population - Nepal (%)
Place of birth for the foreign-born population - Pakistan (%)
Place of birth for the foreign-born population - Sri Lanka (%)
Place of birth for the foreign-born population - Uzbekistan (%)
Place of birth for the foreign-born population - Other South Central Asia (%)
Place of birth for the foreign-born population - Burma (%)
Place of birth for the foreign-born population - Cambodia (%)
Place of birth for the foreign-born population - Indonesia (%)
Place of birth for the foreign-born population - Laos (%)
Place of birth for the foreign-born population - Malaysia (%)
Place of birth for the foreign-born population - Philippines (%)
Place of birth for the foreign-born population - Singapore (%)
Place of birth for the foreign-born population - Thailand (%)
Place of birth for the foreign-born population - Vietnam (%)
Place of birth for the foreign-born population - Other South Eastern Asia (%)
Place of birth for the foreign-born population - Armenia (%)
Place of birth for the foreign-born population - Iraq (%)
Place of birth for the foreign-born population - Israel (%)
Place of birth for the foreign-born population - Jordan (%)
Place of birth for the foreign-born population - Kuwait (%)
Place of birth for the foreign-born population - Lebanon (%)
Place of birth for the foreign-born population - Saudi Arabia (%)
Place of birth for the foreign-born population - Syria (%)
Place of birth for the foreign-born population - Turkey (%)
Place of birth for the foreign-born population - Yemen (%)
Place of birth for the foreign-born population - Other Western Asia (%)
Place of birth for the foreign-born population - Eritrea (%)
Place of birth for the foreign-born population - Ethiopia (%)
Place of birth for the foreign-born population - Kenya (%)
Place of birth for the foreign-born population - Somalia (%)
Place of birth for the foreign-born population - Uganda (%)
Place of birth for the foreign-born population - Zimbabwe (%)
Place of birth for the foreign-born population - Other Eastern Africa (%)
Place of birth for the foreign-born population - Cameroon (%)
Place of birth for the foreign-born population - Congo (%)
Place of birth for the foreign-born population - Democratic Republic of Congo (Zaire) (%)
Place of birth for the foreign-born population - Other Middle Africa (%)
Place of birth for the foreign-born population - Egypt (%)
Place of birth for the foreign-born population - Morocco (%)
Place of birth for the foreign-born population - Sudan (%)
Place of birth for the foreign-born population - Other Northern Africa (%)
Place of birth for the foreign-born population - South Africa (%)
Place of birth for the foreign-born population - Other Southern Africa (%)
Place of birth for the foreign-born population - Cabo Verde (%)
Place of birth for the foreign-born population - Ghana (%)
Place of birth for the foreign-born population - Liberia (%)
Place of birth for the foreign-born population - Nigeria (%)
Place of birth for the foreign-born population - Senegal (%)
Place of birth for the foreign-born population - Sierra Leone (%)
Place of birth for the foreign-born population - Other Western Africa (%)
Place of birth for the foreign-born population - Australia (%)
Place of birth for the foreign-born population - New Zealand (%)
Place of birth for the foreign-born population - Fiji (%)
Place of birth for the foreign-born population - Micronesia (%)
Place of birth for the foreign-born population - Bahamas (%)
Place of birth for the foreign-born population - Barbados (%)
Place of birth for the foreign-born population - Cuba (%)
Place of birth for the foreign-born population - Dominica (%)
Place of birth for the foreign-born population - Dominican Republic (%)
Place of birth for the foreign-born population - Grenada (%)
Place of birth for the foreign-born population - Haiti (%)
Place of birth for the foreign-born population - Jamaica (%)
Place of birth for the foreign-born population - St. Vincent and the Grenadines (%)
Place of birth for the foreign-born population - Trinidad and Tobago (%)
Place of birth for the foreign-born population - West Indies (%)
Place of birth for the foreign-born population - Other Caribbean (%)
Place of birth for the foreign-born population - Belize (%)
Place of birth for the foreign-born population - Costa Rica (%)
Place of birth for the foreign-born population - El Salvador (%)
Place of birth for the foreign-born population - Guatemala (%)
Place of birth for the foreign-born population - Honduras (%)
Place of birth for the foreign-born population - Mexico (%)
Place of birth for the foreign-born population - Nicaragua (%)
Place of birth for the foreign-born population - Panama (%)
Place of birth for the foreign-born population - Other Central America (%)
Place of birth for the foreign-born population - Argentina (%)
Place of birth for the foreign-born population - Bolivia (%)
Place of birth for the foreign-born population - Brazil (%)
Place of birth for the foreign-born population - Chile (%)
Place of birth for the foreign-born population - Colombia (%)
Place of birth for the foreign-born population - Ecuador (%)
Place of birth for the foreign-born population - Guyana (%)
Place of birth for the foreign-born population - Peru (%)
Place of birth for the foreign-born population - Uruguay (%)
Place of birth for the foreign-born population - Venezuela (%)
Place of birth for the foreign-born population - Other South America (%)
Place of birth for the foreign-born population - Canada (%)
Place of birth for the foreign-born population - Other Northern America (%)
Place of birth for the foreign-born population - Other (%)
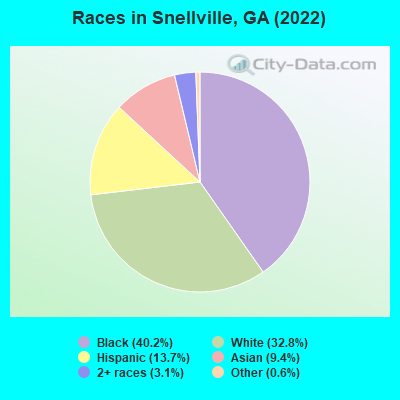
According to 2022 data, the most numerous races in Snellville, GA are White alone (6,971 residents), Black alone (8,551 residents), and Hispanic (2,907 residents). 69.7% of Snellville residents speak English at home. 23.4% of Snellville, GA residents are foreign-born (11.5% born in Latin America, 5.8% born in Asia, 4.0% born in Africa), which is 57.2% greater than the foreign-born rate of 10.0% across the entire state of Georgia.
Race distribution in Snellville
2000 2022
5,128,661 62.6% White alone 2,331,465 28.5% Black alone 435,227 5.3% Hispanic 171,513 2.1% Asian alone 87,364 1.1% Two or more races 17,670 0.2% American Indian alone 11,275 0.1% Other race alone 3,278 0.04% Native Hawaiian and Other
5,415,657 49.6% White alone 3,349,240 30.7% Black alone 1,132,604 10.4% Hispanic 479,156 4.4% Asian alone 462,923 4.2% Two or more races 54,416 0.5% Other race alone 11,923 0.1% American Indian alone 6,957 0.06% Native Hawaiian and Other
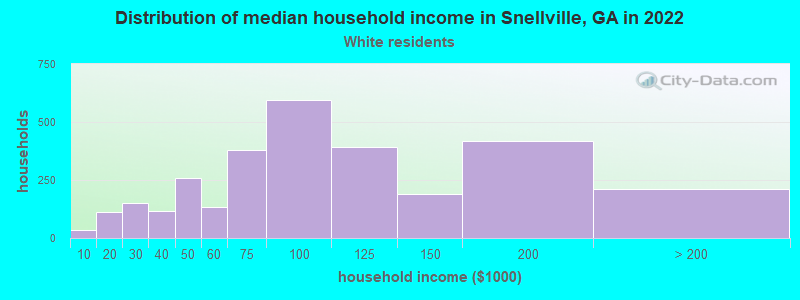
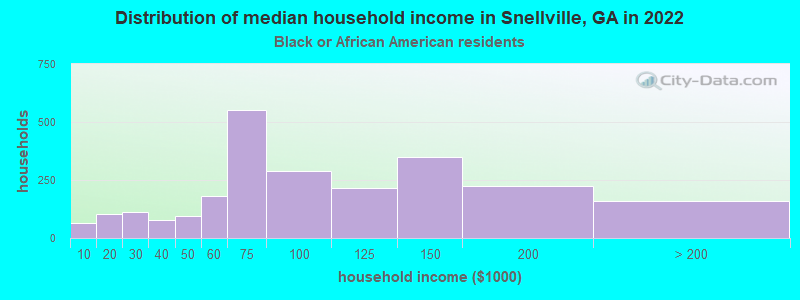
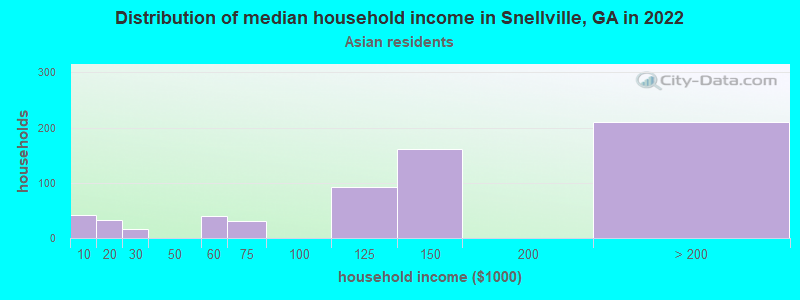
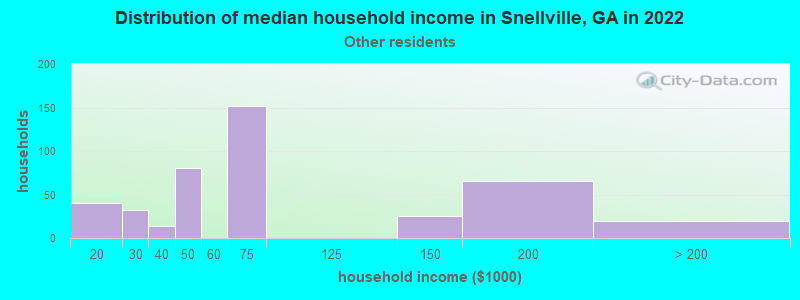
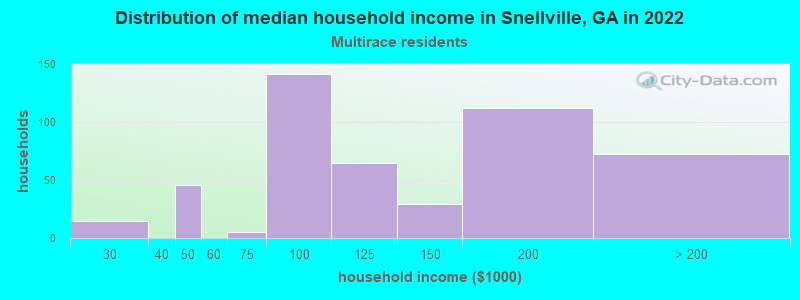
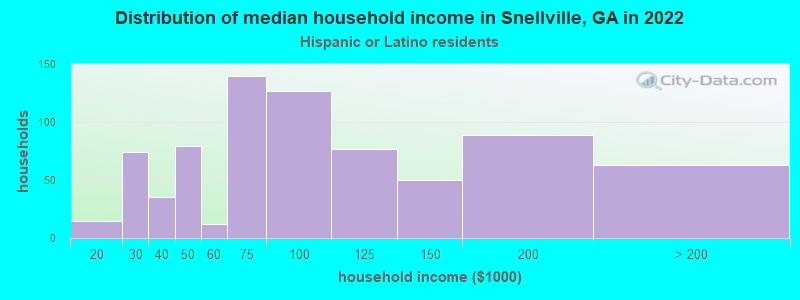
Income and house value in Snellville Median household income in 2022 $86,024 White non-Hispanic householders$77,196 Black householders$148,811 Asian householders$68,513 Some other race householders$127,852 Two or more races householders$78,150 Hispanic or Latino race householdersMedian 2022 house value $319,742 White Non-Hispanic householders$359,446 Black or African American householders$105,719 American Indian or Alaska Native householders $366,024 Asian householders$347,464 Some other race householders$296,719 Two or more races householders$297,424 Hispanic or Latino householders
Median age by race in Snellville
57.0 Median age for White residents55.8 58.3 37.7 Median age for Black or African American residents32.4 39.2 -626,666,666.0 Median age for American Indian / Alaska Native residents-574,468,084.5 -732,307,691.6 32.9 Median age for Asian residents33.4 32.8 -1,080,291,969.7 Median age for Native Hawaiian / Pacific Islander residents-1,248,062,014.3 -776,776,776.0 32.5 Median age for Other race residents38.1 17.0 32.9 Median age for Two or more races residents36.9 30.2 58.7 Median age for White alone residents58.9 58.5 27.9 Median age for Hispanic or Latino residents36.6 25.2
Owner/renter occupied households by race in Snellville
House owners and renters - White residents 2,694 91.9% Owner occupied237 8.1% Renter occupiedHouse owners and renters - Black or African American residents 1,519 61.3% Owner occupied958 38.7% Renter occupiedHouse owners and renters - Asian residents 590 94.8% Owner occupied32 5.2% Renter occupiedHouse owners and renters - Other race residents 344 76.6% Owner occupied105 23.4% Renter occupiedHouse owners and renters - Two or more races residents 348 78.2% Owner occupied97 21.8% Renter occupiedHouse owners and renters - White alone residents 2,557 91.9% Owner occupied225 8.1% Renter occupiedHouse owners and renters - Hispanic or Latino residents 627 79.7% Owner occupied159 20.3% Renter occupied
Language usage in Snellville
English speakers - Total 69.7% of residents of Snellville speak English at home.
11.2% of residents speak Spanish at home 1,377 60.1% Speak English very well916 39.9% Speak English less than very well19.0% of residents speak other language at home 2,857 73.1% Speak English very well1,051 26.9% Speak English less than very well
English speakers - Born in the United States 85.1% of residents of Snellville speak English at home.
5.7% of residents speak Spanish at home 465 100.0% Speak English very well9.4% of residents speak other language at home 391 51.3% Speak English very well371 48.7% Speak English less than very well
English speakers - Native, born elsewhere 43.5% of residents of Snellville speak English at home.
33.7% of residents speak Spanish at home 52 40.0% Speak English very well78 60.0% Speak English less than very well21.2% of residents speak other language at home 70 85.4% Speak English very well12 14.6% Speak English less than very well
English speakers - Foreign-born 22.3% of residents of Snellville speak English at home.
20.1% of residents speak Spanish at home 303 30.0% Speak English very well708 70.0% Speak English less than very well57.5% of residents speak other language at home 2,282 79.0% Speak English very well606 21.0% Speak English less than very well
White (Caucasian) - Speak only English Native:
94.9% (6,401)Foreign-born:
3.6% (13)
White (Caucasian) - Speak another language Native:
5.6% (378)Foreign-born:
93.6% (329)
Black or African American - Speak only English Native:
93.9% (5,704)Foreign-born:
44.2% (1,078)
Black or African American - Speak another language Native:
6.0% (362)Foreign-born:
55.1% (1,344)
Asian - Speak only English Native:
12.0% (77)Foreign-born:
2.0% (26)
Asian - Speak another language Native:
91.2% (584)Foreign-born:
99.0% (1,291)
Other race - Speak only English Native:
34.3% (299)Foreign-born:
3.8% (18)
Other race - Speak another language Native:
65.4% (570)Foreign-born:
96.2% (449)
Two or more races - Speak only English Native:
64.5% (686)Foreign-born:
19.4% (58)
Two or more races - Speak another language Native:
35.6% (380)Foreign-born:
77.3% (230)
White alone - Speak only English Native:
97.1% (6,375)Foreign-born:
7.2% (13)
White alone - Speak another language Native:
2.8% (187)Foreign-born:
96.3% (175)
Hispanic or Latino - Speak another language Native:
74.3% (1,197)Foreign-born:
99.2% (1,023)
Foreign-born residents in Snellville 4,973 residents are foreign born (11.5% Latin America , 5.8% Asia , 4.0% Africa ).
This city:
23.4%Georgia:
10.4%
Marital status for residents in Snellville Marital status - White (Caucasian) population 15 years and over
Males 20.9% Never married69.1% Now married0.6% Separated2.6% Widowed6.9% DivorcedFemales 19.9% Never married55.8% Now married0.1% Separated12.6% Widowed11.6% DivorcedWomen who gave birth in the past 12 months Now married:
0.0% (0)Unmarried:
100.0% (30)
Women who did not give birth in the past 12 months Now married:
48.9% (658)Unmarried:
51.1% (688)
Marital status - Black or African American population 15 years and over
Males 44.0% Never married43.3% Now married1.3% Separated0.9% Widowed10.6% DivorcedFemales 32.1% Never married45.3% Now married4.6% Separated5.3% Widowed12.7% DivorcedWomen who gave birth in the past 12 months Now married:
0.0% (0)Unmarried:
100.0% (15)
Women who did not give birth in the past 12 months Now married:
47.7% (1,010)Unmarried:
52.3% (1,106)
Marital status - Asian population 15 years and over
Males 47.4% Never married48.7% Now married0.9% Separated0.0% Widowed3.0% DivorcedFemales 41.6% Never married50.8% Now married3.0% Separated3.3% Widowed1.3% DivorcedWomen who gave birth in the past 12 months Now married:
100.0% (33)Unmarried:
0.0% (0)
Women who did not give birth in the past 12 months Now married:
25.5% (153)Unmarried:
74.5% (446)
Marital status - Other race population 15 years and over
Males 34.5% Never married63.1% Now married0.0% Separated0.0% Widowed2.4% DivorcedFemales 42.0% Never married43.9% Now married0.0% Separated8.9% Widowed5.1% DivorcedWomen who gave birth in the past 12 months Now married:
0.0% (0)Unmarried:
100.0% (4)
Women who did not give birth in the past 12 months Now married:
53.7% (168)Unmarried:
46.3% (145)
Marital status - Two or more races population 15 years and over
Males 33.7% Never married60.1% Now married0.0% Separated0.0% Widowed6.2% DivorcedFemales 52.4% Never married39.5% Now married0.0% Separated2.7% Widowed5.4% DivorcedWomen who gave birth in the past 12 months Now married:
63.8% (39)Unmarried:
36.2% (22)
Women who did not give birth in the past 12 months Now married:
28.5% (105)Unmarried:
71.5% (265)
Marital status - White alone, not Hispanic / Latino population 15 years and over
Males 21.7% Never married68.6% Now married0.0% Separated2.8% Widowed6.9% DivorcedFemales 17.7% Never married58.2% Now married0.1% Separated12.2% Widowed11.9% DivorcedWomen who did not give birth in the past 12 months Now married:
48.1% (592)Unmarried:
51.9% (638)
Marital status - Hispanic or Latino population 15 years and over
Males 24.9% Never married70.3% Now married1.9% Separated0.0% Widowed2.9% DivorcedFemales 44.3% Never married43.1% Now married0.0% Separated7.3% Widowed5.3% DivorcedWomen who gave birth in the past 12 months Now married:
29.5% (24)Unmarried:
70.5% (57)
Women who did not give birth in the past 12 months Now married:
50.0% (366)Unmarried:
50.0% (366)
Ancestries in Snellville
1,107 9.1% English780 6.4% American557 4.6% Jamaican540 4.4% German411 3.4% Ethiopian288 2.4% Haitian234 1.9% African233 1.9% Scotch-Irish231 1.9% Irish160 1.3% Romanian130 1.1% European117 1.0% Guyanese103 0.8% Nigerian97 0.8% West Indian91 0.7% Trinidadian and Tobagonian69 0.6% Italian56 0.5% Polish54 0.4% Scottish51 0.4% British48 0.4% Liberian37 0.3% Northern European20 0.2% Slovene18 0.1% French16 0.1% Lebanese11 0.09% French Canadian11 0.09% Serbian10 0.08% Syrian10 0.08% Bahamian8 0.07% Swedish7 0.06% Norwegian5 0.04% Russian4 0.03% Swiss2 0.02% Bulgarian
Geographical mobility in Snellville Same house 1 year ago 6,591 91.6% White (Caucasian)8,294 96.3% Black or African American1,968 99.7% Asian914 62.4% Other race1,392 90.8% Two or more races6,316 90.8% White alone, not Hispanic / Latino2,380 81.8% Hispanic or LatinoMoved within same county 237 3.3% White / Caucasian321 3.7% Black or African American9 0.4% Asian1 92.7% Native Hawaiian / Pacific Islander17 1.2% Other race83 5.4% Two or more races280 4.0% White alone, not Hispanic / Latino30 1.0% Hispanic or LatinoMoved within same state 210 2.9% White / Caucasian29 0.3% Black or African American862 58.8% Other race38 2.4% Two or more races208 3.0% White alone, not Hispanic / Latino450 15.5% Hispanic or LatinoMoved from different state 122 1.7% White / Caucasian79 0.9% Black or African American30 1.5% Asian104 1.5% White alone, not Hispanic / Latino26 0.9% Hispanic or LatinoMoved from abroad 35 0.5% White9 0.1% Black or African American26 0.4% White alone, not Hispanic / Latino
Children Nativity (place of birth) in Snellville
Children under 6 years - Living with two parents Both parents native 208 100.0% NativeBoth parents foreign-born 124 100.0% NativeOne native, one foreign-born parent 241 100.0% NativeChildren under 6 years - Living with one parent Native parent 272 100.0% NativeForeign-born parent 61 100.0% NativeChildren 6 to 17 years - Living with two parents Both parents native 1,070 100.0% NativeBoth parents foreign-born 532 97.2% Native15 2.8% Foreign-bornOne native, one foreign-born parent 461 96.2% Native18 3.8% Foreign-bornChildren 6 to 17 years - Living with one parent Native parent 537 72.2% Native206 27.8% Foreign-bornForeign-born parent 310 81.0% Native73 19.0% Foreign-born
Grandparents responsible for own grandchildren in Snellville
Grandparents (30 to 59 years) White / Caucasian 38 100.0% Not responsible for grandchildrenBlack or African American 18 12.9% Responsible for grandchildren124 87.1% Not responsible for grandchildrenTwo or more races 53 100.0% Not responsible for grandchildrenWhite alone, not Hispanic / Latino 40 100.0% Not responsible for grandchildrenHispanic or Latino 40 100.0% Not responsible for grandchildrenGrandparents (60 years and over) White / Caucasian 47 49.2% Responsible for grandchildren48 50.8% Not responsible for grandchildrenBlack or African American 110 30.9% Responsible for grandchildren247 69.1% Not responsible for grandchildrenTwo or more races 95 100.0% Not responsible for grandchildrenWhite alone, not Hispanic / Latino 47 74.6% Responsible for grandchildren16 25.4% Not responsible for grandchildrenHispanic or Latino 77 100.0% Not responsible for grandchildren