Smyrna, GA (Georgia) Houses and Residents
| Smyrna: | $437,225 |
| Georgia: | $297,400 |
Mean price in 2022:
Detached houses: $476,487
Here: $476,487 State: $376,364 Townhouses or other attached units: $335,748
Here: $335,748 State: $341,709 In 2-unit structures: $224,194
Here: $224,194 State: $269,631 In 3-to-4-unit structures: $203,934
Here: $203,934 State: $250,092 In 5-or-more-unit structures: $221,857
Here: $221,857 State: $370,730
Total population: 54,958 (Urban population: 40,780, Rural population: 0)
Houses: 26,842 (25,124 occupied: 14,474 owner occupied, 10,819 renter occupied)
| % of renters here: | 43% |
| State: | 34% |
Housing density: 1,931 houses/condos per square mile
Median price asked for vacant for-sale houses and condos in 2022: $363,197.
Median contract rent in 2022: $1,500 (lower quartile is $1,197, upper quartile is $1,856)
Median rent asked for vacant for-rent units in 2022: $1,529
Median gross rent in Smyrna, GA in 2022: $1,660
Housing units in Smyrna with a mortgage: 10,928 (1,138 second mortgage, 13 home equity loan, 1,129 both second mortgage and home equity loan)
Houses without a mortgage: 31
Median household income for houses/condos with a mortgage: $141,810
Median household income for apartments without a mortgage: $88,458
Median monthly housing costs: $1,673
Compare current foreclosures in Smyrna, GA:
| Photo | Address | Area | Beds / Baths | Price | Details |
|---|---|---|---|---|---|

|
#1
Fraser St SE
Smyrna, GA 30080
|
876 sq. feet
|
1 baths 2 beds |
show details | |

|
#2
Vineyard Way SE
Smyrna, GA 30082
|
2,068 sq. feet
|
2 baths 3 beds |
show details | |

|
#3
Mill Pond Ct SE
Smyrna, GA 30082
|
1,229 sq. feet
|
2 baths 2 beds |
show details | |

|
#4
Mill Grove Ln SW
Smyrna, GA 30082
|
4,367 sq. feet
|
2 baths 4 beds |
show details | |

|
#5
Countryside Pl SE
Smyrna, GA 30080
|
1,244 sq. feet
|
2 baths 2 beds |
show details | |

|
#6
Church St SE
Smyrna, GA 30080
|
815 sq. feet
|
1 baths 2 beds |
show details | |

|
#7
Spring Heights Ln SE
Smyrna, GA 30080
|
1,882 sq. feet
|
2 baths 3 beds |
show details | |

|
#8
Ann Rd SE
Smyrna, GA 30080
|
1,668 sq. feet
|
2 baths 3 beds |
show details | |

|
#9
Huntington Trce SE
Smyrna, GA 30082
|
1,912 sq. feet
|
2 baths 2 beds |
show details | |

|
#10
Bent Hickory Dr SE
Smyrna, GA 30082
|
1,464 sq. feet
|
2 baths 3 beds |
show details |
| Photo | Address | Area | Beds / Baths | Price | Details |
|---|---|---|---|---|---|

|
#11
Charleston Trl SE
Smyrna, GA 30080
|
2,412 sq. feet
|
2 baths 4 beds |
show details | |

|
#12
Hidden Trail Rd SE
Smyrna, GA 30082
|
2,858 sq. feet
|
2 baths 4 beds |
show details | |

|
#13
Winward Way SE
Smyrna, GA 30082
|
1,660 sq. feet
|
2 baths 3 beds |
show details | |

|
#14
Navaho Trl SE
Smyrna, GA 30080
|
1,225 sq. feet
|
2 baths 3 beds |
show details | |

|
#15
Lakeshore Dr SW
Smyrna, GA 30082
|
1,302 sq. feet
|
1 baths 3 beds |
show details | |

|
#16
Plumcrest Rd SE
Smyrna, GA 30082
|
1,722 sq. feet
|
2 baths 3 beds |
show details | |

|
#17
Creekside Ter SE
Smyrna, GA 30082
|
2,488 sq. feet
|
2 baths 3 beds |
show details | |

|
#18
Drewsbury Ct SE
Smyrna, GA 30080
|
3,130 sq. feet
|
2 baths 4 beds |
show details | |

|
#19
Hickory Acres Dr SE
Smyrna, GA 30082
|
1,373 sq. feet
|
2 baths 3 beds |
show details | |

|
#20
Hill House Rd SW
Smyrna, GA 30082
|
3,732 sq. feet
|
4 baths 5 beds |
show details |
| Photo | Address | Area | Beds / Baths | Price | Details |
|---|---|---|---|---|---|

|
#21
Wells Dr SE
Smyrna, GA 30080
|
2,520 sq. feet
|
4 baths 4 beds |
show details | |

|
#22
Mosaic Way
Smyrna, GA 30080
|
2,042 sq. feet
|
3 baths 2 beds |
show details | |

|
#23
Coopers Creek Dr SE
Smyrna, GA 30082
|
1,372 sq. feet
|
2 baths 2 beds |
show details | |

|
#24
Oakley Trce SE
Smyrna, GA 30080
|
1,050 sq. feet
|
1 baths 2 beds |
show details | |

|
#25
Berryhill Cir SE
Smyrna, GA 30082
|
1,743 sq. feet
|
2 baths 3 beds |
show details | |

|
#26
Green Valley Dr SE
Smyrna, GA 30082
|
2,024 sq. feet
|
2 baths 3 beds |
show details | |

|
#27
Queensgate Dr SE
Smyrna, GA 30082
|
3,327 sq. feet
|
4 baths 4 beds |
show details | |

|
#28
Foxwood Trl SE
Smyrna, GA 30082
|
1,978 sq. feet
|
2 baths 3 beds |
show details | |

|
#29
Vinings Mill Trl SE
Smyrna, GA 30080
|
2,695 sq. feet
|
2 baths 4 beds |
show details | |

|
#30
Macleans Cross Ln SE
Smyrna, GA 30082
|
1,943 sq. feet
|
2 baths 2 beds |
show details |
| Photo | Address | Area | Beds / Baths | Price | Details |
|---|---|---|---|---|---|

|
#31
Navaho Trl SE
Smyrna, GA 30080
|
1,193 sq. feet
|
1 baths 3 beds |
show details | |

|
#32
Wrenfield Ct SE
Smyrna, GA 30082
|
2,776 sq. feet
|
2 baths 4 beds |
show details | |

|
#33
Lake Ct SE
Smyrna, GA 30082
|
1,888 sq. feet
|
2 baths 2 beds |
show details | |

|
#34
Gateswalk Dr SE
Smyrna, GA 30080
|
3,906 sq. feet
|
4 baths 3 beds |
show details | |

|
#35
Cumberland Dr SE
Smyrna, GA 30080
|
1,821 sq. feet
|
3 baths 3 beds |
show details | |

|
#36
Ennisbrook Dr SE
Smyrna, GA 30082
|
3,328 sq. feet
|
2 baths 4 beds |
show details | |

|
#37
Daniel Green Trl SE
Smyrna, GA 30080
|
2,948 sq. feet
|
2 baths 4 beds |
show details | |

|
#38
Reed St SE
Smyrna, GA 30080
|
675 sq. feet
|
1 baths 2 beds |
show details | |

|
#39
Woodview Dr SE
Smyrna, GA 30082
|
1,218 sq. feet
|
1 baths 3 beds |
show details | |

|
#40
Cooper Ridge Ct SE
Smyrna, GA 30080
|
1,334 sq. feet
|
2 baths 3 beds |
show details |
| Photo | Address | Area | Beds / Baths | Price | Details |
|---|---|---|---|---|---|

|
#41
Argo Dr SE
Smyrna, GA 30080
|
1,224 sq. feet
|
2 baths 3 beds |
show details | |

|
#42
Millside Walk SE
Smyrna, GA 30080
|
2,631 sq. feet
|
2 baths 3 beds |
show details | |

|
#43
Nappa Valley Ct SE
Smyrna, GA 30080
|
1,300 sq. feet
|
1 baths 2 beds |
show details | |

|
#44
Lexington Trace Dr SE
Smyrna, GA 30080
|
1,444 sq. feet
|
2 baths 2 beds |
show details | |

|
#45
Paces Ferry North Dr SE
Smyrna, GA 30080
|
1,292 sq. feet
|
2 baths 2 beds |
show details | |

|
#46
Bell Dr SE
Smyrna, GA 30080
|
1,280 sq. feet
|
2 baths 3 beds |
show details | |

|
#47
Church St SE
Smyrna, GA 30080
|
1,160 sq. feet
|
1 baths 3 beds |
show details | |

|
#48
Lakeshore Dr SW
Smyrna, GA 30082
|
1,982 sq. feet
|
1 baths 3 beds |
show details | |

|
#49
Heather Rd SE
Smyrna, GA 30082
|
1,969 sq. feet
|
2 baths 4 beds |
show details | |

|
Check over 1 million property listings on Foreclosure.com!
|
browse all offers | |||

Latest news about housing in Smyrna, GA collected exclusively by city-data.com from local newspapers, TV, and radio stations


Median year apartment built: 1988
Household type by relationship:
Households: 56,310- Male householders: 11,587 (3,275 living alone), Female householders: 13,304 (5,756 living alone)
9,757 spouses (9,501 opposite-sex spouses), 2,066 unmarried partners, (1,929 opposite-sex unmarried partners), 14,088 children (13,518 natural, 117 adopted, 451 stepchildren), 781 grandchildren, 506 brothers or sisters, 1,053 parents, 14 foster children, 708 other relatives, 2,254 non-relatives
- In group quarters: 188
Size of family households: 5,945 2-persons, 3,720 3-persons, 2,835 4-persons, 874 5-persons, 406 6-persons, 115 7-or-more-persons.
Size of nonfamily households: 8,967 1-person, 1,672 2-persons, 440 3-persons, 141 4-persons, 39 6-persons.
8,201 married couples with children.
2,867 single-parent households (778 men, 2,089 women).
79.8% of residents of Smyrna speak English at home.
9.6% of residents speak Spanish at home (60% speak English very well, 13% speak English well, 14% speak English not well, 14% don't speak English at all).
6.5% of residents speak other Indo-European language at home (78% speak English very well, 17% speak English well, 5% speak English not well).
2.2% of residents speak Asian or Pacific Island language at home (64% speak English very well, 22% speak English well, 14% speak English not well).
1.5% of residents speak other language at home (98% speak English very well, 2% speak English well).
Foreign born population: 8,603 (15.3%)
(50.3% of them are naturalized citizens)
| Here: | 6.9 |
| State: | 6.8 |
| Here: | 3.8 |
| State: | 4.6 |

- Bedrooms in owner-occupied houses and condos in Smyrna, Georgia
- 0no bedroom
- 4031 bedroom
- 2,5512 bedrooms
- 5,1893 bedrooms
- 4,3284 bedrooms
- 2,0035+ bedrooms

- Bedrooms in renter-occupied apartments in Smyrna, Georgia
- 363no bedroom
- 2,9361 bedroom
- 4,9392 bedrooms
- 1,9953 bedrooms
- 4194 bedrooms
- 1685+ bedrooms

- Cars and other vehicles available in Smyrna in owner-occupied houses/condos
- 129no vehicle
- 4,7661 vehicle
- 6,4822 vehicles
- 2,4163 vehicles
- 5754 vehicles
- 1075+ vehicles

- Cars and other vehicles available in Smyrna in renter-occupied apartments
- 768no vehicle
- 5,7521 vehicle
- 3,2622 vehicles
- 7913 vehicles
- 2464 vehicles
- 05+ vehicles

- Rooms in owner-occupied houses in Smyrna, Georgia
- 01 room
- 982 rooms
- 3663 rooms
- 1,3804 rooms
- 2,6765 rooms
- 2,0746 rooms
- 2,0477 rooms
- 2,0378 rooms
- 3,7969+ rooms

- Rooms in renter-occupied apartments in Smyrna, Georgia
- 3631 room
- 8732 rooms
- 2,5863 rooms
- 3,5684 rooms
- 1,5965 rooms
- 8846 rooms
- 4007 rooms
- 2228 rooms
- 3289+ rooms


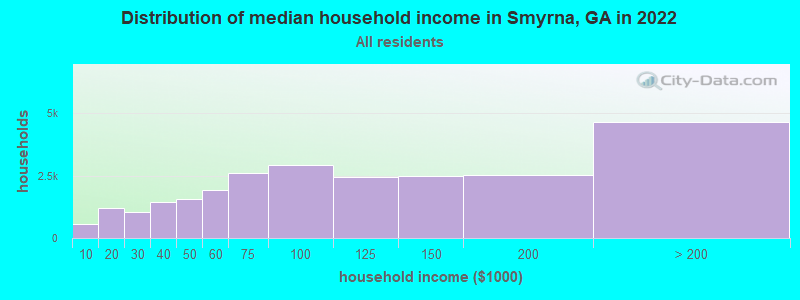
Smyrna, GA household income distribution

- 570Less than $10,000
- 1,191$10,000 to $19,999
- 1,037$20,000 to $29,999
- 1,449$30,000 to $39,999
- 1,552$40,000 to $49,999
- 1,911$50,000 to $59,999
- 2,604$60,000 to $74,999
- 2,938$75,000 to $99,999
- 2,447$100,000 to $124,999
- 2,481$125,000 to $149,999
- 2,537$150,000 to $199,999
- 4,650$200,000 or more
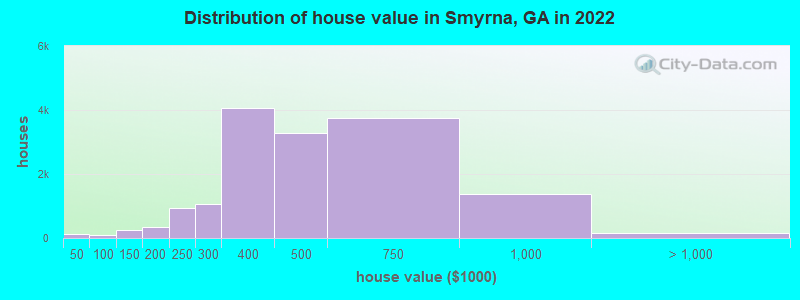
Home value of owner - occupied houses in 2022 in Smyrna, GA
-
- 29$15,000 to $19,999
- 15$20,000 to $24,999
- 5$25,000 to $29,999
- 29$30,000 to $34,999
- 48$40,000 to $49,999
- 1$70,000 to $79,999
- 33$80,000 to $89,999
- 18$90,000 to $99,999
- 136$100,000 to $124,999
- 126$125,000 to $149,999
- 112$150,000 to $174,999
- 231$175,000 to $199,999
- 939$200,000 to $249,999
- 1,048$250,000 to $299,999
- 4,060$300,000 to $399,999
- 3,282$400,000 to $499,999
- 3,751$500,000 to $749,999
- 1,388$750,000 to $999,999
- 129$1,000,000 to $1,499,999
- 32$2,000,000 or more
Rent paid by renters in 2022 in Smyrna, GA
-
- 16$150 to $199
- 40$250 to $299
- 6$300 to $349
- 15$350 to $399
- 98$450 to $499
- 40$500 to $549
- 81$650 to $699
- 77$700 to $749
- 8$750 to $799
- 124$800 to $899
- 331$900 to $999
- 2,194$1,000 to $1,249
- 2,035$1,250 to $1,499
- 4,368$1,500 to $1,999
- 876$2,000 to $2,499
- 130$2,500 to $2,999
- 61$3,000 to $3,499
- 80$3,500 or more
- 151No cash rent


Percentage of workers working in this county: 61.3%
Number of people working at home: 10,757 (31.5% of all workers)
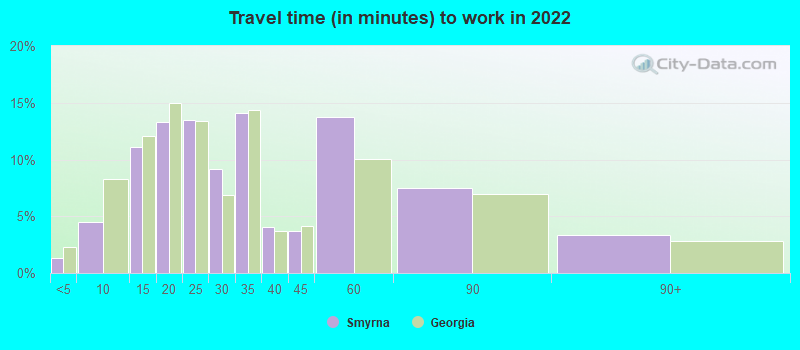
Travel time to work (commute)
- Less than 5 minutes: 204
- 5 to 9 minutes: 1,116
- 10 to 14 minutes: 2,634
- 15 to 19 minutes: 3,074
- 20 to 24 minutes: 3,262
- 25 to 29 minutes: 2,887
- 30 to 34 minutes: 4,298
- 35 to 39 minutes: 2,127
- 40 to 44 minutes: 950
- 45 to 59 minutes: 2,128
- 60 to 89 minutes: 1,183
- 90 or more minutes: 426
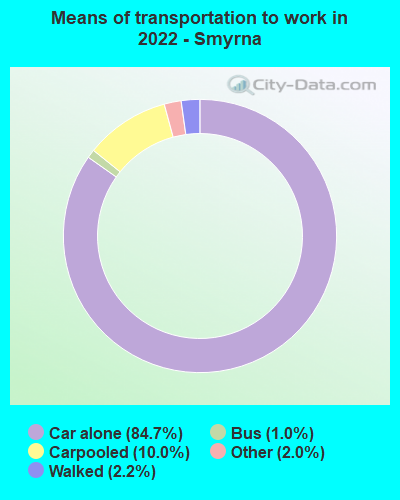
Means of transportation to work:
- Drove a car alone: 18,418 (57.0%)
- Carpooled: 2,596 (8.0%)
- Bus: 239 (0.7%)
- Taxi: 531 (1.6%)
- Walked: 602 (1.9%)
- Worked at home: 10,757 (33.3%)

- Unemployment by race in 2022
- Unemployment rate for White non-Hispanic residents
- 2.7%Males
- 1.8%Females
- Unemployment rate for Black residents
- 4.1%Males
- 3.0%Females
- Unemployment rate for American Indian and Alaska Native residents
- 5.4%Males
- Unemployment rate for Asian residents
- 0.6%Males
- 11.1%Females
- Unemployment rate for other race residents
- 2.9%Males
- 4.7%Females
- Unemployment rate for two or more race residents
- 2.1%Females
- Unemployment rate for Hispanic or Latino residents
- 3.4%Males
- 4.7%Females

- Year of entry for the foreign-born population in Smyrna, Georgia
- 3,4602010 or later
- 1,9172000 to 2009
- 1,5311990 to 1999
- 1,6181980 to 1989
- 4751970 to 1979
- 461Before 1970

First ancestries reported:
- English: 2,016 (7.4%)
- American: 1,357 (5.0%)
- German: 1,142 (4.2%)
- Irish: 1,113 (4.1%)
- Nigerian: 818 (3.0%)
- African: 710 (2.6%)
- European: 698 (2.6%)
- Italian: 466 (1.7%)
- Scottish: 292 (1.1%)
- Scotch-Irish: 263 (1.0%)
- Brazilian: 254 (0.9%)
- Jamaican: 242 (0.9%)
- British: 230 (0.8%)
- French: 199 (0.7%)
- Haitian: 160 (0.6%)
- Dutch: 156 (0.6%)
- Polish: 114 (0.4%)
- French Canadian: 92 (0.3%)
- Lebanese: 86 (0.3%)
- Senegalese: 86 (0.3%)
- Canadian: 80 (0.3%)
- Ethiopian: 79 (0.3%)
- Norwegian: 68 (0.2%)
- Cape Verdean: 55 (0.2%)
- Trinidadian and Tobagonian: 47 (0.2%)
- Eastern European: 45 (0.2%)
- Czech: 44 (0.2%)
- West Indian: 43 (0.2%)
- Northern European: 42 (0.2%)
- Ukrainian: 39 (0.1%)
- Greek: 35 (0.1%)
- Hungarian: 34 (0.1%)
- Russian: 32 (0.1%)
- Guyanese: 30 (0.1%)
- Scandinavian: 29 (0.1%)
- British West Indian: 25 (0.09%)
- Kenyan: 24 (0.09%)
- Cajun: 24 (0.09%)
- Austrian: 19 (0.07%)
- Turkish: 19 (0.07%)
- Finnish: 18 (0.07%)
- Welsh: 18 (0.07%)
- Danish: 16 (0.06%)
- Czechoslovakian: 16 (0.06%)
- Israeli: 16 (0.06%)
- Slovak: 13 (0.05%)
- Bulgarian: 11 (0.04%)
- Portuguese: 10 (0.04%)
- Lithuanian: 10 (0.04%)
- Egyptian: 9 (0.03%)
- Iranian: 8 (0.03%)
Most common places of birth for foreign-born residents (%):
| Smyrna: | 15.7% (1,317) |
| Georgia: | 20.0% (223,400) |
| Smyrna: | 15.4% (1,297) |
| Georgia: | 9.2% (103,325) |
| Smyrna: | 7.4% (622) |
| Georgia: | 2.5% (27,846) |
| Smyrna: | 4.7% (392) |
| Georgia: | 3.6% (39,974) |
| Smyrna: | 3.7% (309) |
| Georgia: | 1.6% (17,476) |
| Smyrna: | 3.5% (298) |
| Georgia: | 2.1% (23,500) |
| Smyrna: | 3.1% (261) |
| Georgia: | 1.6% (18,211) |
| Smyrna: | 3.0% (252) |
| Georgia: | 1.6% (17,851) |
| Smyrna: | 2.7% (231) |
| Georgia: | 0.8% (8,613) |
| Smyrna: | 2.4% (204) |
| Georgia: | 2.1% (23,813) |
| Smyrna: | 2.4% (199) |
| Georgia: | 0.4% (4,565) |
| Smyrna: | 2.4% (198) |
| Georgia: | 3.9% (43,756) |
| Smyrna: | 2.1% (179) |
| Georgia: | 3.5% (39,227) |
| Smyrna: | 1.9% (161) |
| Georgia: | 4.1% (45,797) |
| Smyrna: | 1.9% (160) |
| Georgia: | 0.4% (4,387) |
| Smyrna: | 1.9% (159) |
| Georgia: | 0.3% (3,839) |
| Smyrna: | 1.9% (159) |
| Georgia: | 2.5% (27,794) |
| Smyrna: | 1.9% (158) |
| Georgia: | 0.8% (9,101) |
| Smyrna: | 1.6% (137) |
| Georgia: | 1.7% (18,651) |
| Smyrna: | 1.6% (134) |
| Georgia: | 1.8% (20,700) |
| Smyrna: | 1.6% (133) |
| Georgia: | 0.6% (6,160) |
Place of birth for U.S.-born residents:
- This state: 19,962
- Other state: 26,856
- Northeast: 6,037
- Midwest: 5,631
- South: 12,342
- West: 2,838
83.8% of Smyrna residents lived in the same house 1 years ago.
Out of people who lived in different houses, 28.6% lived in this county.
Out of people who lived in different counties, 56.9% lived in Georgia.
| Smyrna: | 83.8% |
| State average: | 86.6% |
Education attainment for males 25 years and older:
- No schooling: 91
- Nursery to 4th grade: 68
- 5th and 6th grade: 181
- 7th and 8th grade: 154
- 9th grade: 73
- 10th grade: 138
- 11th grade: 88
- 12th grade, no diploma: 179
- High school graduate (or equivalency): 2,270
- Less than 1 year of college: 776
- Some college more than 1 year, no degree: 2,345
- Associate degree: 1,164
- Bachelor's degree: 7,135
- Master's degree: 3,076
- Professional school degree: 1,007
- Doctorate degree: 568

Education attainment for females 25 years and older:
- No schooling: 60
- Nursery to 4th grade: 18
- 5th and 6th grade: 98
- 7th and 8th grade: 119
- 9th grade: 61
- 10th grade: 75
- 11th grade: 173
- 12th grade, no diploma: 29
- High school graduate (or equivalency): 2,686
- Less than 1 year of college: 1,177
- Some college more than 1 year, no degree: 2,921
- Associate degree: 1,666
- Bachelor's degree: 7,392
- Master's degree: 3,932
- Professional school degree: 800
- Doctorate degree: 375


Housing units in structures:
- One, detached: 12,133
- One, attached: 4,569
- Two: 326
- 3 or 4: 918
- 5 to 9: 2,883
- 10 to 19: 2,938
- 20 to 49: 1,650
- 50 or more: 1,308
- Mobile homes: 48
- Boats, RVs, vans, etc.: 65
Housing units lacking complete kitchen facilities in 2022: 0.5%
House/condo owner moved in on average 8 years ago
Renter moved in on average 3 years ago

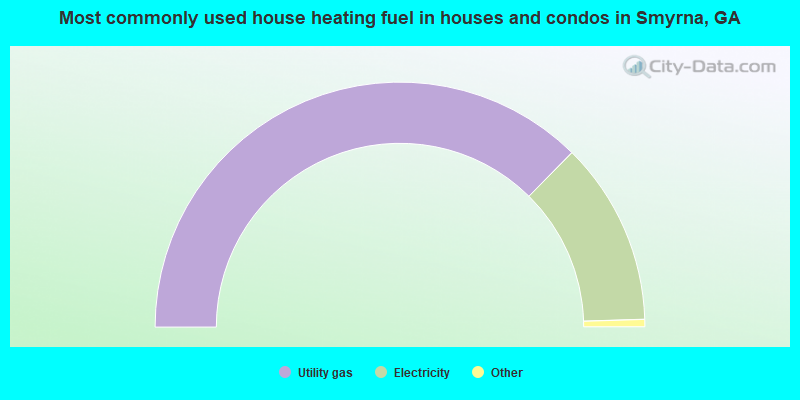
- 74.8%Utility gas
- 24.2%Electricity
- 0.7%Bottled, tank, or LP gas
- 0.2%No fuel used
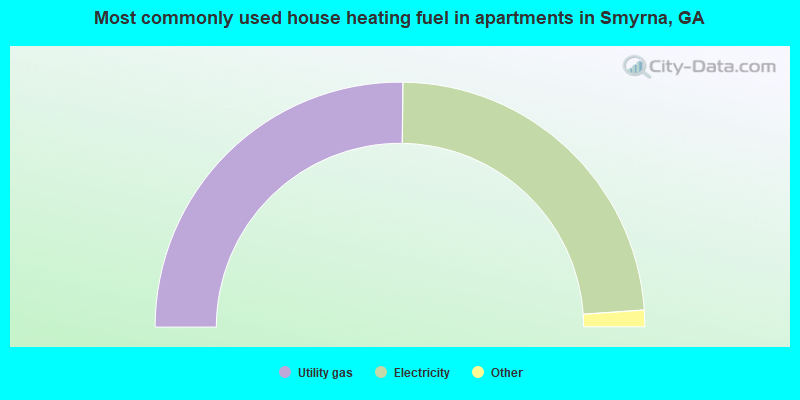
- 50.4%Utility gas
- 47.4%Electricity
- 1.9%Bottled, tank, or LP gas
- 0.2%No fuel used
Private vs. public school enrollment:
| Here: | 21.5% |
| Georgia: | 12.1% |
| Here: | 18.5% |
| Georgia: | 10.8% |
| Here: | 20.2% |
| Georgia: | 17.1% |


