Races in Smyrna, Georgia (GA) Detailed Stats
Data:
Races - White alone (%)
Races - White alone (% change since 2000)
Races - Black alone (%)
Races - Black alone (% change since 2000)
Races - American Indian alone (%)
Races - American Indian alone (% change since 2000)
Races - Asian alone (%)
Races - Asian alone (% change since 2000)
Races - Hispanic (%)
Races - Hispanic (% change since 2000)
Races - Native Hawaiian and Other Pacific Islander alone (%)
Races - Native Hawaiian and Other Pacific Islander alone (% change since 2000)
Races - Two or more races(%)
Races - Two or more races(% change since 2000)
Races - Other race alone (%)
Races - Other race alone (% change since 2000)
Racial diversity
Place of birth - Born in state of residence (%)
Place of birth - Born in state of residence (%) - White
Place of birth - Born in state of residence (%) - Black or African American
Place of birth - Born in state of residence (%) - Asian
Place of birth - Born in state of residence (%) - Hispanic or Latino
Place of birth - Born in state of residence (%) - American Indian and Alaska Native
Place of birth - Born in state of residence (%) - Multirace
Place of birth - Born in state of residence (%) - Other Race
Place of birth - Born in other state (%)
Place of birth - Born in other state (%) - White
Place of birth - Born in other state (%) - Black or African American
Place of birth - Born in other state (%) - Asian
Place of birth - Born in other state (%) - Hispanic or Latino
Place of birth - Born in other state (%) - American Indian and Alaska Native
Place of birth - Born in other state (%) - Multirace
Place of birth - Born in other state (%) - Other Race
Place of birth - Native, outside of US (%)
Place of birth - Native, outside of US (%) - White
Place of birth - Native, outside of US (%) - Black or African American
Place of birth - Native, outside of US (%) - Asian
Place of birth - Native, outside of US (%) - Hispanic or Latino
Place of birth - Native, outside of US (%) - American Indian and Alaska Native
Place of birth - Native, outside of US (%) - Multirace
Place of birth - Native, outside of US (%) - Other Race
Place of birth - Foreign born (%)
Place of birth - Foreign born (%) - White
Place of birth - Foreign born (%) - Black or African American
Place of birth - Foreign born (%) - Asian
Place of birth - Foreign born (%) - Hispanic or Latino
Place of birth - Foreign born (%) - American Indian and Alaska Native
Place of birth - Foreign born (%) - Multirace
Place of birth - Foreign born (%) - Other Race
Residents speaking English at home (%)
Residents speaking English at home - Born in the United States (%)
Residents speaking English at home - Native, born elsewhere (%)
Residents speaking English at home - Foreign born (%)
Residents speaking Spanish at home (%)
Residents speaking Spanish at home - Born in the United States (%)
Residents speaking Spanish at home - Native, born elsewhere (%)
Residents speaking Spanish at home - Foreign born (%)
Residents speaking other language at home (%)
Residents speaking other language at home - Born in the United States (%)
Residents speaking other language at home - Native, born elsewhere (%)
Residents speaking other language at home - Foreign born (%)
Marital status - Never married (%)
Marital status - Now married (%)
Marital status - Separated (%)
Marital status - Widowed (%)
Marital status - Divorced (%)
Ancestries Reported - Arab (%)
Ancestries Reported - Czech (%)
Ancestries Reported - Danish (%)
Ancestries Reported - Dutch (%)
Ancestries Reported - English (%)
Ancestries Reported - French (%)
Ancestries Reported - French Canadian (%)
Ancestries Reported - German (%)
Ancestries Reported - Greek (%)
Ancestries Reported - Hungarian (%)
Ancestries Reported - Irish (%)
Ancestries Reported - Italian (%)
Ancestries Reported - Lithuanian (%)
Ancestries Reported - Norwegian (%)
Ancestries Reported - Polish (%)
Ancestries Reported - Portuguese (%)
Ancestries Reported - Russian (%)
Ancestries Reported - Scotch-Irish (%)
Ancestries Reported - Scottish (%)
Ancestries Reported - Slovak (%)
Ancestries Reported - Subsaharan African (%)
Ancestries Reported - Swedish (%)
Ancestries Reported - Swiss (%)
Ancestries Reported - Ukrainian (%)
Ancestries Reported - United States (%)
Ancestries Reported - Welsh (%)
Ancestries Reported - West Indian (%)
Ancestries Reported - Other (%)
Geographical mobility - Same house 1 year ago (%)
Geographical mobility - Same house 1 year ago (%) - White
Geographical mobility - Same house 1 year ago (%) - Black or African American
Geographical mobility - Same house 1 year ago (%) - Asian
Geographical mobility - Same house 1 year ago (%) - Hispanic or Latino
Geographical mobility - Same house 1 year ago (%) - American Indian and Alaska Native
Geographical mobility - Same house 1 year ago (%) - Multirace
Geographical mobility - Same house 1 year ago (%) - Other Race
Geographical mobility - Moved within same county (%)
Geographical mobility - Moved within same county (%) - White
Geographical mobility - Moved within same county (%) - Black or African American
Geographical mobility - Moved within same county (%) - Asian
Geographical mobility - Moved within same county (%) - Hispanic or Latino
Geographical mobility - Moved within same county (%) - American Indian and Alaska Native
Geographical mobility - Moved within same county (%) - Multirace
Geographical mobility - Moved within same county (%) - Other Race
Geographical mobility - Moved from different county within same state (%)
Geographical mobility - Moved from different county within same state (%) - White
Geographical mobility - Moved from different county within same state (%) - Black or African American
Geographical mobility - Moved from different county within same state (%) - Asian
Geographical mobility - Moved from different county within same state (%) - Hispanic or Latino
Geographical mobility - Moved from different county within same state (%) - American Indian and Alaska Native
Geographical mobility - Moved from different county within same state (%) - Multirace
Geographical mobility - Moved from different county within same state (%) - Other Race
Geographical mobility - Moved from different state (%)
Geographical mobility - Moved from different state (%) - White
Geographical mobility - Moved from different state (%) - Black or African American
Geographical mobility - Moved from different state (%) - Asian
Geographical mobility - Moved from different state (%) - Hispanic or Latino
Geographical mobility - Moved from different state (%) - American Indian and Alaska Native
Geographical mobility - Moved from different state (%) - Multirace
Geographical mobility - Moved from different state (%) - Other Race
Geographical mobility - Moved from abroad (%)
Geographical mobility - Moved from abroad (%) - White
Geographical mobility - Moved from abroad (%) - Black or African American
Geographical mobility - Moved from abroad (%) - Asian
Geographical mobility - Moved from abroad (%) - Hispanic or Latino
Geographical mobility - Moved from abroad (%) - American Indian and Alaska Native
Geographical mobility - Moved from abroad (%) - Multirace
Geographical mobility - Moved from abroad (%) - Other Race
Place of birth for the foreign-born population - Ireland (%)
Place of birth for the foreign-born population - Denmark (%)
Place of birth for the foreign-born population - Norway (%)
Place of birth for the foreign-born population - Sweden (%)
Place of birth for the foreign-born population - United Kingdom (%)
Place of birth for the foreign-born population - England (%)
Place of birth for the foreign-born population - Scotland (%)
Place of birth for the foreign-born population - Other Northern Europe (%)
Place of birth for the foreign-born population - Austria (%)
Place of birth for the foreign-born population - Belgium (%)
Place of birth for the foreign-born population - France (%)
Place of birth for the foreign-born population - Germany (%)
Place of birth for the foreign-born population - Netherlands (%)
Place of birth for the foreign-born population - Switzerland (%)
Place of birth for the foreign-born population - Other Western Europe (%)
Place of birth for the foreign-born population - Greece (%)
Place of birth for the foreign-born population - Italy (%)
Place of birth for the foreign-born population - Portugal (%)
Place of birth for the foreign-born population - Spain (%)
Place of birth for the foreign-born population - Other Southern Europe (%)
Place of birth for the foreign-born population - Albania (%)
Place of birth for the foreign-born population - Belarus (%)
Place of birth for the foreign-born population - Bosnia and Herzegovina (%)
Place of birth for the foreign-born population - Bulgaria (%)
Place of birth for the foreign-born population - Croatia (%)
Place of birth for the foreign-born population - Czechoslovakia (%)
Place of birth for the foreign-born population - Hungary (%)
Place of birth for the foreign-born population - Latvia (%)
Place of birth for the foreign-born population - Lithuania (%)
Place of birth for the foreign-born population - North Macedonia (Macedonia) (%)
Place of birth for the foreign-born population - Moldova (%)
Place of birth for the foreign-born population - Poland (%)
Place of birth for the foreign-born population - Romania (%)
Place of birth for the foreign-born population - Russia (%)
Place of birth for the foreign-born population - Serbia (%)
Place of birth for the foreign-born population - Ukraine (%)
Place of birth for the foreign-born population - Other Eastern Europe (%)
Place of birth for the foreign-born population - China (%)
Place of birth for the foreign-born population - Hong Kong (%)
Place of birth for the foreign-born population - Taiwan (%)
Place of birth for the foreign-born population - Japan (%)
Place of birth for the foreign-born population - Korea (%)
Place of birth for the foreign-born population - Other Eastern Asia (%)
Place of birth for the foreign-born population - Afghanistan (%)
Place of birth for the foreign-born population - Bangladesh (%)
Place of birth for the foreign-born population - India (%)
Place of birth for the foreign-born population - Iran (%)
Place of birth for the foreign-born population - Kazakhstan (%)
Place of birth for the foreign-born population - Nepal (%)
Place of birth for the foreign-born population - Pakistan (%)
Place of birth for the foreign-born population - Sri Lanka (%)
Place of birth for the foreign-born population - Uzbekistan (%)
Place of birth for the foreign-born population - Other South Central Asia (%)
Place of birth for the foreign-born population - Burma (%)
Place of birth for the foreign-born population - Cambodia (%)
Place of birth for the foreign-born population - Indonesia (%)
Place of birth for the foreign-born population - Laos (%)
Place of birth for the foreign-born population - Malaysia (%)
Place of birth for the foreign-born population - Philippines (%)
Place of birth for the foreign-born population - Singapore (%)
Place of birth for the foreign-born population - Thailand (%)
Place of birth for the foreign-born population - Vietnam (%)
Place of birth for the foreign-born population - Other South Eastern Asia (%)
Place of birth for the foreign-born population - Armenia (%)
Place of birth for the foreign-born population - Iraq (%)
Place of birth for the foreign-born population - Israel (%)
Place of birth for the foreign-born population - Jordan (%)
Place of birth for the foreign-born population - Kuwait (%)
Place of birth for the foreign-born population - Lebanon (%)
Place of birth for the foreign-born population - Saudi Arabia (%)
Place of birth for the foreign-born population - Syria (%)
Place of birth for the foreign-born population - Turkey (%)
Place of birth for the foreign-born population - Yemen (%)
Place of birth for the foreign-born population - Other Western Asia (%)
Place of birth for the foreign-born population - Eritrea (%)
Place of birth for the foreign-born population - Ethiopia (%)
Place of birth for the foreign-born population - Kenya (%)
Place of birth for the foreign-born population - Somalia (%)
Place of birth for the foreign-born population - Uganda (%)
Place of birth for the foreign-born population - Zimbabwe (%)
Place of birth for the foreign-born population - Other Eastern Africa (%)
Place of birth for the foreign-born population - Cameroon (%)
Place of birth for the foreign-born population - Congo (%)
Place of birth for the foreign-born population - Democratic Republic of Congo (Zaire) (%)
Place of birth for the foreign-born population - Other Middle Africa (%)
Place of birth for the foreign-born population - Egypt (%)
Place of birth for the foreign-born population - Morocco (%)
Place of birth for the foreign-born population - Sudan (%)
Place of birth for the foreign-born population - Other Northern Africa (%)
Place of birth for the foreign-born population - South Africa (%)
Place of birth for the foreign-born population - Other Southern Africa (%)
Place of birth for the foreign-born population - Cabo Verde (%)
Place of birth for the foreign-born population - Ghana (%)
Place of birth for the foreign-born population - Liberia (%)
Place of birth for the foreign-born population - Nigeria (%)
Place of birth for the foreign-born population - Senegal (%)
Place of birth for the foreign-born population - Sierra Leone (%)
Place of birth for the foreign-born population - Other Western Africa (%)
Place of birth for the foreign-born population - Australia (%)
Place of birth for the foreign-born population - New Zealand (%)
Place of birth for the foreign-born population - Fiji (%)
Place of birth for the foreign-born population - Micronesia (%)
Place of birth for the foreign-born population - Bahamas (%)
Place of birth for the foreign-born population - Barbados (%)
Place of birth for the foreign-born population - Cuba (%)
Place of birth for the foreign-born population - Dominica (%)
Place of birth for the foreign-born population - Dominican Republic (%)
Place of birth for the foreign-born population - Grenada (%)
Place of birth for the foreign-born population - Haiti (%)
Place of birth for the foreign-born population - Jamaica (%)
Place of birth for the foreign-born population - St. Vincent and the Grenadines (%)
Place of birth for the foreign-born population - Trinidad and Tobago (%)
Place of birth for the foreign-born population - West Indies (%)
Place of birth for the foreign-born population - Other Caribbean (%)
Place of birth for the foreign-born population - Belize (%)
Place of birth for the foreign-born population - Costa Rica (%)
Place of birth for the foreign-born population - El Salvador (%)
Place of birth for the foreign-born population - Guatemala (%)
Place of birth for the foreign-born population - Honduras (%)
Place of birth for the foreign-born population - Mexico (%)
Place of birth for the foreign-born population - Nicaragua (%)
Place of birth for the foreign-born population - Panama (%)
Place of birth for the foreign-born population - Other Central America (%)
Place of birth for the foreign-born population - Argentina (%)
Place of birth for the foreign-born population - Bolivia (%)
Place of birth for the foreign-born population - Brazil (%)
Place of birth for the foreign-born population - Chile (%)
Place of birth for the foreign-born population - Colombia (%)
Place of birth for the foreign-born population - Ecuador (%)
Place of birth for the foreign-born population - Guyana (%)
Place of birth for the foreign-born population - Peru (%)
Place of birth for the foreign-born population - Uruguay (%)
Place of birth for the foreign-born population - Venezuela (%)
Place of birth for the foreign-born population - Other South America (%)
Place of birth for the foreign-born population - Canada (%)
Place of birth for the foreign-born population - Other Northern America (%)
Place of birth for the foreign-born population - Other (%)
Latest news about races in Smyrna, GA collected exclusively by city-data.com from local newspapers, TV, and radio stations
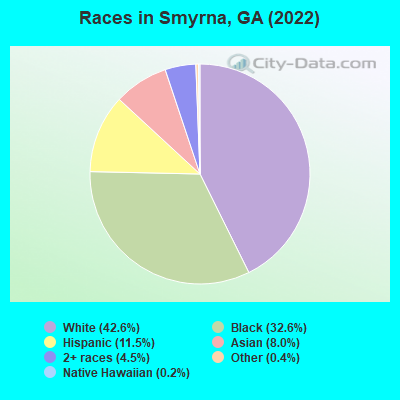
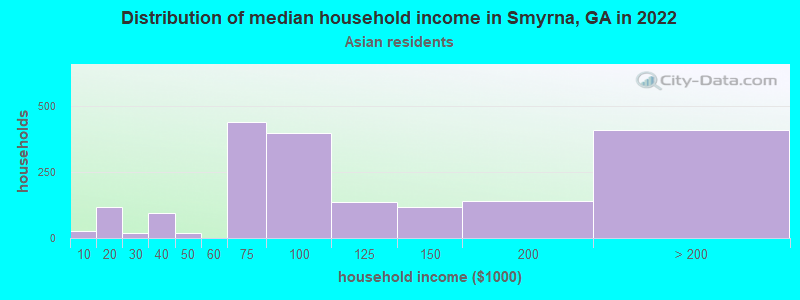
According to 2022 data, the most numerous races in Smyrna, GA are White alone (23,976 residents), Black alone (18,380 residents), and Hispanic (6,472 residents). 80.0% of Smyrna residents speak English at home. 14.9% of Smyrna, GA residents are foreign-born (6.5% born in Latin America, 4.4% born in Asia, 1.7% born in Africa), which is 33.0% greater than the foreign-born rate of 10.0% across the entire state of Georgia.
Race distribution in Smyrna
2000 2022
5,128,661 62.6% White alone 2,331,465 28.5% Black alone 435,227 5.3% Hispanic 171,513 2.1% Asian alone 87,364 1.1% Two or more races 17,670 0.2% American Indian alone 11,275 0.1% Other race alone 3,278 0.04% Native Hawaiian and Other
5,415,657 49.6% White alone 3,349,240 30.7% Black alone 1,132,604 10.4% Hispanic 479,156 4.4% Asian alone 462,923 4.2% Two or more races 54,416 0.5% Other race alone 11,923 0.1% American Indian alone 6,957 0.06% Native Hawaiian and Other
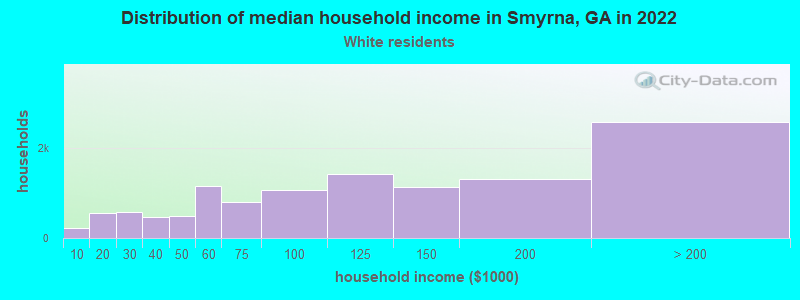
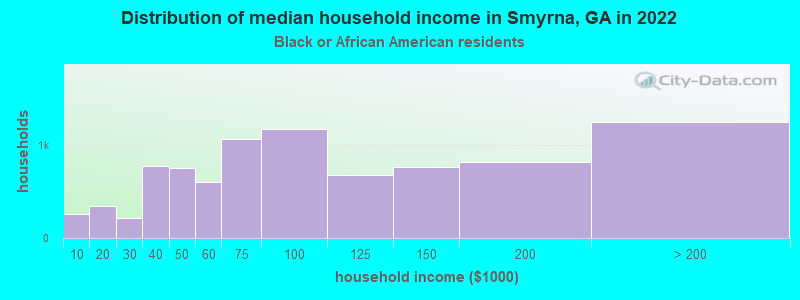
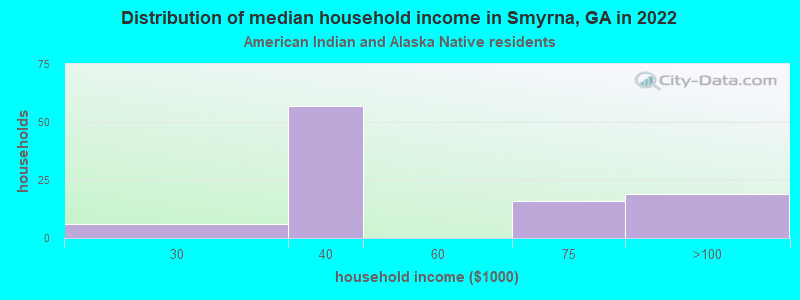
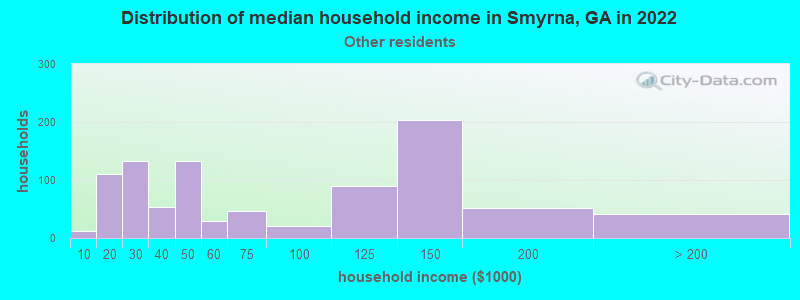
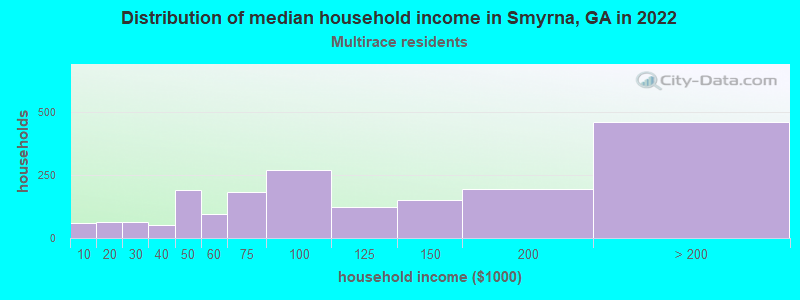
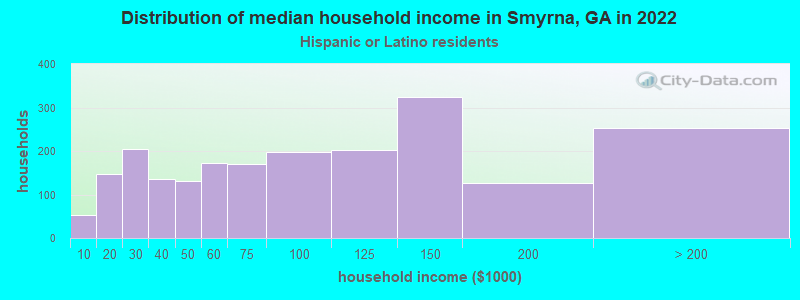
Income and house value in Smyrna Median household income in 2022 $109,467 White non-Hispanic householders$80,030 Black householders$88,054 Asian householders$57,985 Some other race householders$89,797 Two or more races householders$76,893 Hispanic or Latino race householdersMedian 2022 house value $479,258 White Non-Hispanic householders$410,639 Black or African American householders$538,896 American Indian or Alaska Native householders $512,311 Asian householders$353,516 Some other race householders$430,398 Two or more races householders$352,079 Hispanic or Latino householders
Median age by race in Smyrna
40.4 Median age for White residents40.5 41.1 35.1 Median age for Black or African American residents34.3 35.0 23.4 Median age for American Indian / Alaska Native residents21.2 58.7 33.9 Median age for Asian residents33.0 35.7 35.6 Median age for Native Hawaiian / Pacific Islander residents37.7 -776,776,776.0 27.0 Median age for Other race residents26.5 28.2 30.6 Median age for Two or more races residents33.2 29.6 40.0 Median age for White alone residents39.7 41.2 30.5 Median age for Hispanic or Latino residents29.1 32.4
Owner/renter occupied households by race in Smyrna
House owners and renters - White residents 7,957 67.7% Owner occupied3,791 32.3% Renter occupiedHouse owners and renters - Black or African American residents 3,659 42.1% Owner occupied5,027 57.9% Renter occupiedHouse owners and renters - American Indian / Alaska Native residents 36 19.4% Owner occupied149 80.6% Renter occupiedHouse owners and renters - Asian residents 1,370 69.7% Owner occupied596 30.3% Renter occupiedHouse owners and renters - Native Hawaiian / Pacific Islander residents 87 78.0% Owner occupied25 22.0% Renter occupiedHouse owners and renters - Other race residents 392 50.9% Owner occupied377 49.1% Renter occupiedHouse owners and renters - Two or more races residents 1,134 59.5% Owner occupied773 40.5% Renter occupiedHouse owners and renters - White alone residents 7,854 67.8% Owner occupied3,731 32.2% Renter occupiedHouse owners and renters - Hispanic or Latino residents 1,054 53.2% Owner occupied929 46.8% Renter occupied
Language usage in Smyrna
English speakers - Total 80.0% of residents of Smyrna speak English at home.
9.5% of residents speak Spanish at home 2,997 60.4% Speak English very well1,963 39.6% Speak English less than very well10.5% of residents speak other language at home 4,139 75.4% Speak English very well1,352 24.6% Speak English less than very well
English speakers - Born in the United States 94.5% of residents of Smyrna speak English at home.
2.5% of residents speak Spanish at home 556 86.2% Speak English very well89 13.8% Speak English less than very well3.2% of residents speak other language at home 764 91.7% Speak English very well69 8.3% Speak English less than very well
English speakers - Native, born elsewhere 57.2% of residents of Smyrna speak English at home.
32.8% of residents speak Spanish at home 277 96.2% Speak English very well11 3.8% Speak English less than very well6.7% of residents speak other language at home 59 100.0% Speak English very well
English speakers - Foreign-born 20.4% of residents of Smyrna speak English at home.
33.9% of residents speak Spanish at home 1,107 38.8% Speak English very well1,749 61.2% Speak English less than very well45.5% of residents speak other language at home 2,623 68.4% Speak English very well1,210 31.6% Speak English less than very well
White (Caucasian) - Speak only English Native:
99.1% (21,278)Foreign-born:
32.3% (371)
White (Caucasian) - Speak another language Native:
1.7% (360)Foreign-born:
67.8% (779)
Black or African American - Speak only English Native:
97.6% (14,634)Foreign-born:
32.7% (664)
Black or African American - Speak another language Native:
2.4% (366)Foreign-born:
67.6% (1,375)
American Indian / Alaska Native - Speak only English Native:
33.1% (43)Foreign-born:
0.4% (2)
American Indian / Alaska Native - Speak another language Native:
14.9% (19)Foreign-born:
99.9% (435)
Asian - Speak only English Native:
43.3% (976)Foreign-born:
19.7% (431)
Asian - Speak another language Native:
58.1% (1,309)Foreign-born:
80.7% (1,766)
Other race - Speak only English Native:
21.2% (308)Foreign-born:
0.2% (2)
Other race - Speak another language Native:
78.9% (1,149)Foreign-born:
100.0% (1,292)
Two or more races - Speak only English Native:
76.5% (2,785)Foreign-born:
17.4% (221)
Two or more races - Speak another language Native:
22.9% (834)Foreign-born:
82.7% (1,052)
White alone - Speak only English Native:
98.5% (21,086)Foreign-born:
41.6% (399)
White alone - Speak another language Native:
1.6% (334)Foreign-born:
58.8% (564)
Hispanic or Latino - Speak only English Native:
39.8% (1,223)Foreign-born:
3.1% (93)
Hispanic or Latino - Speak another language Native:
60.2% (1,849)Foreign-born:
96.9% (2,937)
Foreign-born residents in Smyrna 8,406 residents are foreign born (6.5% Latin America , 4.4% Asia , 1.7% Africa ).
This city:
14.9%Georgia:
10.4%
Marital status for residents in Smyrna Marital status - White (Caucasian) population 15 years and over
Males 30.7% Never married57.2% Now married0.8% Separated3.1% Widowed8.2% DivorcedFemales 29.8% Never married46.3% Now married1.6% Separated5.6% Widowed16.7% DivorcedWomen who gave birth in the past 12 months Now married:
95.4% (310)Unmarried:
4.6% (15)
Women who did not give birth in the past 12 months Now married:
49.8% (3,140)Unmarried:
50.2% (3,161)
Marital status - Black or African American population 15 years and over
Males 42.9% Never married42.3% Now married1.3% Separated1.4% Widowed12.1% DivorcedFemales 44.3% Never married28.5% Now married1.6% Separated3.9% Widowed21.7% DivorcedWomen who gave birth in the past 12 months Now married:
90.8% (142)Unmarried:
9.2% (14)
Women who did not give birth in the past 12 months Now married:
26.4% (1,366)Unmarried:
73.6% (3,817)
Marital status - American Indian / Alaska Native population 15 years and over
Males 85.7% Never married2.0% Now married0.0% Separated0.0% Widowed12.4% DivorcedFemales 0.0% Never married15.9% Now married0.0% Separated34.1% Widowed50.0% DivorcedMarital status - Asian population 15 years and over
Males 39.1% Never married59.0% Now married0.0% Separated1.3% Widowed0.6% DivorcedFemales 24.3% Never married69.2% Now married4.4% Separated0.9% Widowed1.2% DivorcedWomen who gave birth in the past 12 months Now married:
100.0% (138)Unmarried:
0.0% (0)
Women who did not give birth in the past 12 months Now married:
64.0% (746)Unmarried:
36.0% (419)
Marital status - Native Hawaiian / Pacific Islander population 15 years and over
Males 0.0% Never married100.0% Now married0.0% Separated0.0% Widowed0.0% DivorcedFemales 0.0% Never married100.0% Now married0.0% Separated0.0% Widowed0.0% DivorcedWomen who did not give birth in the past 12 months Now married:
100.0% (23)Unmarried:
0.0% (0)
Marital status - Other race population 15 years and over
Males 58.4% Never married32.1% Now married5.8% Separated0.0% Widowed3.6% DivorcedFemales 40.5% Never married39.3% Now married4.4% Separated3.0% Widowed12.8% DivorcedWomen who gave birth in the past 12 months Now married:
52.9% (36)Unmarried:
47.1% (32)
Women who did not give birth in the past 12 months Now married:
37.4% (237)Unmarried:
62.6% (396)
Marital status - Two or more races population 15 years and over
Males 34.3% Never married62.4% Now married1.0% Separated0.8% Widowed1.5% DivorcedFemales 45.6% Never married40.4% Now married1.3% Separated1.8% Widowed10.9% DivorcedWomen who gave birth in the past 12 months Now married:
100.0% (111)Unmarried:
0.0% (0)
Women who did not give birth in the past 12 months Now married:
40.1% (637)Unmarried:
59.9% (954)
Marital status - White alone, not Hispanic / Latino population 15 years and over
Males 29.7% Never married57.9% Now married0.8% Separated3.3% Widowed8.3% DivorcedFemales 29.2% Never married46.3% Now married1.7% Separated5.5% Widowed17.3% DivorcedWomen who gave birth in the past 12 months Now married:
95.2% (314)Unmarried:
4.8% (16)
Women who did not give birth in the past 12 months Now married:
49.8% (3,101)Unmarried:
50.2% (3,122)
Marital status - Hispanic or Latino population 15 years and over
Males 53.3% Never married39.3% Now married3.4% Separated0.0% Widowed4.0% DivorcedFemales 42.0% Never married41.5% Now married1.8% Separated3.6% Widowed11.1% DivorcedWomen who gave birth in the past 12 months Now married:
77.5% (114)Unmarried:
22.5% (33)
Women who did not give birth in the past 12 months Now married:
43.7% (725)Unmarried:
56.3% (932)
Ancestries in Smyrna
2,016 7.4% English1,357 5.0% American1,142 4.2% German1,113 4.1% Irish818 3.0% Nigerian710 2.6% African698 2.6% European466 1.7% Italian292 1.1% Scottish263 1.0% Scotch-Irish254 0.9% Brazilian242 0.9% Jamaican230 0.8% British199 0.7% French160 0.6% Haitian156 0.6% Dutch114 0.4% Polish92 0.3% French Canadian86 0.3% Lebanese86 0.3% Senegalese80 0.3% Canadian79 0.3% Ethiopian68 0.2% Norwegian55 0.2% Cape Verdean47 0.2% Trinidadian and Tobagonian45 0.2% Eastern European44 0.2% Czech43 0.2% West Indian42 0.2% Northern European39 0.1% Ukrainian35 0.1% Greek34 0.1% Hungarian32 0.1% Russian30 0.1% Guyanese29 0.1% Scandinavian25 0.09% British West Indian24 0.09% Kenyan24 0.09% Cajun19 0.07% Austrian19 0.07% Turkish18 0.07% Finnish18 0.07% Welsh16 0.06% Danish16 0.06% Czechoslovakian16 0.06% Israeli13 0.05% Slovak11 0.04% Bulgarian10 0.04% Portuguese10 0.04% Lithuanian9 0.03% Egyptian8 0.03% Iranian
Geographical mobility in Smyrna Same house 1 year ago 20,595 86.5% White (Caucasian)14,994 82.0% Black or African American434 99.1% American Indian / Alaska Native3,667 81.1% Asian2,525 87.2% Other race4,181 80.2% Two or more races20,438 86.4% White alone, not Hispanic / Latino5,414 85.7% Hispanic or LatinoMoved within same county 1,082 4.5% White / Caucasian1,192 6.5% Black or African American404 8.9% Asian120 65.7% Native Hawaiian / Pacific Islander285 9.8% Other race303 5.8% Two or more races1,108 4.7% White alone, not Hispanic / Latino512 8.1% Hispanic or LatinoMoved within same state 1,099 4.6% White / Caucasian1,168 6.4% Black or African American2 0.4% American Indian / Alaska Native107 2.4% Asian40 1.4% Other race242 4.6% Two or more races1,073 4.5% White alone, not Hispanic / Latino165 2.6% Hispanic or LatinoMoved from different state 923 3.9% White / Caucasian525 2.9% Black or African American68 1.5% Asian27 0.9% Other race525 10.1% Two or more races893 3.8% White alone, not Hispanic / Latino306 4.8% Hispanic or LatinoMoved from abroad 163 0.7% White205 1.1% Black or African American150 3.3% Asian36 19.8% Native Hawaiian / Pacific Islander22 0.7% Other race6 0.1% Two or more races185 0.8% White alone, not Hispanic / Latino15 0.2% Hispanic or Latino
Children Nativity (place of birth) in Smyrna
Children under 6 years - Living with two parents Both parents native 2,490 99.7% Native7 0.3% Foreign-bornBoth parents foreign-born 499 74.0% Native175 26.0% Foreign-bornOne native, one foreign-born parent 178 100.0% NativeChildren under 6 years - Living with one parent Native parent 997 100.0% NativeForeign-born parent 418 100.0% NativeChildren 6 to 17 years - Living with two parents Both parents native 2,980 100.0% NativeBoth parents foreign-born 655 67.4% Native316 32.6% Foreign-bornOne native, one foreign-born parent 850 83.0% Native174 17.0% Foreign-bornChildren 6 to 17 years - Living with one parent Native parent 1,526 100.0% NativeForeign-born parent 268 53.3% Native235 46.7% Foreign-born
Grandparents responsible for own grandchildren in Smyrna
Grandparents (30 to 59 years) White / Caucasian 52 100.0% Responsible for grandchildrenBlack or African American 59 51.9% Responsible for grandchildren55 48.1% Not responsible for grandchildrenAsian 103 100.0% Responsible for grandchildrenOther race 91 100.0% Not responsible for grandchildrenWhite alone, not Hispanic / Latino 35 100.0% Responsible for grandchildrenHispanic or Latino 65 100.0% Not responsible for grandchildrenGrandparents (60 years and over) White / Caucasian 79 34.7% Responsible for grandchildren148 65.3% Not responsible for grandchildrenBlack or African American 16 7.8% Responsible for grandchildren196 92.2% Not responsible for grandchildrenOther race 43 100.0% Responsible for grandchildrenWhite alone, not Hispanic / Latino 80 32.8% Responsible for grandchildren163 67.2% Not responsible for grandchildrenHispanic or Latino 50 100.0% Responsible for grandchildren