Sedro-Woolley, WA (Washington) Houses and Residents
| Sedro-Woolley: | $423,708 |
| Washington: | $569,500 |
Mean price in 2022:
Detached houses: $382,769
Here: $382,769 State: $734,307 Mobile homes: $136,652
Here: $136,652 State: $218,362
Total population: 10,764 (Urban population: 8,642, Rural population: 56 (all nonfarm))
Houses: 4,865 (4,664 occupied: 2,684 owner occupied, 1,876 renter occupied)
| % of renters here: | 41% |
| State: | 36% |
Housing density: 1,432 houses/condos per square mile
Median price asked for vacant for-sale houses and condos in 2022 in this county: $430,980.
Median contract rent in 2022: $1,298 (lower quartile is $1,065, upper quartile is $1,666)
Median rent asked for vacant for-rent units in 2022: $14,036
Median gross rent in Sedro-Woolley, WA in 2022: $1,572
Housing units in Sedro-Woolley with a mortgage: 2,030 (80 second mortgage, 0 home equity loan, 54 both second mortgage and home equity loan)
Houses without a mortgage: 10
Median household income for houses/condos with a mortgage: $97,800
Median household income for apartments without a mortgage: $73,459
Median monthly housing costs: $1,589
Compare current foreclosures near Sedro-Woolley, WA:
| Photo | Address | Area | Beds / Baths | Price | Details |
|---|---|---|---|---|---|

|
#1
Mount Baker Loop
Mount Vernon, WA 98273
|
2,743 sq. feet
|
2 baths 4 beds |
show details | |

|
#2
64th Ave NW
Stanwood, WA 98292
|
- sq. feet
|
2 baths 3 beds |
show details | |

|
#3
Fruitdale Rd
Sedro Woolley, WA 98284
|
1,188 sq. feet
|
2 baths 3 beds |
show details | |

|
#4
Wildflower Way
Sedro Woolley, WA 98284
|
904 sq. feet
|
1 baths 2 beds |
show details | |

|
#5
Fidalgo Pl
Sedro Woolley, WA 98284
|
1,259 sq. feet
|
2 baths 3 beds |
show details | |

|
#6
Porter St
Mount Vernon, WA 98273
|
2,116 sq. feet
|
1 baths 3 beds |
show details | |

|
#7
Marigold Dr Unit 36
Bellingham, WA 98229
|
460 sq. feet
|
1 baths 1 beds |
show details | |

|
#8
W Lake Ketchum Rd
Stanwood, WA 98292
|
2,613 sq. feet
|
2 baths 3 beds |
show details | |

|
#9
Mashie St
Anacortes, WA 98221
|
1,152 sq. feet
|
1 baths 2 beds |
show details | |

|
#10
Wildflower Way
Sedro Woolley, WA 98284
|
908 sq. feet
|
1 baths 2 beds |
show details |
| Photo | Address | Area | Beds / Baths | Price | Details |
|---|---|---|---|---|---|

|
#11
W Chinook Dr
Burlington, WA 98233
|
1,586 sq. feet
|
2 baths 3 beds |
show details | |

|
#12
N Waugh Rd
Mount Vernon, WA 98273
|
1,612 sq. feet
|
2 baths 3 beds |
show details | |

|
#13
Ridge Way
Mount Vernon, WA 98273
|
2,929 sq. feet
|
3 baths 3 beds |
show details | |

|
#14
N Belair Dr
Mount Vernon, WA 98273
|
1,120 sq. feet
|
1 baths 3 beds |
show details | |

|
#15
N 18th Pl
Mount Vernon, WA 98273
|
1,184 sq. feet
|
3 baths 3 beds |
show details | |

|
#16
N 17th St
Mount Vernon, WA 98273
|
2,780 sq. feet
|
3 baths 5 beds |
show details | |

|
#17
Karli St
Mount Vernon, WA 98274
|
1,656 sq. feet
|
2 baths 3 beds |
show details | |

|
#18
S 22nd Pl # B
Mount Vernon, WA 98274
|
2,516 sq. feet
|
3 baths 2 beds |
show details | |

|
#19
S 19th St
Mount Vernon, WA 98274
|
1,462 sq. feet
|
1 baths 4 beds |
show details | |

|
#20
Prairie Rd
Sedro Woolley, WA 98284
|
1,024 sq. feet
|
1 baths 3 beds |
show details |
| Photo | Address | Area | Beds / Baths | Price | Details |
|---|---|---|---|---|---|

|
#21
Pacific St
Sedro Woolley, WA 98284
|
1,458 sq. feet
|
1 baths 3 beds |
show details | |

|
#22
Mclean Rd
Mount Vernon, WA 98273
|
1,262 sq. feet
|
2 baths 2 beds |
show details | |

|
#23
Firwood Ln Apt 207
Mount Vernon, WA 98273
|
1,307 sq. feet
|
2 baths 3 beds |
show details | |

|
#24
W Hazel St
Mount Vernon, WA 98273
|
1,401 sq. feet
|
3 baths 6 beds |
show details | |

|
#25
Cleveland Ave
Mount Vernon, WA 98273
|
888 sq. feet
|
1 baths 3 beds |
show details | |

|
#26
Lakeside Dr
Sedro Woolley, WA 98284
|
1,040 sq. feet
|
1 baths 3 beds |
show details | |

|
#27
W Alder Dr
Sedro Woolley, WA 98284
|
2,365 sq. feet
|
2 baths 3 beds |
show details | |

|
#28
W Lake Samish Dr
Bellingham, WA 98229
|
4,242 sq. feet
|
2 baths 3 beds |
show details | |

|
#29
Marigold Dr
Bellingham, WA 98229
|
2,182 sq. feet
|
3 baths 3 beds |
show details | |

|
#30
Horseshoe Cir
Bellingham, WA 98229
|
1,229 sq. feet
|
2 baths 2 beds |
show details |
| Photo | Address | Area | Beds / Baths | Price | Details |
|---|---|---|---|---|---|

|
#31
308th St NE
Stanwood, WA 98292
|
2,365 sq. feet
|
3 baths 3 beds |
show details | |

|
#32
W Lake Ketchum Rd
Stanwood, WA 98292
|
2,613 sq. feet
|
2 baths 3 beds |
show details | |

|
#33
78th Dr NW
Stanwood, WA 98292
|
1,072 sq. feet
|
1 baths 3 beds |
show details | |

|
#34
Eagle Dr
Burlington, WA 98233
|
2,100 sq. feet
|
2 baths 2 beds |
show details | |

|
#35
N Laventure Rd
Mount Vernon, WA 98273
|
960 sq. feet
|
1 baths 3 beds |
show details | |

|
#36
Jameson St
Sedro Woolley, WA 98284
|
912 sq. feet
|
1 baths 2 beds |
show details | |

|
#37
Nelson St
Sedro Woolley, WA 98284
|
1,487 sq. feet
|
1 baths 3 beds |
show details | |

|
#38
E Hazel Ave
Burlington, WA 98233
|
2,071 sq. feet
|
2 baths 3 beds |
show details | |

|
#39
Cascadia Dr
Sedro Woolley, WA 98284
|
1,177 sq. feet
|
2 baths 3 beds |
show details | |

|
#40
N Skagit St
Burlington, WA 98233
|
1,892 sq. feet
|
2 baths 2 beds |
show details |
| Photo | Address | Area | Beds / Baths | Price | Details |
|---|---|---|---|---|---|

|
#41
Kenkirk Pl
Burlington, WA 98233
|
1,314 sq. feet
|
1 baths 3 beds |
show details | |

|
#42
Gardner Rd
Burlington, WA 98233
|
1,542 sq. feet
|
2 baths 4 beds |
show details | |

|
#43
Park Cottage Pl
Sedro Woolley, WA 98284
|
1,259 sq. feet
|
2 baths 3 beds |
show details | |

|
#44
Aerie Ln
Sedro Woolley, WA 98284
|
1,064 sq. feet
|
2 baths 3 beds |
show details | |

|
#45
Reed St
Sedro Woolley, WA 98284
|
1,470 sq. feet
|
1 baths 2 beds |
show details | |

|
#46
Puget Ave
Sedro Woolley, WA 98284
|
1,356 sq. feet
|
2 baths 3 beds |
show details | |

|
#47
F And S Grade Rd
Sedro Woolley, WA 98284
|
1,311 sq. feet
|
1 baths - beds |
show details | |

|
#48
Old Highway 99 North Rd # 99
Burlington, WA 98233
|
1,188 sq. feet
|
2 baths - beds |
show details | |

|
#49
E Section St Unit 89
Mount Vernon, WA 98274
|
1,487 sq. feet
|
2 baths - beds |
show details | |

|
Check over 1 million property listings on Foreclosure.com!
|
browse all offers | |||

Latest news about housing in Sedro-Woolley, WA collected exclusively by city-data.com from local newspapers, TV, and radio stations

 | Sedro-Woolley area (14 replies) |
| Help me narrow down some areas? (91 replies) |
| Austin to Seattle or The Berkshires? (21 replies) |
| Skagit Valley, Washington (76 replies) |
| Commuting from Oak Harbor to Mount Vernon (24 replies) |
| DESPERATE. need HELP on apartments in the Mt Vernon / Anacortes / Bellingham area (4 replies) |

Median year apartment built: 1990
Household type by relationship:
Households: 12,633- Male householders: 2,658 (704 living alone), Female householders: 1,963 (377 living alone)
2,110 spouses (2,088 opposite-sex spouses), 608 unmarried partners, (608 opposite-sex unmarried partners), 3,623 children (3,496 natural, 38 adopted, 89 stepchildren), 287 grandchildren, 30 brothers or sisters, 53 parents, 3 foster children, 322 other relatives, 249 non-relatives
- In group quarters: 722
Size of family households: 1,075 2-persons, 744 3-persons, 888 4-persons, 161 5-persons, 208 6-persons, 59 7-or-more-persons.
Size of nonfamily households: 1,141 1-person, 228 2-persons, 38 3-persons.
1,294 married couples with children.
1,038 single-parent households (683 men, 355 women).
79.7% of residents of Sedro-Woolley speak English at home.
17.9% of residents speak Spanish at home (68% speak English very well, 15% speak English well, 13% speak English not well, 5% don't speak English at all).
0.4% of residents speak other Indo-European language at home (100% speak English very well).
1.5% of residents speak Asian or Pacific Island language at home (24% speak English very well, 48% speak English well, 19% speak English not well, 9% don't speak English at all).
Foreign born population: 863 (6.8%)
(37.2% of them are naturalized citizens)
| Here: | 5.6 |
| State: | 6.5 |
| Here: | 4.0 |
| State: | 3.9 |

- Bedrooms in owner-occupied houses and condos in Sedro-Woolley, Washington
- 14no bedroom
- 501 bedroom
- 7562 bedrooms
- 1,3333 bedrooms
- 4454 bedrooms
- 875+ bedrooms

- Bedrooms in renter-occupied apartments in Sedro-Woolley, Washington
- 144no bedroom
- 2631 bedroom
- 6512 bedrooms
- 7413 bedrooms
- 654 bedrooms
- 135+ bedrooms

- Cars and other vehicles available in Sedro-Woolley in owner-occupied houses/condos
- 65no vehicle
- 2751 vehicle
- 1,2402 vehicles
- 8063 vehicles
- 1724 vehicles
- 1275+ vehicles

- Cars and other vehicles available in Sedro-Woolley in renter-occupied apartments
- 162no vehicle
- 4801 vehicle
- 7752 vehicles
- 2323 vehicles
- 1704 vehicles
- 585+ vehicles

- Rooms in owner-occupied houses in Sedro-Woolley, Washington
- 141 room
- 502 rooms
- 633 rooms
- 3784 rooms
- 8105 rooms
- 5516 rooms
- 3957 rooms
- 2738 rooms
- 1519+ rooms

- Rooms in renter-occupied apartments in Sedro-Woolley, Washington
- 1441 room
- 1112 rooms
- 2113 rooms
- 7614 rooms
- 2715 rooms
- 1956 rooms
- 1157 rooms
- 568 rooms
- 139+ rooms


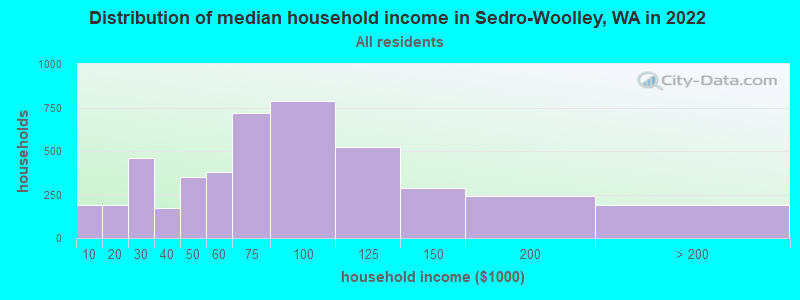
Sedro-Woolley, WA household income distribution

- 187Less than $10,000
- 190$10,000 to $19,999
- 457$20,000 to $29,999
- 170$30,000 to $39,999
- 350$40,000 to $49,999
- 382$50,000 to $59,999
- 717$60,000 to $74,999
- 787$75,000 to $99,999
- 523$100,000 to $124,999
- 288$125,000 to $149,999
- 241$150,000 to $199,999
- 190$200,000 or more
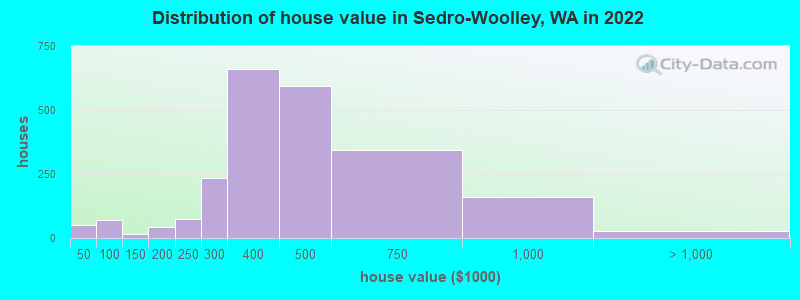
Home value of owner - occupied houses in 2022 in Sedro-Woolley, WA
-
- 14$20,000 to $24,999
- 23$25,000 to $29,999
- 11$30,000 to $34,999
- 36$60,000 to $69,999
- 32$70,000 to $79,999
- 11$100,000 to $124,999
- 3$125,000 to $149,999
- 20$150,000 to $174,999
- 21$175,000 to $199,999
- 73$200,000 to $249,999
- 235$250,000 to $299,999
- 658$300,000 to $399,999
- 592$400,000 to $499,999
- 344$500,000 to $749,999
- 161$750,000 to $999,999
- 21$1,000,000 to $1,499,999
- 4$1,500,000 to $1,999,999
Rent paid by renters in 2022 in Sedro-Woolley, WA
-
- 26$100 to $149
- 85$150 to $199
- 47$200 to $249
- 10$250 to $299
- 30$500 to $549
- 20$550 to $599
- 47$650 to $699
- 6$750 to $799
- 42$800 to $899
- 119$900 to $999
- 415$1,000 to $1,249
- 304$1,250 to $1,499
- 512$1,500 to $1,999
- 35$2,500 to $2,999
- 99No cash rent


Percentage of workers working in this county: 74.2%
Number of people working at home: 740 (13.0% of all workers)

Travel time to work (commute)
- Less than 5 minutes: 80
- 5 to 9 minutes: 464
- 10 to 14 minutes: 581
- 15 to 19 minutes: 724
- 20 to 24 minutes: 820
- 25 to 29 minutes: 489
- 30 to 34 minutes: 612
- 35 to 39 minutes: 119
- 40 to 44 minutes: 89
- 45 to 59 minutes: 427
- 60 to 89 minutes: 478
- 90 or more minutes: 128
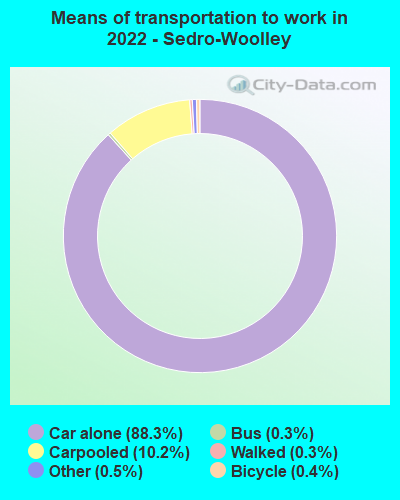
Means of transportation to work:
- Drove a car alone: 3,752 (74.7%)
- Carpooled: 448 (8.9%)
- Bus: 7 (0.1%)
- Taxi: 19 (0.4%)
- Bicycle: 16 (0.3%)
- Walked: 13 (0.3%)
- Worked at home: 740 (14.7%)

- Unemployment by race in 2022
- Unemployment rate for White non-Hispanic residents
- 5.3%Males
- 4.5%Females
- Unemployment rate for other race residents
- 20.7%Males
- Unemployment rate for two or more race residents
- 4.3%Males
- 6.5%Females
- Unemployment rate for Hispanic or Latino residents
- 10.5%Males

- Year of entry for the foreign-born population in Sedro-Woolley, Washington
- 2292010 or later
- 1172000 to 2009
- 3451990 to 1999
- 571980 to 1989
- 401970 to 1979
- 92Before 1970

First ancestries reported:
- English: 464 (8.9%)
- Norwegian: 426 (8.1%)
- German: 356 (6.8%)
- American: 283 (5.4%)
- Finnish: 216 (4.1%)
- Irish: 196 (3.7%)
- European: 187 (3.6%)
- Scottish: 129 (2.5%)
- Canadian: 103 (2.0%)
- Dutch: 81 (1.5%)
- Swedish: 74 (1.4%)
- Scandinavian: 67 (1.3%)
- Danish: 52 (1.0%)
- Italian: 30 (0.6%)
- Northern European: 30 (0.6%)
- French Canadian: 28 (0.5%)
- British: 27 (0.5%)
- Nigerian: 27 (0.5%)
- Scotch-Irish: 25 (0.5%)
- Iranian: 21 (0.4%)
- Swiss: 18 (0.3%)
- French: 12 (0.2%)
- Jamaican: 12 (0.2%)
- Greek: 11 (0.2%)
- Slovene: 9 (0.2%)
- Russian: 8 (0.2%)
- Croatian: 7 (0.1%)
- Czech: 6 (0.1%)
- Polish: 5 (0.10%)
Most common places of birth for foreign-born residents (%):
| Sedro-Woolley: | 61.0% (533) |
| Washington: | 21.1% (241,655) |
| Sedro-Woolley: | 10.3% (90) |
| Washington: | 1.2% (13,855) |
| Sedro-Woolley: | 10.3% (90) |
| Washington: | 4.1% (47,238) |
| Sedro-Woolley: | 5.5% (48) |
| Washington: | 7.4% (84,470) |
| Sedro-Woolley: | 3.7% (32) |
| Washington: | 6.3% (71,661) |
| Sedro-Woolley: | 2.2% (19) |
| Washington: | 0.4% (4,914) |
| Sedro-Woolley: | 1.8% (16) |
| Washington: | 0.3% (3,414) |
Place of birth for U.S.-born residents:
- This state: 7,749
- Other state: 3,662
- Northeast: 171
- Midwest: 716
- South: 539
- West: 2,217
85.0% of Sedro-Woolley residents lived in the same house 1 years ago.
Out of people who lived in different houses, 28.7% lived in this county.
Out of people who lived in different counties, 85.7% lived in Washington.
| Sedro-Woolley: | 85.0% |
| State average: | 85.2% |
Education attainment for males 25 years and older:
- No schooling: 137
- Nursery to 4th grade: 28
- 5th and 6th grade: 54
- 7th and 8th grade: 74
- 9th grade: 42
- 10th grade: 72
- 11th grade: 263
- 12th grade, no diploma: 167
- High school graduate (or equivalency): 1,541
- Less than 1 year of college: 198
- Some college more than 1 year, no degree: 512
- Associate degree: 599
- Bachelor's degree: 545
- Master's degree: 100
- Professional school degree: 3
- Doctorate degree: 12

Education attainment for females 25 years and older:
- No schooling: 72
- Nursery to 4th grade: 26
- 5th and 6th grade: 0
- 7th and 8th grade: 60
- 9th grade: 31
- 10th grade: 0
- 11th grade: 37
- 12th grade, no diploma: 98
- High school graduate (or equivalency): 1,385
- Less than 1 year of college: 288
- Some college more than 1 year, no degree: 662
- Associate degree: 609
- Bachelor's degree: 516
- Master's degree: 203
- Professional school degree: 25
- Doctorate degree: 4


Housing units in structures:
- One, detached: 3,379
- One, attached: 236
- Two: 211
- 3 or 4: 144
- 5 to 9: 120
- 10 to 19: 146
- 20 to 49: 133
- 50 or more: 209
- Mobile homes: 283
Median worth of mobile homes: $159,166
Housing units lacking complete kitchen facilities in 2022: 3.0%
House/condo owner moved in on average 6 years ago
Renter moved in on average 3 years ago

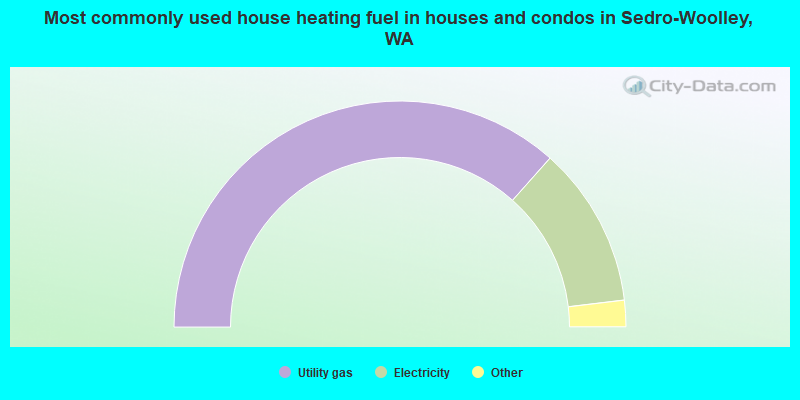
- 73.2%Utility gas
- 23.1%Electricity
- 1.6%Other fuel
- 0.7%Wood
- 0.5%Fuel oil, kerosene, etc.
- 0.4%No fuel used
- 0.4%Bottled, tank, or LP gas
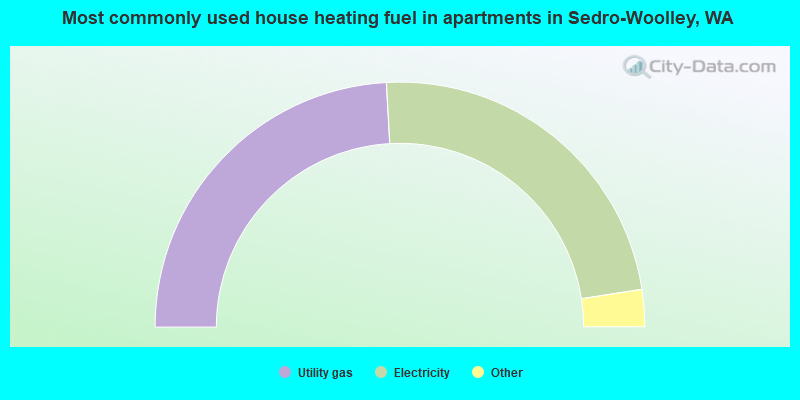
- 48.3%Utility gas
- 46.9%Electricity
- 3.2%Bottled, tank, or LP gas
- 0.9%No fuel used
- 0.7%Wood
Private vs. public school enrollment:
| Here: | 18.1% |
| Washington: | 12.4% |
| Here: | 3.3% |
| Washington: | 9.2% |
| Here: | 30.9% |
| Washington: | 16.5% |


