Races in Sedro-Woolley, Washington (WA) Detailed Stats
Data:
Races - White alone (%)
Races - White alone (% change since 2000)
Races - Black alone (%)
Races - Black alone (% change since 2000)
Races - American Indian alone (%)
Races - American Indian alone (% change since 2000)
Races - Asian alone (%)
Races - Asian alone (% change since 2000)
Races - Hispanic (%)
Races - Hispanic (% change since 2000)
Races - Native Hawaiian and Other Pacific Islander alone (%)
Races - Native Hawaiian and Other Pacific Islander alone (% change since 2000)
Races - Two or more races(%)
Races - Two or more races(% change since 2000)
Races - Other race alone (%)
Races - Other race alone (% change since 2000)
Racial diversity
Place of birth - Born in state of residence (%)
Place of birth - Born in state of residence (%) - White
Place of birth - Born in state of residence (%) - Black or African American
Place of birth - Born in state of residence (%) - Asian
Place of birth - Born in state of residence (%) - Hispanic or Latino
Place of birth - Born in state of residence (%) - American Indian and Alaska Native
Place of birth - Born in state of residence (%) - Multirace
Place of birth - Born in state of residence (%) - Other Race
Place of birth - Born in other state (%)
Place of birth - Born in other state (%) - White
Place of birth - Born in other state (%) - Black or African American
Place of birth - Born in other state (%) - Asian
Place of birth - Born in other state (%) - Hispanic or Latino
Place of birth - Born in other state (%) - American Indian and Alaska Native
Place of birth - Born in other state (%) - Multirace
Place of birth - Born in other state (%) - Other Race
Place of birth - Native, outside of US (%)
Place of birth - Native, outside of US (%) - White
Place of birth - Native, outside of US (%) - Black or African American
Place of birth - Native, outside of US (%) - Asian
Place of birth - Native, outside of US (%) - Hispanic or Latino
Place of birth - Native, outside of US (%) - American Indian and Alaska Native
Place of birth - Native, outside of US (%) - Multirace
Place of birth - Native, outside of US (%) - Other Race
Place of birth - Foreign born (%)
Place of birth - Foreign born (%) - White
Place of birth - Foreign born (%) - Black or African American
Place of birth - Foreign born (%) - Asian
Place of birth - Foreign born (%) - Hispanic or Latino
Place of birth - Foreign born (%) - American Indian and Alaska Native
Place of birth - Foreign born (%) - Multirace
Place of birth - Foreign born (%) - Other Race
Residents speaking English at home (%)
Residents speaking English at home - Born in the United States (%)
Residents speaking English at home - Native, born elsewhere (%)
Residents speaking English at home - Foreign born (%)
Residents speaking Spanish at home (%)
Residents speaking Spanish at home - Born in the United States (%)
Residents speaking Spanish at home - Native, born elsewhere (%)
Residents speaking Spanish at home - Foreign born (%)
Residents speaking other language at home (%)
Residents speaking other language at home - Born in the United States (%)
Residents speaking other language at home - Native, born elsewhere (%)
Residents speaking other language at home - Foreign born (%)
Marital status - Never married (%)
Marital status - Now married (%)
Marital status - Separated (%)
Marital status - Widowed (%)
Marital status - Divorced (%)
Ancestries Reported - Arab (%)
Ancestries Reported - Czech (%)
Ancestries Reported - Danish (%)
Ancestries Reported - Dutch (%)
Ancestries Reported - English (%)
Ancestries Reported - French (%)
Ancestries Reported - French Canadian (%)
Ancestries Reported - German (%)
Ancestries Reported - Greek (%)
Ancestries Reported - Hungarian (%)
Ancestries Reported - Irish (%)
Ancestries Reported - Italian (%)
Ancestries Reported - Lithuanian (%)
Ancestries Reported - Norwegian (%)
Ancestries Reported - Polish (%)
Ancestries Reported - Portuguese (%)
Ancestries Reported - Russian (%)
Ancestries Reported - Scotch-Irish (%)
Ancestries Reported - Scottish (%)
Ancestries Reported - Slovak (%)
Ancestries Reported - Subsaharan African (%)
Ancestries Reported - Swedish (%)
Ancestries Reported - Swiss (%)
Ancestries Reported - Ukrainian (%)
Ancestries Reported - United States (%)
Ancestries Reported - Welsh (%)
Ancestries Reported - West Indian (%)
Ancestries Reported - Other (%)
Geographical mobility - Same house 1 year ago (%)
Geographical mobility - Same house 1 year ago (%) - White
Geographical mobility - Same house 1 year ago (%) - Black or African American
Geographical mobility - Same house 1 year ago (%) - Asian
Geographical mobility - Same house 1 year ago (%) - Hispanic or Latino
Geographical mobility - Same house 1 year ago (%) - American Indian and Alaska Native
Geographical mobility - Same house 1 year ago (%) - Multirace
Geographical mobility - Same house 1 year ago (%) - Other Race
Geographical mobility - Moved within same county (%)
Geographical mobility - Moved within same county (%) - White
Geographical mobility - Moved within same county (%) - Black or African American
Geographical mobility - Moved within same county (%) - Asian
Geographical mobility - Moved within same county (%) - Hispanic or Latino
Geographical mobility - Moved within same county (%) - American Indian and Alaska Native
Geographical mobility - Moved within same county (%) - Multirace
Geographical mobility - Moved within same county (%) - Other Race
Geographical mobility - Moved from different county within same state (%)
Geographical mobility - Moved from different county within same state (%) - White
Geographical mobility - Moved from different county within same state (%) - Black or African American
Geographical mobility - Moved from different county within same state (%) - Asian
Geographical mobility - Moved from different county within same state (%) - Hispanic or Latino
Geographical mobility - Moved from different county within same state (%) - American Indian and Alaska Native
Geographical mobility - Moved from different county within same state (%) - Multirace
Geographical mobility - Moved from different county within same state (%) - Other Race
Geographical mobility - Moved from different state (%)
Geographical mobility - Moved from different state (%) - White
Geographical mobility - Moved from different state (%) - Black or African American
Geographical mobility - Moved from different state (%) - Asian
Geographical mobility - Moved from different state (%) - Hispanic or Latino
Geographical mobility - Moved from different state (%) - American Indian and Alaska Native
Geographical mobility - Moved from different state (%) - Multirace
Geographical mobility - Moved from different state (%) - Other Race
Geographical mobility - Moved from abroad (%)
Geographical mobility - Moved from abroad (%) - White
Geographical mobility - Moved from abroad (%) - Black or African American
Geographical mobility - Moved from abroad (%) - Asian
Geographical mobility - Moved from abroad (%) - Hispanic or Latino
Geographical mobility - Moved from abroad (%) - American Indian and Alaska Native
Geographical mobility - Moved from abroad (%) - Multirace
Geographical mobility - Moved from abroad (%) - Other Race
Place of birth for the foreign-born population - Ireland (%)
Place of birth for the foreign-born population - Denmark (%)
Place of birth for the foreign-born population - Norway (%)
Place of birth for the foreign-born population - Sweden (%)
Place of birth for the foreign-born population - United Kingdom (%)
Place of birth for the foreign-born population - England (%)
Place of birth for the foreign-born population - Scotland (%)
Place of birth for the foreign-born population - Other Northern Europe (%)
Place of birth for the foreign-born population - Austria (%)
Place of birth for the foreign-born population - Belgium (%)
Place of birth for the foreign-born population - France (%)
Place of birth for the foreign-born population - Germany (%)
Place of birth for the foreign-born population - Netherlands (%)
Place of birth for the foreign-born population - Switzerland (%)
Place of birth for the foreign-born population - Other Western Europe (%)
Place of birth for the foreign-born population - Greece (%)
Place of birth for the foreign-born population - Italy (%)
Place of birth for the foreign-born population - Portugal (%)
Place of birth for the foreign-born population - Spain (%)
Place of birth for the foreign-born population - Other Southern Europe (%)
Place of birth for the foreign-born population - Albania (%)
Place of birth for the foreign-born population - Belarus (%)
Place of birth for the foreign-born population - Bosnia and Herzegovina (%)
Place of birth for the foreign-born population - Bulgaria (%)
Place of birth for the foreign-born population - Croatia (%)
Place of birth for the foreign-born population - Czechoslovakia (%)
Place of birth for the foreign-born population - Hungary (%)
Place of birth for the foreign-born population - Latvia (%)
Place of birth for the foreign-born population - Lithuania (%)
Place of birth for the foreign-born population - North Macedonia (Macedonia) (%)
Place of birth for the foreign-born population - Moldova (%)
Place of birth for the foreign-born population - Poland (%)
Place of birth for the foreign-born population - Romania (%)
Place of birth for the foreign-born population - Russia (%)
Place of birth for the foreign-born population - Serbia (%)
Place of birth for the foreign-born population - Ukraine (%)
Place of birth for the foreign-born population - Other Eastern Europe (%)
Place of birth for the foreign-born population - China (%)
Place of birth for the foreign-born population - Hong Kong (%)
Place of birth for the foreign-born population - Taiwan (%)
Place of birth for the foreign-born population - Japan (%)
Place of birth for the foreign-born population - Korea (%)
Place of birth for the foreign-born population - Other Eastern Asia (%)
Place of birth for the foreign-born population - Afghanistan (%)
Place of birth for the foreign-born population - Bangladesh (%)
Place of birth for the foreign-born population - India (%)
Place of birth for the foreign-born population - Iran (%)
Place of birth for the foreign-born population - Kazakhstan (%)
Place of birth for the foreign-born population - Nepal (%)
Place of birth for the foreign-born population - Pakistan (%)
Place of birth for the foreign-born population - Sri Lanka (%)
Place of birth for the foreign-born population - Uzbekistan (%)
Place of birth for the foreign-born population - Other South Central Asia (%)
Place of birth for the foreign-born population - Burma (%)
Place of birth for the foreign-born population - Cambodia (%)
Place of birth for the foreign-born population - Indonesia (%)
Place of birth for the foreign-born population - Laos (%)
Place of birth for the foreign-born population - Malaysia (%)
Place of birth for the foreign-born population - Philippines (%)
Place of birth for the foreign-born population - Singapore (%)
Place of birth for the foreign-born population - Thailand (%)
Place of birth for the foreign-born population - Vietnam (%)
Place of birth for the foreign-born population - Other South Eastern Asia (%)
Place of birth for the foreign-born population - Armenia (%)
Place of birth for the foreign-born population - Iraq (%)
Place of birth for the foreign-born population - Israel (%)
Place of birth for the foreign-born population - Jordan (%)
Place of birth for the foreign-born population - Kuwait (%)
Place of birth for the foreign-born population - Lebanon (%)
Place of birth for the foreign-born population - Saudi Arabia (%)
Place of birth for the foreign-born population - Syria (%)
Place of birth for the foreign-born population - Turkey (%)
Place of birth for the foreign-born population - Yemen (%)
Place of birth for the foreign-born population - Other Western Asia (%)
Place of birth for the foreign-born population - Eritrea (%)
Place of birth for the foreign-born population - Ethiopia (%)
Place of birth for the foreign-born population - Kenya (%)
Place of birth for the foreign-born population - Somalia (%)
Place of birth for the foreign-born population - Uganda (%)
Place of birth for the foreign-born population - Zimbabwe (%)
Place of birth for the foreign-born population - Other Eastern Africa (%)
Place of birth for the foreign-born population - Cameroon (%)
Place of birth for the foreign-born population - Congo (%)
Place of birth for the foreign-born population - Democratic Republic of Congo (Zaire) (%)
Place of birth for the foreign-born population - Other Middle Africa (%)
Place of birth for the foreign-born population - Egypt (%)
Place of birth for the foreign-born population - Morocco (%)
Place of birth for the foreign-born population - Sudan (%)
Place of birth for the foreign-born population - Other Northern Africa (%)
Place of birth for the foreign-born population - South Africa (%)
Place of birth for the foreign-born population - Other Southern Africa (%)
Place of birth for the foreign-born population - Cabo Verde (%)
Place of birth for the foreign-born population - Ghana (%)
Place of birth for the foreign-born population - Liberia (%)
Place of birth for the foreign-born population - Nigeria (%)
Place of birth for the foreign-born population - Senegal (%)
Place of birth for the foreign-born population - Sierra Leone (%)
Place of birth for the foreign-born population - Other Western Africa (%)
Place of birth for the foreign-born population - Australia (%)
Place of birth for the foreign-born population - New Zealand (%)
Place of birth for the foreign-born population - Fiji (%)
Place of birth for the foreign-born population - Micronesia (%)
Place of birth for the foreign-born population - Bahamas (%)
Place of birth for the foreign-born population - Barbados (%)
Place of birth for the foreign-born population - Cuba (%)
Place of birth for the foreign-born population - Dominica (%)
Place of birth for the foreign-born population - Dominican Republic (%)
Place of birth for the foreign-born population - Grenada (%)
Place of birth for the foreign-born population - Haiti (%)
Place of birth for the foreign-born population - Jamaica (%)
Place of birth for the foreign-born population - St. Vincent and the Grenadines (%)
Place of birth for the foreign-born population - Trinidad and Tobago (%)
Place of birth for the foreign-born population - West Indies (%)
Place of birth for the foreign-born population - Other Caribbean (%)
Place of birth for the foreign-born population - Belize (%)
Place of birth for the foreign-born population - Costa Rica (%)
Place of birth for the foreign-born population - El Salvador (%)
Place of birth for the foreign-born population - Guatemala (%)
Place of birth for the foreign-born population - Honduras (%)
Place of birth for the foreign-born population - Mexico (%)
Place of birth for the foreign-born population - Nicaragua (%)
Place of birth for the foreign-born population - Panama (%)
Place of birth for the foreign-born population - Other Central America (%)
Place of birth for the foreign-born population - Argentina (%)
Place of birth for the foreign-born population - Bolivia (%)
Place of birth for the foreign-born population - Brazil (%)
Place of birth for the foreign-born population - Chile (%)
Place of birth for the foreign-born population - Colombia (%)
Place of birth for the foreign-born population - Ecuador (%)
Place of birth for the foreign-born population - Guyana (%)
Place of birth for the foreign-born population - Peru (%)
Place of birth for the foreign-born population - Uruguay (%)
Place of birth for the foreign-born population - Venezuela (%)
Place of birth for the foreign-born population - Other South America (%)
Place of birth for the foreign-born population - Canada (%)
Place of birth for the foreign-born population - Other Northern America (%)
Place of birth for the foreign-born population - Other (%)
Latest news about races in Sedro-Woolley, WA collected exclusively by city-data.com from local newspapers, TV, and radio stations
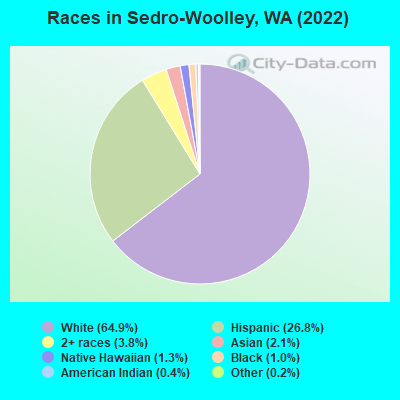
According to 2022 data, the most numerous races in Sedro-Woolley, WA are White alone (8,198 residents), Hispanic (3,384 residents), and Asian alone (263 residents). 79.9% of Sedro-Woolley residents speak English at home. 6.9% of Sedro-Woolley, WA residents are foreign-born (5.1% born in Latin America, 0.8% born in North America), which is 116.8% less than the foreign-born rate of 15.0% across the entire state of Washington.
Race distribution in Sedro-Woolley
2000 2022
4,652,490 78.9% White alone 441,509 7.5% Hispanic 319,401 5.4% Asian alone 184,631 3.1% Black alone 175,926 3.0% Two or more races 85,396 1.4% American Indian alone 22,779 0.4% Native Hawaiian and Other 11,989 0.2% Other race alone
4,941,456 63.5% White alone 1,093,313 14.0% Hispanic 755,832 9.7% Asian alone 523,448 6.7% Two or more races 299,537 3.8% Black alone 69,024 0.9% American Indian alone 52,231 0.7% Native Hawaiian and Other 50,945 0.7% Other race alone
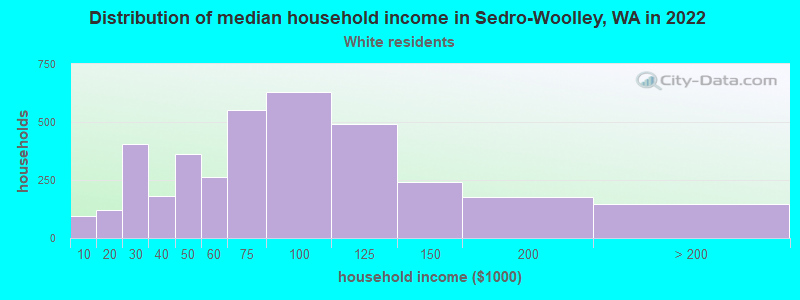
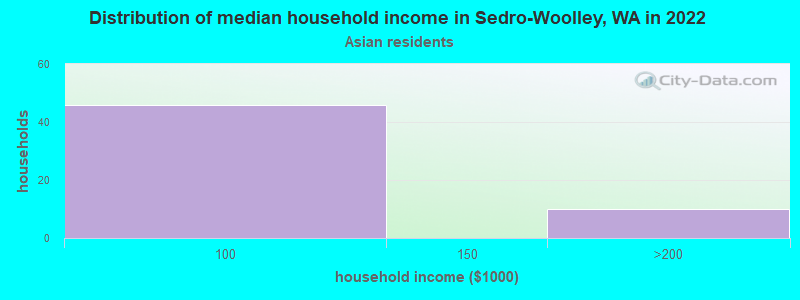
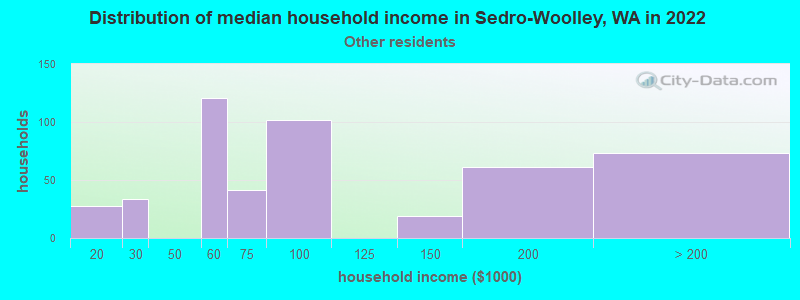
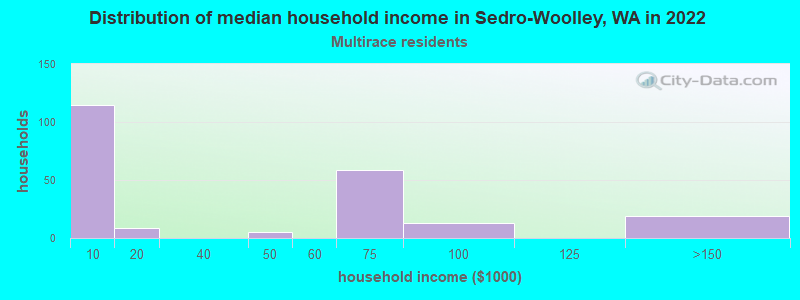
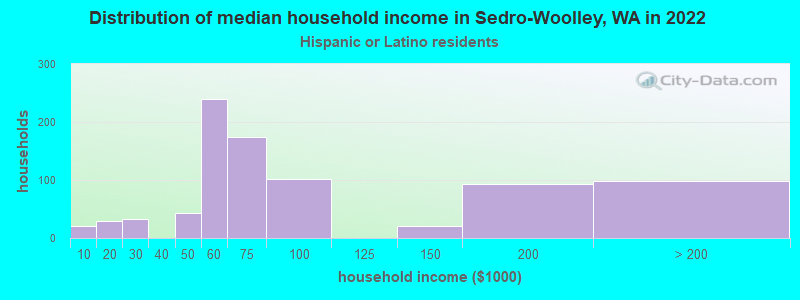
Income and house value in Sedro-Woolley Median household income in 2022 $73,919 White non-Hispanic householders$58,525 Asian householders$68,835 Some other race householders$60,991 Hispanic or Latino race householdersMedian 2022 house value $443,523 White Non-Hispanic householders$342,280 Some other race householdersover $1,000,000 Two or more races householders$470,906 Hispanic or Latino householders
Median age by race in Sedro-Woolley
36.4 Median age for White residents36.3 36.0 36.6 Median age for Black or African American residents36.0 -688,705,233.5 15.6 Median age for American Indian / Alaska Native residents-660,109,289.0 -622,531,939.0 36.4 Median age for Asian residents8.4 42.9 34.0 Median age for Native Hawaiian / Pacific Islander residents-696,774,192.9 13.7 29.8 Median age for Other race residents29.3 35.6 29.9 Median age for Two or more races residents21.4 38.5 38.0 Median age for White alone residents37.5 38.6 26.8 Median age for Hispanic or Latino residents24.7 27.7
Owner/renter occupied households by race in Sedro-Woolley
House owners and renters - White residents 2,371 64.4% Owner occupied1,311 35.6% Renter occupiedHouse owners and renters - Black or African American residents 62 100.0% Renter occupiedHouse owners and renters - Asian residents 34 100.0% Owner occupiedHouse owners and renters - Native Hawaiian / Pacific Islander residents 41 100.0% Renter occupiedHouse owners and renters - Other race residents 265 53.7% Owner occupied229 46.3% Renter occupiedHouse owners and renters - Two or more races residents 105 53.0% Owner occupied93 47.0% Renter occupiedHouse owners and renters - White alone residents 2,226 64.9% Owner occupied1,202 35.1% Renter occupiedHouse owners and renters - Hispanic or Latino residents 433 54.3% Owner occupied365 45.7% Renter occupied
Language usage in Sedro-Woolley
English speakers - Total 79.9% of residents of Sedro-Woolley speak English at home.
18.4% of residents speak Spanish at home 1,465 68.5% Speak English very well675 31.5% Speak English less than very well1.8% of residents speak other language at home 89 42.6% Speak English very well120 57.4% Speak English less than very well
English speakers - Born in the United States 92.3% of residents of Sedro-Woolley speak English at home.
5.7% of residents speak Spanish at home 169 81.2% Speak English very well39 18.8% Speak English less than very well1.1% of residents speak other language at home 42 100.0% Speak English very well
English speakers - Native, born elsewhere 29.4% of residents of Sedro-Woolley speak English at home.
66.1% of residents speak Spanish at home 158 67.5% Speak English very well76 32.5% Speak English less than very well21.5% of residents speak other language at home 76 100.0% Speak English less than very well
English speakers - Foreign-born 17.0% of residents of Sedro-Woolley speak English at home.
73.4% of residents speak Spanish at home 147 23.2% Speak English very well487 76.8% Speak English less than very well10.2% of residents speak other language at home 29 33.0% Speak English very well59 67.0% Speak English less than very well
White (Caucasian) - Speak only English Native:
92.5% (7,918)Foreign-born:
68.5% (103)
White (Caucasian) - Speak another language Native:
6.7% (572)Foreign-born:
77.9% (117)
Black or African American - Speak only English Native:
34.3% (74)Foreign-born:
99.4% (9)
Black or African American - Speak another language Native:
55.3% (120)Foreign-born:
10.8% (1)
Asian - Speak only English Native:
84.3% (81)Foreign-born:
10.3% (10)
Asian - Speak another language Native:
7.0% (7)Foreign-born:
94.4% (95)
Other race - Speak only English Native:
40.3% (432)Foreign-born:
4.3% (26)
Other race - Speak another language Native:
61.1% (655)Foreign-born:
95.8% (583)
White alone - Speak only English Native:
99.0% (7,532)Foreign-born:
96.8% (108)
White alone - Speak another language Native:
0.6% (44)Foreign-born:
13.2% (15)
Hispanic or Latino - Speak only English Native:
39.0% (922)Foreign-born:
2.0% (12)
Hispanic or Latino - Speak another language Native:
60.4% (1,426)Foreign-born:
99.0% (617)
Foreign-born residents in Sedro-Woolley 874 residents are foreign born (5.1% Latin America , 0.8% North America ).
This city:
6.9%Washington:
14.9%
Marital status for residents in Sedro-Woolley Marital status - White (Caucasian) population 15 years and over
Males 38.3% Never married48.8% Now married1.1% Separated1.1% Widowed10.7% DivorcedFemales 33.9% Never married45.3% Now married1.6% Separated5.7% Widowed13.4% DivorcedWomen who gave birth in the past 12 months Now married:
28.3% (60)Unmarried:
71.7% (153)
Women who did not give birth in the past 12 months Now married:
40.9% (899)Unmarried:
59.1% (1,299)
Marital status - Black or African American population 15 years and over
Males 4.4% Never married71.8% Now married0.0% Separated15.5% Widowed8.3% DivorcedFemales 100.0% Never married0.0% Now married0.0% Separated0.0% Widowed0.0% DivorcedWomen who did not give birth in the past 12 months Now married:
0.0% (0)Unmarried:
100.0% (14)
Marital status - Asian population 15 years and over
Males 0.0% Never married100.0% Now married0.0% Separated0.0% Widowed0.0% DivorcedFemales 0.0% Never married68.8% Now married0.0% Separated31.2% Widowed0.0% DivorcedWomen who gave birth in the past 12 months Now married:
100.0% (8)Unmarried:
0.0% (0)
Women who did not give birth in the past 12 months Now married:
100.0% (35)Unmarried:
0.0% (0)
Marital status - Native Hawaiian / Pacific Islander population 15 years and over
Males 2.7% Never married97.3% Now married0.0% Separated0.0% Widowed0.0% DivorcedFemales 0.0% Never married100.0% Now married0.0% Separated0.0% Widowed0.0% DivorcedWomen who did not give birth in the past 12 months Now married:
100.0% (18)Unmarried:
0.0% (0)
Marital status - Other race population 15 years and over
Males 55.8% Never married28.6% Now married10.7% Separated0.0% Widowed4.9% DivorcedFemales 37.2% Never married60.0% Now married0.0% Separated2.7% Widowed0.0% DivorcedWomen who gave birth in the past 12 months Now married:
100.0% (74)Unmarried:
0.0% (0)
Women who did not give birth in the past 12 months Now married:
32.4% (90)Unmarried:
67.6% (188)
Marital status - Two or more races population 15 years and over
Males 38.5% Never married40.1% Now married0.0% Separated0.0% Widowed21.4% DivorcedFemales 13.6% Never married74.9% Now married0.0% Separated8.9% Widowed2.6% DivorcedWomen who gave birth in the past 12 months Now married:
100.0% (39)Unmarried:
0.0% (0)
Women who did not give birth in the past 12 months Now married:
77.9% (75)Unmarried:
22.1% (21)
Marital status - White alone, not Hispanic / Latino population 15 years and over
Males 35.1% Never married52.5% Now married1.2% Separated1.3% Widowed9.9% DivorcedFemales 26.9% Never married50.2% Now married1.4% Separated6.5% Widowed15.1% DivorcedWomen who gave birth in the past 12 months Now married:
92.6% (62)Unmarried:
7.4% (5)
Women who did not give birth in the past 12 months Now married:
45.2% (914)Unmarried:
54.8% (1,108)
Marital status - Hispanic or Latino population 15 years and over
Males 52.3% Never married31.5% Now married5.3% Separated0.0% Widowed11.0% DivorcedFemales 61.1% Never married33.4% Now married1.7% Separated3.2% Widowed0.5% DivorcedWomen who gave birth in the past 12 months Now married:
29.2% (64)Unmarried:
70.8% (154)
Women who did not give birth in the past 12 months Now married:
21.6% (111)Unmarried:
78.4% (404)
Ancestries in Sedro-Woolley
464 8.9% English426 8.1% Norwegian356 6.8% German283 5.4% American216 4.1% Finnish196 3.7% Irish187 3.6% European129 2.5% Scottish103 2.0% Canadian81 1.5% Dutch74 1.4% Swedish67 1.3% Scandinavian52 1.0% Danish30 0.6% Italian30 0.6% Northern European28 0.5% French Canadian27 0.5% British27 0.5% Nigerian25 0.5% Scotch-Irish21 0.4% Iranian18 0.3% Swiss12 0.2% French12 0.2% Jamaican11 0.2% Greek9 0.2% Slovene8 0.2% Russian7 0.1% Croatian6 0.1% Czech5 0.10% Polish
Children Nativity (place of birth) in Sedro-Woolley
Children under 6 years - Living with two parents Both parents native 481 100.0% NativeOne native, one foreign-born parent 116 100.0% NativeChildren under 6 years - Living with one parent Native parent 396 100.0% NativeChildren 6 to 17 years - Living with two parents Both parents native 639 100.0% NativeBoth parents foreign-born 67 100.0% NativeOne native, one foreign-born parent 24 43.4% Native31 56.6% Foreign-bornChildren 6 to 17 years - Living with one parent Native parent 817 100.0% NativeForeign-born parent 53 48.7% Native56 51.3% Foreign-born
Grandparents responsible for own grandchildren in Sedro-Woolley
Grandparents (30 to 59 years) White / Caucasian 66 75.4% Responsible for grandchildren22 24.6% Not responsible for grandchildrenOther race 72 100.0% Not responsible for grandchildrenWhite alone, not Hispanic / Latino 26 100.0% Not responsible for grandchildrenHispanic or Latino 85 60.1% Responsible for grandchildren57 39.9% Not responsible for grandchildrenGrandparents (60 years and over) White / Caucasian 54 90.6% Responsible for grandchildren6 9.4% Not responsible for grandchildrenWhite alone, not Hispanic / Latino 54 90.2% Responsible for grandchildren6 9.8% Not responsible for grandchildren