SeaTac, WA (Washington) Houses and Residents
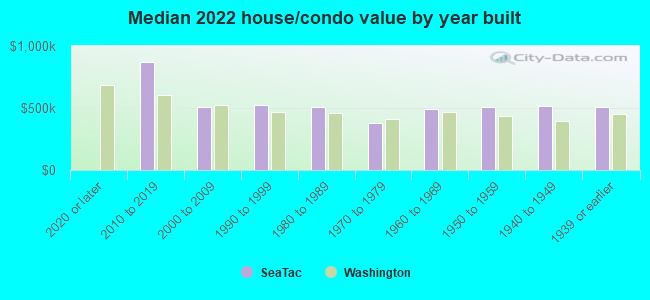
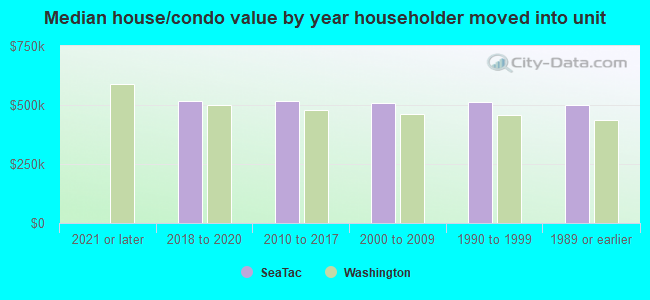
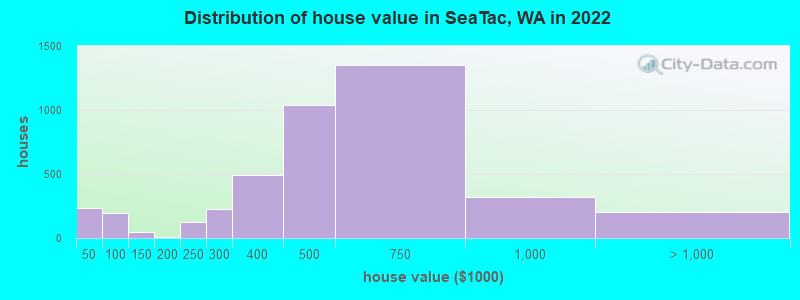
| SeaTac: | $507,470 |
| Washington: | $569,500 |
Total population: 28,126 (Urban population: 25,431, Rural population: 92 (all nonfarm))
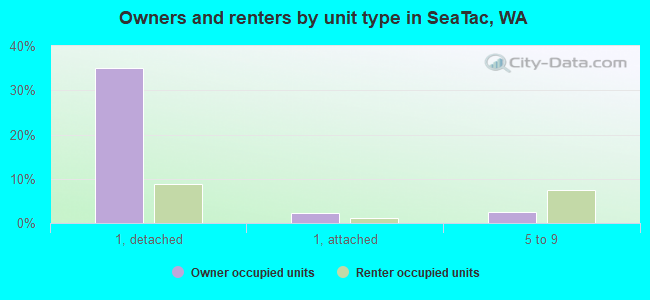
Houses: 12,333 (11,788 occupied: 5,515 owner occupied, 6,256 renter occupied)
| % of renters here: | 53% |
| State: | 36% |
Housing density: 1,238 houses/condos per square mile
Median price asked for vacant for-sale houses and condos in 2022: $2,696,941.
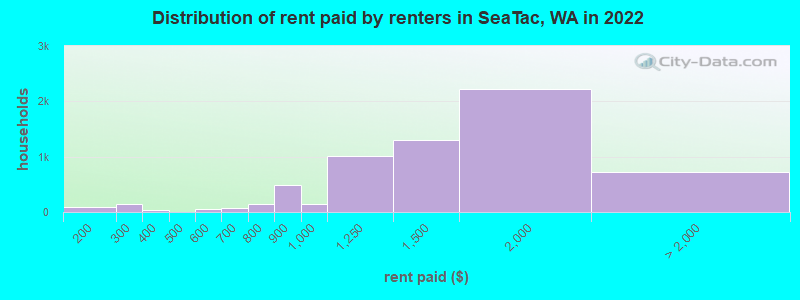
Median contract rent in 2022: $1,448 (lower quartile is $1,095, upper quartile is $1,824)
Median rent asked for vacant for-rent units in 2022: $1,938
Median gross rent in SeaTac, WA in 2022: $1,598
Housing units in SeaTac with a mortgage: 3,697 (280 second mortgage, 123 home equity loan, 162 both second mortgage and home equity loan)
Houses without a mortgage: 73
Median household income for houses/condos with a mortgage: $121,208
Median household income for apartments without a mortgage: $92,836
Median monthly housing costs: $1,615
Compare current foreclosures near SeaTac, WA:
| Photo | Address | Area | Beds / Baths | Price | Details |
|---|---|---|---|---|---|

|
#1
N 31st St Apt 401
Tacoma, WA 98403
|
2,110 sq. feet
|
2 baths 2 beds |
show details | |

|
#2
42nd Ave S Apt 101
Kent, WA 98032
|
995 sq. feet
|
2 baths 2 beds |
show details | |

|
#3
57th Ave S Unit B104
Seattle, WA 98178
|
572 sq. feet
|
1 baths 1 beds |
show details | |

|
#4
1st Ave S # 806
Seattle, WA 98104
|
806 sq. feet
|
1 baths 1 beds |
show details | |

|
#5
S 18th St
Renton, WA 98055
|
2,680 sq. feet
|
1 baths 4 beds |
show details | |

|
#6
9th Ave S
Federal Way, WA 98003
|
1,000 sq. feet
|
1 baths 3 beds |
show details | |

|
#7
S 124th St
Seattle, WA 98178
|
1,100 sq. feet
|
1 baths 2 beds |
show details | |

|
#8
16th Ave S
Seattle, WA 98168
|
1,800 sq. feet
|
1 baths 4 beds |
show details | |

|
#9
8th Ave W
Seattle, WA 98119
|
1,400 sq. feet
|
1 baths 3 beds |
show details | |

|
#10
119th Ave SE
Kent, WA 98030
|
2,760 sq. feet
|
2 baths 4 beds |
show details |
| Photo | Address | Area | Beds / Baths | Price | Details |
|---|---|---|---|---|---|

|
#11
115th Ct SE
Renton, WA 98056
|
2,970 sq. feet
|
2 baths 4 beds |
show details | |

|
#12
16th Ave SW
Seattle, WA 98106
|
970 sq. feet
|
1 baths 3 beds |
show details | |

|
#13
SE 278th Pl
Kent, WA 98030
|
2,478 sq. feet
|
2 baths 4 beds |
show details | |

|
#14
S Park Ave
Tacoma, WA 98418
|
- sq. feet
|
2 baths 4 beds |
show details | |

|
#15
S 7th St
Tacoma, WA 98405
|
1,092 sq. feet
|
1 baths 2 beds |
show details | |

|
#16
19th Street Ct E
Puyallup, WA 98372
|
960 sq. feet
|
1 baths 3 beds |
show details | |

|
#17
S 239th St
Kent, WA 98032
|
2,210 sq. feet
|
1 baths 4 beds |
show details | |

|
#18
S 365th Pl
Federal Way, WA 98003
|
1,010 sq. feet
|
2 baths 3 beds |
show details | |

|
#19
SE 24th Way
Sammamish, WA 98075
|
770 sq. feet
|
1 baths 2 beds |
show details | |

|
#20
E Division Ln
Tacoma, WA 98404
|
1,604 sq. feet
|
2 baths 3 beds |
show details |
| Photo | Address | Area | Beds / Baths | Price | Details |
|---|---|---|---|---|---|

|
#21
Browns Point Blvd
Tacoma, WA 98422
|
2,847 sq. feet
|
3 baths 4 beds |
show details | |

|
#22
NE 13th Pl
Renton, WA 98059
|
3,190 sq. feet
|
2 baths 3 beds |
show details | |

|
#23
126th Pl SE
Renton, WA 98056
|
2,450 sq. feet
|
2 baths 4 beds |
show details | |

|
#24
SW 100th St
Seattle, WA 98146
|
2,130 sq. feet
|
1 baths 5 beds |
show details | |

|
#25
63rd Ave NE
Tacoma, WA 98422
|
1,904 sq. feet
|
2 baths 2 beds |
show details | |

|
#26
3rd Ave S
Seattle, WA 98168
|
870 sq. feet
|
1 baths 2 beds |
show details | |

|
#27
SW 148th St
Seattle, WA 98166
|
1,030 sq. feet
|
1 baths 3 beds |
show details | |

|
#28
NE 5th St
Renton, WA 98056
|
1,930 sq. feet
|
2 baths 3 beds |
show details | |

|
#29
S 36th Pl
Renton, WA 98055
|
- sq. feet
|
2 baths 4 beds |
show details | |

|
#30
28th St E
Bonney Lake, WA 98391
|
3,330 sq. feet
|
3 baths 3 beds |
show details |
| Photo | Address | Area | Beds / Baths | Price | Details |
|---|---|---|---|---|---|

|
#31
25th Ave S
Seattle, WA 98198
|
1,140 sq. feet
|
1 baths 4 beds |
show details | |

|
#32
17th St SE
Auburn, WA 98002
|
1,987 sq. feet
|
2 baths 4 beds |
show details | |

|
#33
SE 47th Pl
Issaquah, WA 98029
|
2,610 sq. feet
|
2 baths 3 beds |
show details | |

|
#34
41st Ave SW
Seattle, WA 98116
|
1,420 sq. feet
|
1 baths 2 beds |
show details | |

|
#35
SW 119th St
Seattle, WA 98146
|
2,540 sq. feet
|
2 baths 4 beds |
show details | |

|
#36
269th Ave SE
Maple Valley, WA 98038
|
2,660 sq. feet
|
2 baths 3 beds |
show details | |

|
#37
S 359th St
Federal Way, WA 98003
|
1,096 sq. feet
|
1 baths 2 beds |
show details | |

|
#38
51st Ave NE
Seattle, WA 98115
|
2,450 sq. feet
|
2 baths 4 beds |
show details | |

|
#39
SE 217th Pl
Kent, WA 98031
|
1,260 sq. feet
|
1 baths 3 beds |
show details | |

|
#40
19th Ave SW
Federal Way, WA 98023
|
1,600 sq. feet
|
2 baths 3 beds |
show details |
| Photo | Address | Area | Beds / Baths | Price | Details |
|---|---|---|---|---|---|

|
#41
37th St NE
Tacoma, WA 98422
|
1,368 sq. feet
|
1 baths 3 beds |
show details | |

|
#42
SW 109th St
Seattle, WA 98146
|
2,410 sq. feet
|
1 baths 4 beds |
show details | |

|
#43
SW Wycoff Rd
Port Orchard, WA 98367
|
2,256 sq. feet
|
2 baths 3 beds |
show details | |

|
#44
19th Ave S
Seattle, WA 98168
|
2,420 sq. feet
|
2 baths 2 beds |
show details | |

|
#45
SE 14th St
Sammamish, WA 98075
|
3,520 sq. feet
|
3 baths 6 beds |
show details | |

|
#46
2nd Ave N
Auburn, WA 98001
|
1,690 sq. feet
|
1 baths 3 beds |
show details | |

|
#47
S 249th St
Kent, WA 98032
|
1,120 sq. feet
|
1 baths 3 beds |
show details | |

|
#48
S Donovan St
Seattle, WA 98108
|
1,450 sq. feet
|
2 baths 4 beds |
show details | |

|
#49
Puget Blvd SW
Seattle, WA 98106
|
1,820 sq. feet
|
1 baths 3 beds |
show details | |

|
Check over 1 million property listings on Foreclosure.com!
|
browse all offers | |||

Latest news about housing in SeaTac, WA collected exclusively by city-data.com from local newspapers, TV, and radio stations


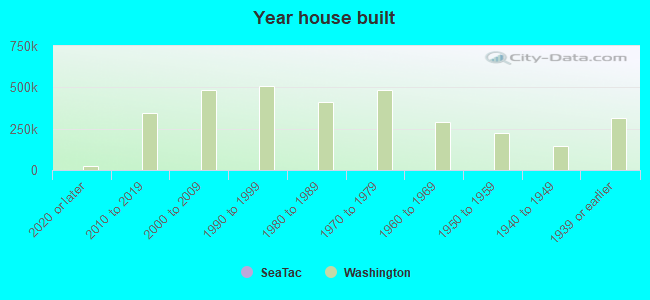
Median year apartment built: 1976
Household type by relationship:
Households: 31,097- Male householders: 6,329 (1,911 living alone), Female householders: 5,147 (1,756 living alone)
4,407 spouses (4,344 opposite-sex spouses), 709 unmarried partners, (637 opposite-sex unmarried partners), 8,746 children (8,318 natural, 175 adopted, 252 stepchildren), 366 grandchildren, 591 brothers or sisters, 995 parents, 0 foster children, 1,216 other relatives, 1,694 non-relatives
- In group quarters: 892
Size of family households: 2,503 2-persons, 1,239 3-persons, 1,910 4-persons, 724 5-persons, 218 6-persons, 240 7-or-more-persons.
Size of nonfamily households: 3,944 1-person, 674 2-persons, 196 3-persons, 12 4-persons, 44 6-persons.
4,028 married couples with children.
2,107 single-parent households (848 men, 1,259 women).
48.9% of residents of SeaTac speak English at home.
17.0% of residents speak Spanish at home (52% speak English very well, 28% speak English well, 17% speak English not well, 3% don't speak English at all).
6.4% of residents speak other Indo-European language at home (68% speak English very well, 16% speak English well, 16% speak English not well).
12.9% of residents speak Asian or Pacific Island language at home (47% speak English very well, 28% speak English well, 18% speak English not well, 7% don't speak English at all).
15.8% of residents speak other language at home (51% speak English very well, 35% speak English well, 10% speak English not well, 3% don't speak English at all).
Foreign born population: 12,591 (40.5%)
(55.2% of them are naturalized citizens)
| Here: | 5.7 |
| State: | 6.5 |
| Here: | 3.6 |
| State: | 3.9 |
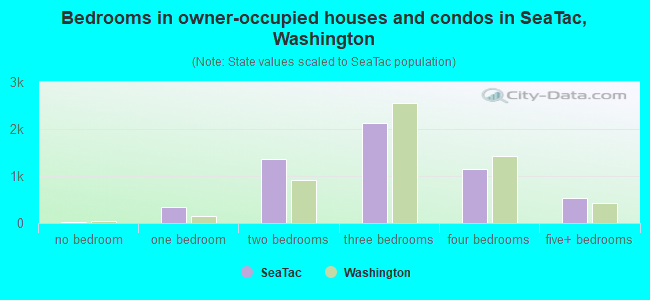
- Bedrooms in owner-occupied houses and condos in SeaTac, Washington
- 20no bedroom
- 3411 bedroom
- 1,3542 bedrooms
- 2,1213 bedrooms
- 1,1524 bedrooms
- 5285+ bedrooms
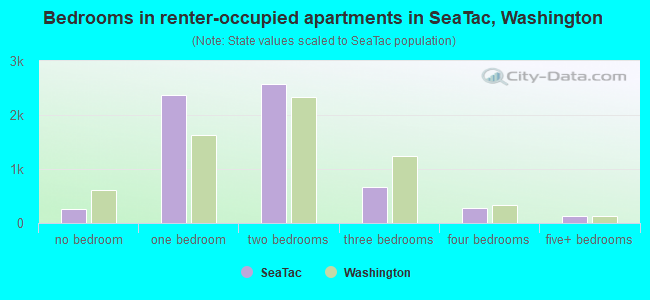
- Bedrooms in renter-occupied apartments in SeaTac, Washington
- 258no bedroom
- 2,3651 bedroom
- 2,5652 bedrooms
- 6663 bedrooms
- 2764 bedrooms
- 1265+ bedrooms
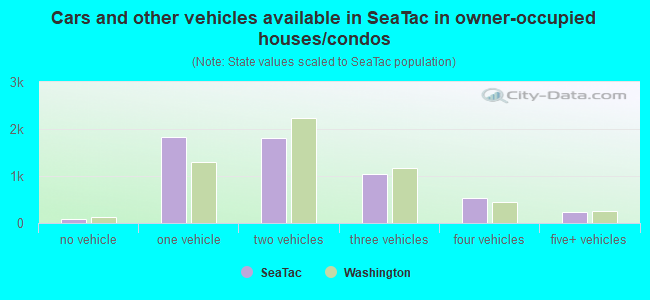
- Cars and other vehicles available in SeaTac in owner-occupied houses/condos
- 93no vehicle
- 1,8271 vehicle
- 1,8062 vehicles
- 1,0393 vehicles
- 5284 vehicles
- 2245+ vehicles
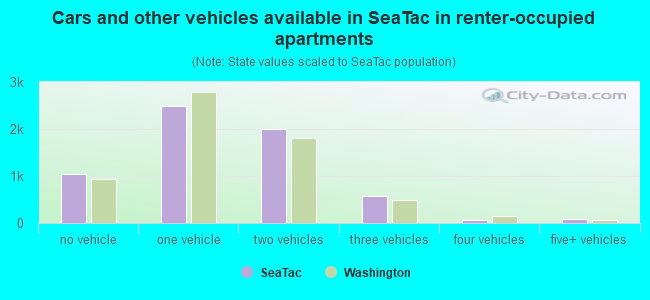
- Cars and other vehicles available in SeaTac in renter-occupied apartments
- 1,034no vehicle
- 2,4961 vehicle
- 2,0062 vehicles
- 5643 vehicles
- 724 vehicles
- 845+ vehicles
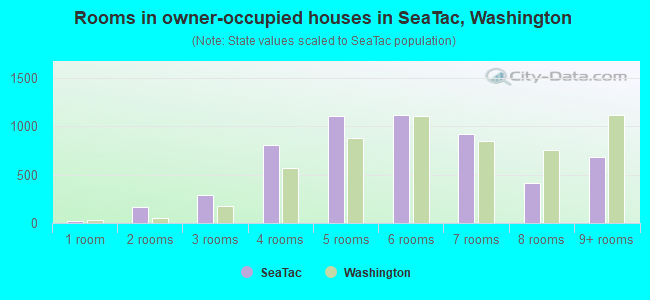
- Rooms in owner-occupied houses in SeaTac, Washington
- 201 room
- 1702 rooms
- 2913 rooms
- 8044 rooms
- 1,1055 rooms
- 1,1176 rooms
- 9227 rooms
- 4098 rooms
- 6789+ rooms
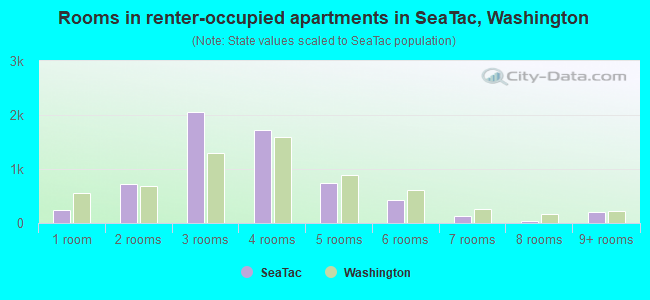
- Rooms in renter-occupied apartments in SeaTac, Washington
- 2421 room
- 7222 rooms
- 2,0543 rooms
- 1,7164 rooms
- 7335 rooms
- 4216 rooms
- 1257 rooms
- 408 rooms
- 2039+ rooms
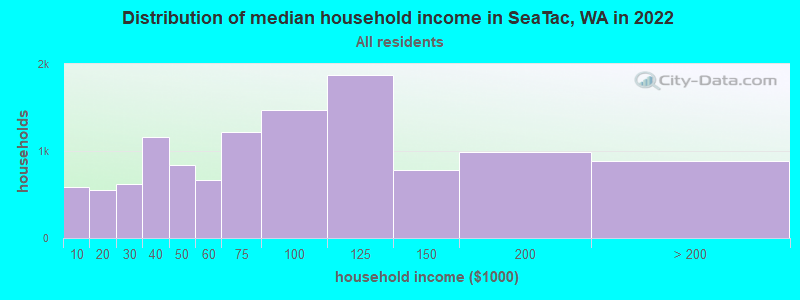
SeaTac, WA household income distribution

- 586Less than $10,000
- 553$10,000 to $19,999
- 615$20,000 to $29,999
- 1,160$30,000 to $39,999
- 834$40,000 to $49,999
- 663$50,000 to $59,999
- 1,223$60,000 to $74,999
- 1,477$75,000 to $99,999
- 1,871$100,000 to $124,999
- 779$125,000 to $149,999
- 985$150,000 to $199,999
- 890$200,000 or more
Home value of owner - occupied houses in 2022 in SeaTac, WA
-
- 62Less than $10,000
- 10$10,000 to $14,999
- 93$20,000 to $24,999
- 16$25,000 to $29,999
- 17$30,000 to $34,999
- 30$35,000 to $39,999
- 64$50,000 to $59,999
- 35$70,000 to $79,999
- 24$80,000 to $89,999
- 73$90,000 to $99,999
- 34$100,000 to $124,999
- 13$125,000 to $149,999
- 7$150,000 to $174,999
- 124$200,000 to $249,999
- 226$250,000 to $299,999
- 490$300,000 to $399,999
- 1,037$400,000 to $499,999
- 1,348$500,000 to $749,999
- 320$750,000 to $999,999
- 161$1,000,000 to $1,499,999
- 41$2,000,000 or more
Rent paid by renters in 2022 in SeaTac, WA
-
- 18Less than $100
- 79$100 to $149
- 10$150 to $199
- 135$200 to $249
- 10$250 to $299
- 23$300 to $349
- 8$350 to $399
- 6$400 to $449
- 47$550 to $599
- 33$600 to $649
- 37$650 to $699
- 78$700 to $749
- 67$750 to $799
- 485$800 to $899
- 143$900 to $999
- 1,019$1,000 to $1,249
- 1,297$1,250 to $1,499
- 2,226$1,500 to $1,999
- 463$2,000 to $2,499
- 145$2,500 to $2,999
- 52$3,000 to $3,499
- 58No cash rent
Percentage of workers working in this county: 96.1%
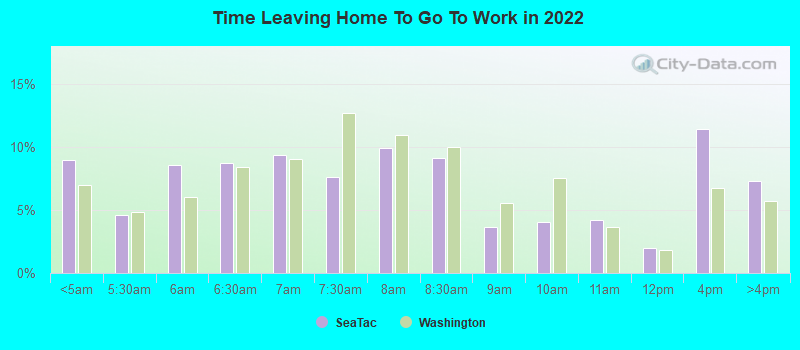
Number of people working at home: 1,904 (12.2% of all workers)
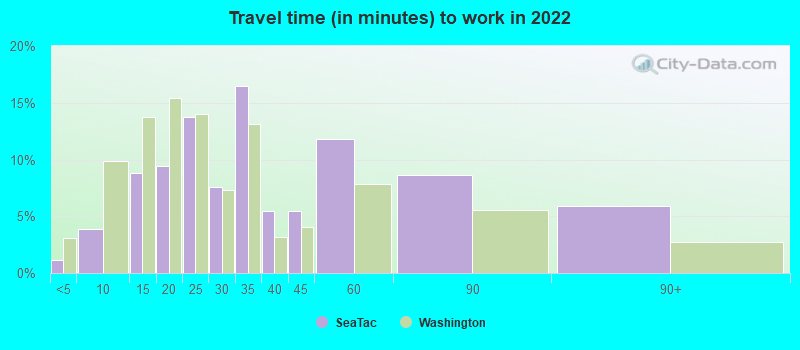
Travel time to work (commute)
- Less than 5 minutes: 294
- 5 to 9 minutes: 699
- 10 to 14 minutes: 1,980
- 15 to 19 minutes: 2,638
- 20 to 24 minutes: 1,692
- 25 to 29 minutes: 991
- 30 to 34 minutes: 1,802
- 35 to 39 minutes: 263
- 40 to 44 minutes: 737
- 45 to 59 minutes: 979
- 60 to 89 minutes: 740
- 90 or more minutes: 134
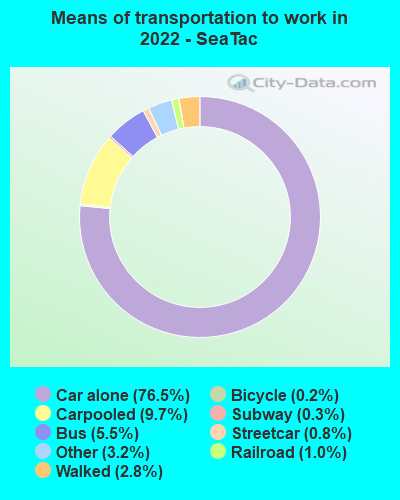
Means of transportation to work:
- Drove a car alone: 23,505 (70.4%)
- Carpooled: 2,860 (8.6%)
- Bus: 1,046 (3.1%)
- Subway or elevated rail: 274 (0.8%)
- Long-distance train or commuter rail: 42 (0.1%)
- Light rail, streetcar or trolley: 409 (1.2%)
- Ferryboat: 6 (0.0%)
- Taxi: 890 (2.7%)
- Bicycle: 50 (0.1%)
- Walked: 754 (2.3%)
- Worked at home: 1,904 (5.7%)
- Unemployment by race in 2022
- Unemployment rate for White non-Hispanic residents
- 7.0%Males
- 4.3%Females
- Unemployment rate for Black residents
- 10.2%Males
- 4.8%Females
- Unemployment rate for American Indian and Alaska Native residents
- 19.2%Males
- Unemployment rate for Asian residents
- 4.4%Males
- 1.9%Females
- Unemployment rate for other race residents
- 2.6%Males
- Unemployment rate for two or more race residents
- 8.6%Males
- 5.9%Females
- Unemployment rate for Hispanic or Latino residents
- 2.5%Males
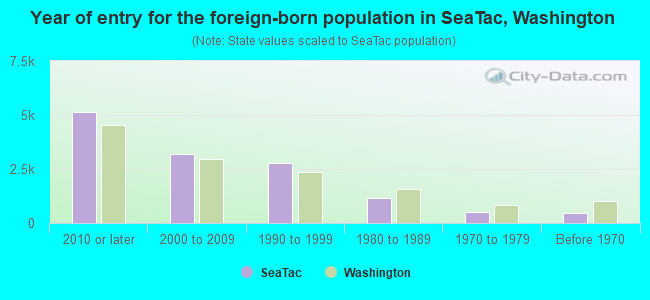
- Year of entry for the foreign-born population in SeaTac, Washington
- 5,1362010 or later
- 3,1802000 to 2009
- 2,7921990 to 1999
- 1,1591980 to 1989
- 5041970 to 1979
- 464Before 1970
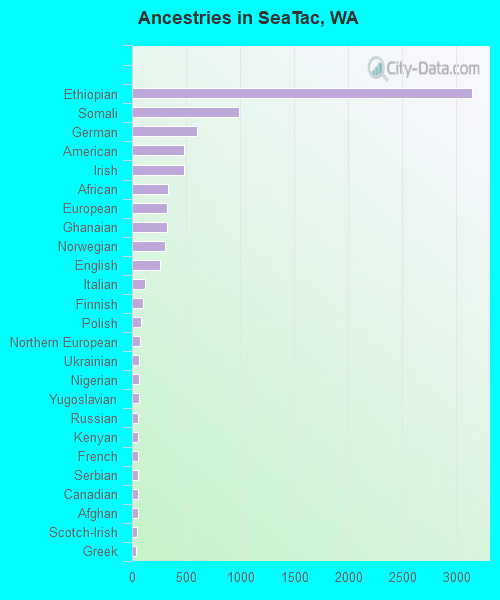
First ancestries reported:
- Ethiopian: 3,146 (17.6%)
- Somali: 991 (5.6%)
- German: 606 (3.4%)
- American: 483 (2.7%)
- Irish: 477 (2.7%)
- African: 333 (1.9%)
- European: 328 (1.8%)
- Ghanaian: 320 (1.8%)
- Norwegian: 302 (1.7%)
- English: 258 (1.4%)
- Italian: 124 (0.7%)
- Finnish: 103 (0.6%)
- Polish: 79 (0.4%)
- Northern European: 72 (0.4%)
- Ukrainian: 69 (0.4%)
- Nigerian: 63 (0.4%)
- Yugoslavian: 62 (0.3%)
- Russian: 59 (0.3%)
- Kenyan: 57 (0.3%)
- French: 57 (0.3%)
- Serbian: 55 (0.3%)
- Canadian: 54 (0.3%)
- Afghan: 51 (0.3%)
- Scotch-Irish: 47 (0.3%)
- Greek: 33 (0.2%)
- Scandinavian: 30 (0.2%)
- Iranian: 28 (0.2%)
- Swedish: 25 (0.1%)
- British: 24 (0.1%)
- Danish: 24 (0.1%)
- Scottish: 23 (0.1%)
- Slovene: 22 (0.1%)
- Dutch: 17 (0.10%)
- Latvian: 14 (0.08%)
- Armenian: 10 (0.06%)
- Turkish: 10 (0.06%)
- Croatian: 7 (0.04%)
- Hungarian: 3 (0.02%)
- Sudanese: 2 (0.01%)
Most common places of birth for foreign-born residents (%):
| SeaTac: | 21.2% (2,663) |
| Washington: | 1.6% (17,938) |
| SeaTac: | 13.4% (1,689) |
| Washington: | 21.1% (241,655) |
| SeaTac: | 7.6% (956) |
| Washington: | 0.7% (8,540) |
| SeaTac: | 6.8% (862) |
| Washington: | 8.9% (101,353) |
| SeaTac: | 6.6% (836) |
| Washington: | 6.3% (71,661) |
| SeaTac: | 5.2% (660) |
| Washington: | 5.4% (62,003) |
| SeaTac: | 3.4% (427) |
| Washington: | 0.6% (6,500) |
| SeaTac: | 3.0% (382) |
| Washington: | 1.2% (13,855) |
| SeaTac: | 2.8% (356) |
| Washington: | 1.1% (12,735) |
| SeaTac: | 2.3% (290) |
| Washington: | 1.2% (13,745) |
| SeaTac: | 2.3% (287) |
| Washington: | 1.0% (10,993) |
| SeaTac: | 2.1% (266) |
| Washington: | 0.3% (3,171) |
| SeaTac: | 1.8% (228) |
| Washington: | 0.1% (1,702) |
Place of birth for U.S.-born residents:
- This state: 11,093
- Other state: 6,671
- Northeast: 825
- Midwest: 1,979
- South: 1,147
- West: 2,740
82.1% of SeaTac residents lived in the same house 1 years ago.
Out of people who lived in different houses, 43.3% lived in this county.
Out of people who lived in different counties, 51.5% lived in Washington.
| SeaTac: | 82.1% |
| State average: | 85.2% |
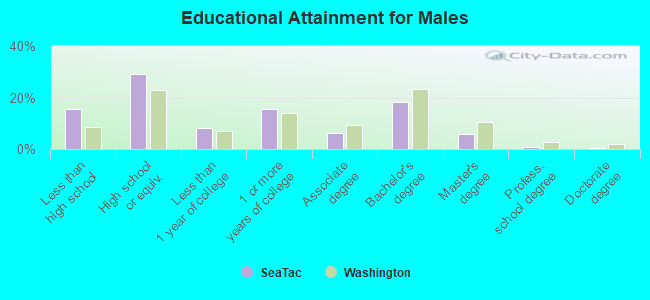
Education attainment for males 25 years and older:
- No schooling: 449
- Nursery to 4th grade: 210
- 5th and 6th grade: 183
- 7th and 8th grade: 123
- 9th grade: 425
- 10th grade: 47
- 11th grade: 94
- 12th grade, no diploma: 291
- High school graduate (or equivalency): 3,478
- Less than 1 year of college: 975
- Some college more than 1 year, no degree: 1,852
- Associate degree: 746
- Bachelor's degree: 2,187
- Master's degree: 693
- Professional school degree: 81
- Doctorate degree: 27
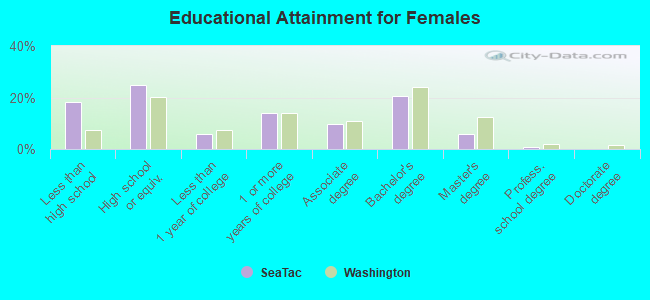
Education attainment for females 25 years and older:
- No schooling: 545
- Nursery to 4th grade: 17
- 5th and 6th grade: 276
- 7th and 8th grade: 22
- 9th grade: 246
- 10th grade: 153
- 11th grade: 212
- 12th grade, no diploma: 302
- High school graduate (or equivalency): 2,431
- Less than 1 year of college: 569
- Some college more than 1 year, no degree: 1,354
- Associate degree: 926
- Bachelor's degree: 2,008
- Master's degree: 582
- Professional school degree: 59
- Doctorate degree: 15


Housing units in structures:
- One, detached: 5,493
- One, attached: 381
- Two: 199
- 3 or 4: 572
- 5 to 9: 1,218
- 10 to 19: 1,812
- 20 to 49: 955
- 50 or more: 1,104
- Mobile homes: 596
Median worth of mobile homes: $29,734
Housing units lacking complete kitchen facilities in 2022: 0.5%
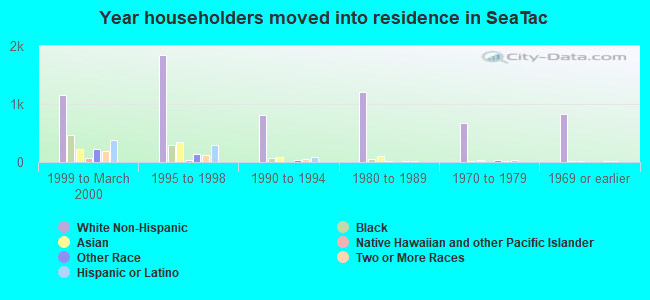
House/condo owner moved in on average 13 years ago
Renter moved in on average 4 years ago
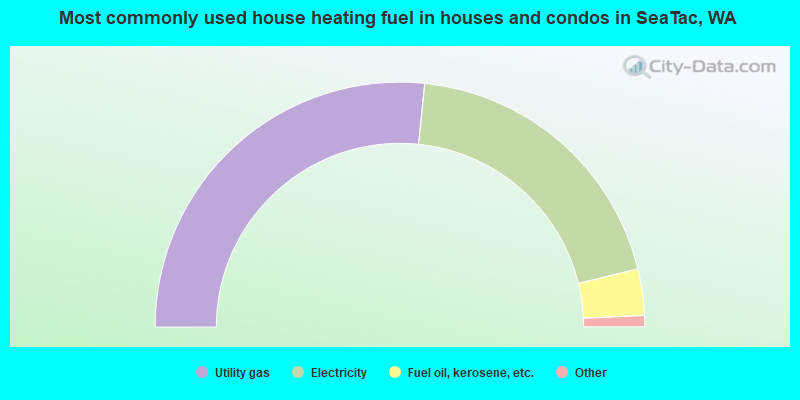
- 53.2%Utility gas
- 39.1%Electricity
- 6.1%Fuel oil, kerosene, etc.
- 0.9%Wood
- 0.6%Bottled, tank, or LP gas
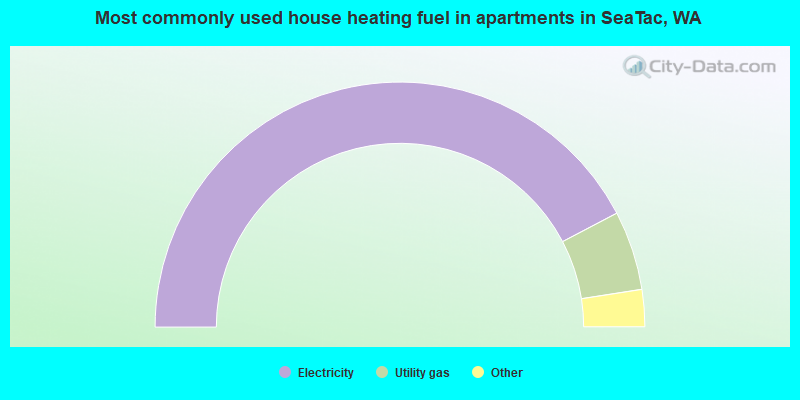
- 84.7%Electricity
- 10.5%Utility gas
- 2.7%Bottled, tank, or LP gas
- 1.9%Fuel oil, kerosene, etc.
- 0.2%No fuel used
- 0.1%Wood
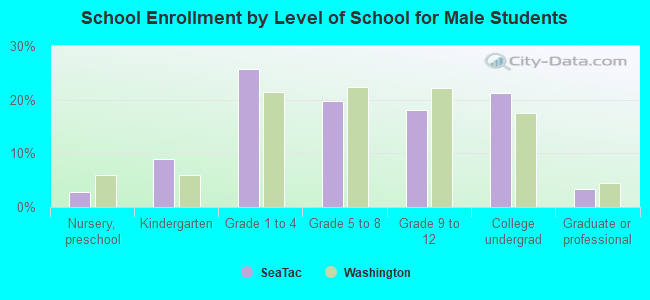
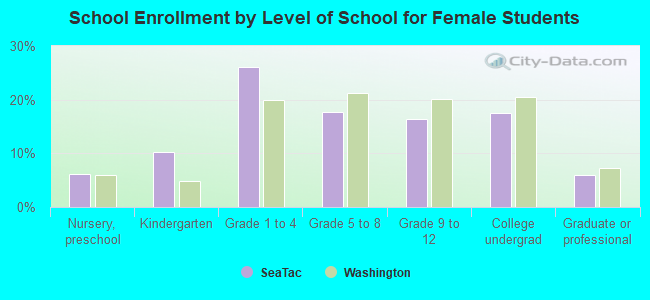
Private vs. public school enrollment:
| Here: | 9.0% |
| Washington: | 12.4% |
| Here: | 1.6% |
| Washington: | 9.2% |
| Here: | 9.7% |
| Washington: | 16.5% |