Races in SeaTac, Washington (WA) Detailed Stats
Data:
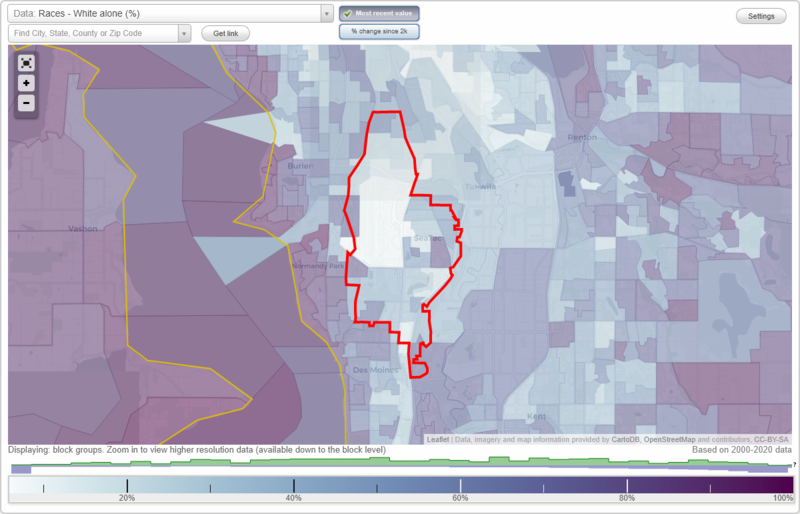
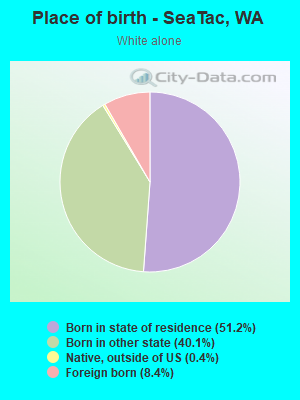
Races - White alone (%)
Races - White alone (% change since 2000)
Races - Black alone (%)
Races - Black alone (% change since 2000)
Races - American Indian alone (%)
Races - American Indian alone (% change since 2000)
Races - Asian alone (%)
Races - Asian alone (% change since 2000)
Races - Hispanic (%)
Races - Hispanic (% change since 2000)
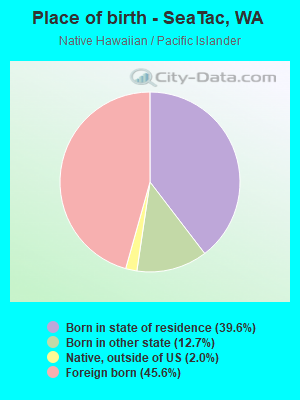
Races - Native Hawaiian and Other Pacific Islander alone (%)
Races - Native Hawaiian and Other Pacific Islander alone (% change since 2000)
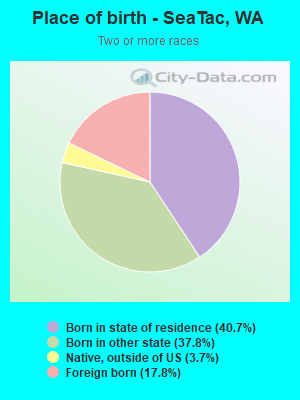
Races - Two or more races(%)
Races - Two or more races(% change since 2000)
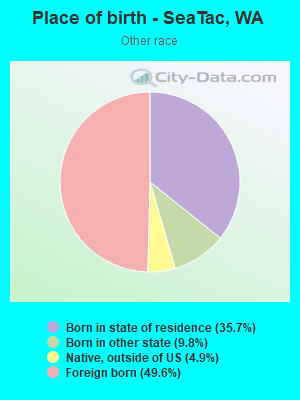
Races - Other race alone (%)
Races - Other race alone (% change since 2000)
Racial diversity
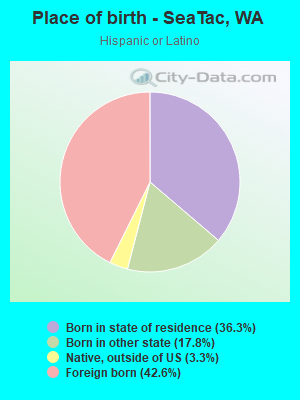
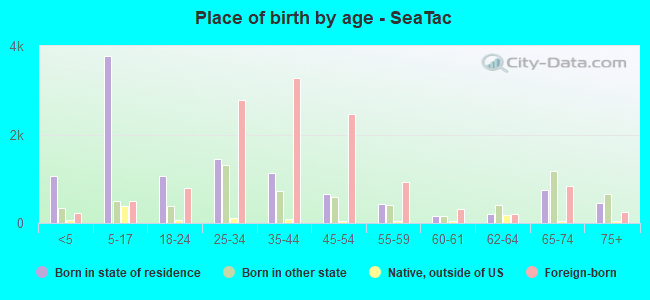
Place of birth - Born in state of residence (%)
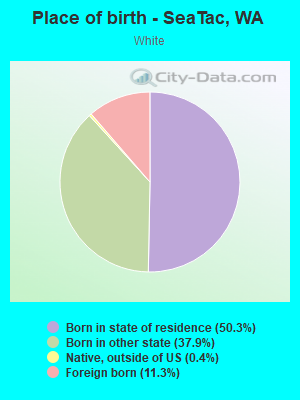
Place of birth - Born in state of residence (%) - White
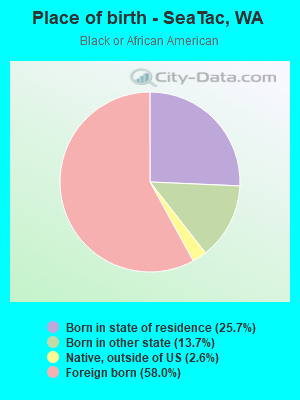
Place of birth - Born in state of residence (%) - Black or African American
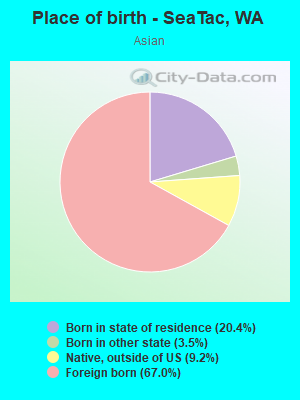
Place of birth - Born in state of residence (%) - Asian
Place of birth - Born in state of residence (%) - Hispanic or Latino
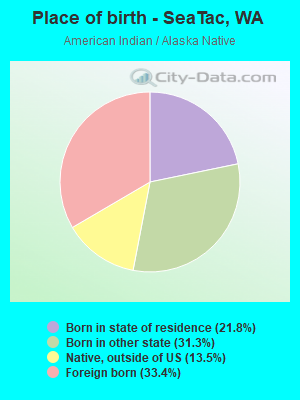
Place of birth - Born in state of residence (%) - American Indian and Alaska Native
Place of birth - Born in state of residence (%) - Multirace
Place of birth - Born in state of residence (%) - Other Race
Place of birth - Born in other state (%)
Place of birth - Born in other state (%) - White
Place of birth - Born in other state (%) - Black or African American
Place of birth - Born in other state (%) - Asian
Place of birth - Born in other state (%) - Hispanic or Latino
Place of birth - Born in other state (%) - American Indian and Alaska Native
Place of birth - Born in other state (%) - Multirace
Place of birth - Born in other state (%) - Other Race
Place of birth - Native, outside of US (%)
Place of birth - Native, outside of US (%) - White
Place of birth - Native, outside of US (%) - Black or African American
Place of birth - Native, outside of US (%) - Asian
Place of birth - Native, outside of US (%) - Hispanic or Latino
Place of birth - Native, outside of US (%) - American Indian and Alaska Native
Place of birth - Native, outside of US (%) - Multirace
Place of birth - Native, outside of US (%) - Other Race
Place of birth - Foreign born (%)
Place of birth - Foreign born (%) - White
Place of birth - Foreign born (%) - Black or African American
Place of birth - Foreign born (%) - Asian
Place of birth - Foreign born (%) - Hispanic or Latino
Place of birth - Foreign born (%) - American Indian and Alaska Native
Place of birth - Foreign born (%) - Multirace
Place of birth - Foreign born (%) - Other Race
Residents speaking English at home (%)
Residents speaking English at home - Born in the United States (%)
Residents speaking English at home - Native, born elsewhere (%)
Residents speaking English at home - Foreign born (%)
Residents speaking Spanish at home (%)
Residents speaking Spanish at home - Born in the United States (%)
Residents speaking Spanish at home - Native, born elsewhere (%)
Residents speaking Spanish at home - Foreign born (%)
Residents speaking other language at home (%)
Residents speaking other language at home - Born in the United States (%)
Residents speaking other language at home - Native, born elsewhere (%)
Residents speaking other language at home - Foreign born (%)
Marital status - Never married (%)
Marital status - Now married (%)
Marital status - Separated (%)
Marital status - Widowed (%)
Marital status - Divorced (%)
Ancestries Reported - Arab (%)
Ancestries Reported - Czech (%)
Ancestries Reported - Danish (%)
Ancestries Reported - Dutch (%)
Ancestries Reported - English (%)
Ancestries Reported - French (%)
Ancestries Reported - French Canadian (%)
Ancestries Reported - German (%)
Ancestries Reported - Greek (%)
Ancestries Reported - Hungarian (%)
Ancestries Reported - Irish (%)
Ancestries Reported - Italian (%)
Ancestries Reported - Lithuanian (%)
Ancestries Reported - Norwegian (%)
Ancestries Reported - Polish (%)
Ancestries Reported - Portuguese (%)
Ancestries Reported - Russian (%)
Ancestries Reported - Scotch-Irish (%)
Ancestries Reported - Scottish (%)
Ancestries Reported - Slovak (%)
Ancestries Reported - Subsaharan African (%)
Ancestries Reported - Swedish (%)
Ancestries Reported - Swiss (%)
Ancestries Reported - Ukrainian (%)
Ancestries Reported - United States (%)
Ancestries Reported - Welsh (%)
Ancestries Reported - West Indian (%)
Ancestries Reported - Other (%)
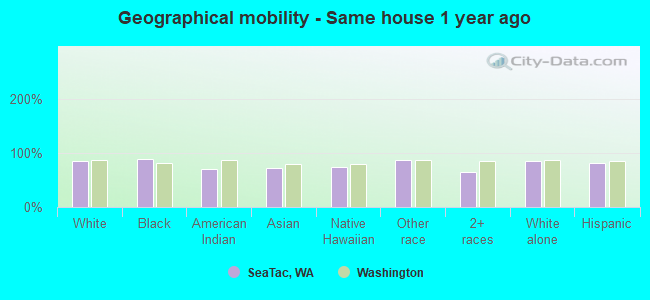
Geographical mobility - Same house 1 year ago (%)
Geographical mobility - Same house 1 year ago (%) - White
Geographical mobility - Same house 1 year ago (%) - Black or African American
Geographical mobility - Same house 1 year ago (%) - Asian
Geographical mobility - Same house 1 year ago (%) - Hispanic or Latino
Geographical mobility - Same house 1 year ago (%) - American Indian and Alaska Native
Geographical mobility - Same house 1 year ago (%) - Multirace
Geographical mobility - Same house 1 year ago (%) - Other Race
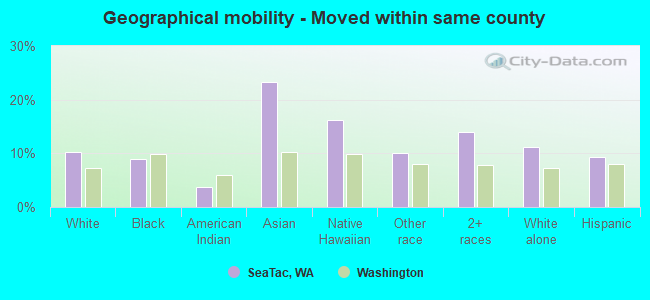
Geographical mobility - Moved within same county (%)
Geographical mobility - Moved within same county (%) - White
Geographical mobility - Moved within same county (%) - Black or African American
Geographical mobility - Moved within same county (%) - Asian
Geographical mobility - Moved within same county (%) - Hispanic or Latino
Geographical mobility - Moved within same county (%) - American Indian and Alaska Native
Geographical mobility - Moved within same county (%) - Multirace
Geographical mobility - Moved within same county (%) - Other Race
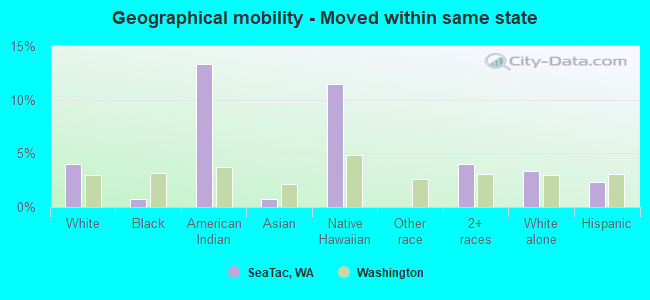
Geographical mobility - Moved from different county within same state (%)
Geographical mobility - Moved from different county within same state (%) - White
Geographical mobility - Moved from different county within same state (%) - Black or African American
Geographical mobility - Moved from different county within same state (%) - Asian
Geographical mobility - Moved from different county within same state (%) - Hispanic or Latino
Geographical mobility - Moved from different county within same state (%) - American Indian and Alaska Native
Geographical mobility - Moved from different county within same state (%) - Multirace
Geographical mobility - Moved from different county within same state (%) - Other Race
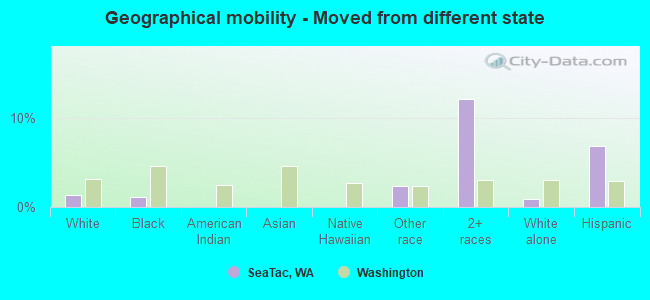
Geographical mobility - Moved from different state (%)
Geographical mobility - Moved from different state (%) - White
Geographical mobility - Moved from different state (%) - Black or African American
Geographical mobility - Moved from different state (%) - Asian
Geographical mobility - Moved from different state (%) - Hispanic or Latino
Geographical mobility - Moved from different state (%) - American Indian and Alaska Native
Geographical mobility - Moved from different state (%) - Multirace
Geographical mobility - Moved from different state (%) - Other Race
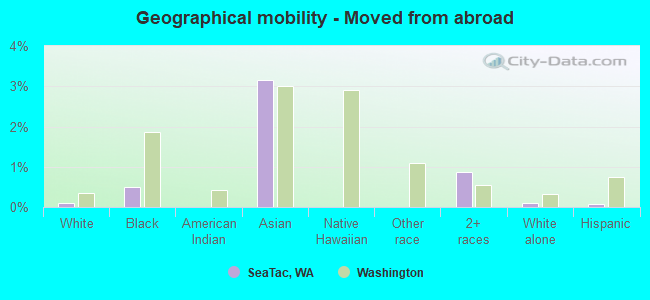
Geographical mobility - Moved from abroad (%)
Geographical mobility - Moved from abroad (%) - White
Geographical mobility - Moved from abroad (%) - Black or African American
Geographical mobility - Moved from abroad (%) - Asian
Geographical mobility - Moved from abroad (%) - Hispanic or Latino
Geographical mobility - Moved from abroad (%) - American Indian and Alaska Native
Geographical mobility - Moved from abroad (%) - Multirace
Geographical mobility - Moved from abroad (%) - Other Race
Place of birth for the foreign-born population - Ireland (%)
Place of birth for the foreign-born population - Denmark (%)
Place of birth for the foreign-born population - Norway (%)
Place of birth for the foreign-born population - Sweden (%)
Place of birth for the foreign-born population - United Kingdom (%)
Place of birth for the foreign-born population - England (%)
Place of birth for the foreign-born population - Scotland (%)
Place of birth for the foreign-born population - Other Northern Europe (%)
Place of birth for the foreign-born population - Austria (%)
Place of birth for the foreign-born population - Belgium (%)
Place of birth for the foreign-born population - France (%)
Place of birth for the foreign-born population - Germany (%)
Place of birth for the foreign-born population - Netherlands (%)
Place of birth for the foreign-born population - Switzerland (%)
Place of birth for the foreign-born population - Other Western Europe (%)
Place of birth for the foreign-born population - Greece (%)
Place of birth for the foreign-born population - Italy (%)
Place of birth for the foreign-born population - Portugal (%)
Place of birth for the foreign-born population - Spain (%)
Place of birth for the foreign-born population - Other Southern Europe (%)
Place of birth for the foreign-born population - Albania (%)
Place of birth for the foreign-born population - Belarus (%)
Place of birth for the foreign-born population - Bosnia and Herzegovina (%)
Place of birth for the foreign-born population - Bulgaria (%)
Place of birth for the foreign-born population - Croatia (%)
Place of birth for the foreign-born population - Czechoslovakia (%)
Place of birth for the foreign-born population - Hungary (%)
Place of birth for the foreign-born population - Latvia (%)
Place of birth for the foreign-born population - Lithuania (%)
Place of birth for the foreign-born population - North Macedonia (Macedonia) (%)
Place of birth for the foreign-born population - Moldova (%)
Place of birth for the foreign-born population - Poland (%)
Place of birth for the foreign-born population - Romania (%)
Place of birth for the foreign-born population - Russia (%)
Place of birth for the foreign-born population - Serbia (%)
Place of birth for the foreign-born population - Ukraine (%)
Place of birth for the foreign-born population - Other Eastern Europe (%)
Place of birth for the foreign-born population - China (%)
Place of birth for the foreign-born population - Hong Kong (%)
Place of birth for the foreign-born population - Taiwan (%)
Place of birth for the foreign-born population - Japan (%)
Place of birth for the foreign-born population - Korea (%)
Place of birth for the foreign-born population - Other Eastern Asia (%)
Place of birth for the foreign-born population - Afghanistan (%)
Place of birth for the foreign-born population - Bangladesh (%)
Place of birth for the foreign-born population - India (%)
Place of birth for the foreign-born population - Iran (%)
Place of birth for the foreign-born population - Kazakhstan (%)
Place of birth for the foreign-born population - Nepal (%)
Place of birth for the foreign-born population - Pakistan (%)
Place of birth for the foreign-born population - Sri Lanka (%)
Place of birth for the foreign-born population - Uzbekistan (%)
Place of birth for the foreign-born population - Other South Central Asia (%)
Place of birth for the foreign-born population - Burma (%)
Place of birth for the foreign-born population - Cambodia (%)
Place of birth for the foreign-born population - Indonesia (%)
Place of birth for the foreign-born population - Laos (%)
Place of birth for the foreign-born population - Malaysia (%)
Place of birth for the foreign-born population - Philippines (%)
Place of birth for the foreign-born population - Singapore (%)
Place of birth for the foreign-born population - Thailand (%)
Place of birth for the foreign-born population - Vietnam (%)
Place of birth for the foreign-born population - Other South Eastern Asia (%)
Place of birth for the foreign-born population - Armenia (%)
Place of birth for the foreign-born population - Iraq (%)
Place of birth for the foreign-born population - Israel (%)
Place of birth for the foreign-born population - Jordan (%)
Place of birth for the foreign-born population - Kuwait (%)
Place of birth for the foreign-born population - Lebanon (%)
Place of birth for the foreign-born population - Saudi Arabia (%)
Place of birth for the foreign-born population - Syria (%)
Place of birth for the foreign-born population - Turkey (%)
Place of birth for the foreign-born population - Yemen (%)
Place of birth for the foreign-born population - Other Western Asia (%)
Place of birth for the foreign-born population - Eritrea (%)
Place of birth for the foreign-born population - Ethiopia (%)
Place of birth for the foreign-born population - Kenya (%)
Place of birth for the foreign-born population - Somalia (%)
Place of birth for the foreign-born population - Uganda (%)
Place of birth for the foreign-born population - Zimbabwe (%)
Place of birth for the foreign-born population - Other Eastern Africa (%)
Place of birth for the foreign-born population - Cameroon (%)
Place of birth for the foreign-born population - Congo (%)
Place of birth for the foreign-born population - Democratic Republic of Congo (Zaire) (%)
Place of birth for the foreign-born population - Other Middle Africa (%)
Place of birth for the foreign-born population - Egypt (%)
Place of birth for the foreign-born population - Morocco (%)
Place of birth for the foreign-born population - Sudan (%)
Place of birth for the foreign-born population - Other Northern Africa (%)
Place of birth for the foreign-born population - South Africa (%)
Place of birth for the foreign-born population - Other Southern Africa (%)
Place of birth for the foreign-born population - Cabo Verde (%)
Place of birth for the foreign-born population - Ghana (%)
Place of birth for the foreign-born population - Liberia (%)
Place of birth for the foreign-born population - Nigeria (%)
Place of birth for the foreign-born population - Senegal (%)
Place of birth for the foreign-born population - Sierra Leone (%)
Place of birth for the foreign-born population - Other Western Africa (%)
Place of birth for the foreign-born population - Australia (%)
Place of birth for the foreign-born population - New Zealand (%)
Place of birth for the foreign-born population - Fiji (%)
Place of birth for the foreign-born population - Micronesia (%)
Place of birth for the foreign-born population - Bahamas (%)
Place of birth for the foreign-born population - Barbados (%)
Place of birth for the foreign-born population - Cuba (%)
Place of birth for the foreign-born population - Dominica (%)
Place of birth for the foreign-born population - Dominican Republic (%)
Place of birth for the foreign-born population - Grenada (%)
Place of birth for the foreign-born population - Haiti (%)
Place of birth for the foreign-born population - Jamaica (%)
Place of birth for the foreign-born population - St. Vincent and the Grenadines (%)
Place of birth for the foreign-born population - Trinidad and Tobago (%)
Place of birth for the foreign-born population - West Indies (%)
Place of birth for the foreign-born population - Other Caribbean (%)
Place of birth for the foreign-born population - Belize (%)
Place of birth for the foreign-born population - Costa Rica (%)
Place of birth for the foreign-born population - El Salvador (%)
Place of birth for the foreign-born population - Guatemala (%)
Place of birth for the foreign-born population - Honduras (%)
Place of birth for the foreign-born population - Mexico (%)
Place of birth for the foreign-born population - Nicaragua (%)
Place of birth for the foreign-born population - Panama (%)
Place of birth for the foreign-born population - Other Central America (%)
Place of birth for the foreign-born population - Argentina (%)
Place of birth for the foreign-born population - Bolivia (%)
Place of birth for the foreign-born population - Brazil (%)
Place of birth for the foreign-born population - Chile (%)
Place of birth for the foreign-born population - Colombia (%)
Place of birth for the foreign-born population - Ecuador (%)
Place of birth for the foreign-born population - Guyana (%)
Place of birth for the foreign-born population - Peru (%)
Place of birth for the foreign-born population - Uruguay (%)
Place of birth for the foreign-born population - Venezuela (%)
Place of birth for the foreign-born population - Other South America (%)
Place of birth for the foreign-born population - Canada (%)
Place of birth for the foreign-born population - Other Northern America (%)
Place of birth for the foreign-born population - Other (%)
Latest news about races in SeaTac, WA collected exclusively by city-data.com from local newspapers, TV, and radio stations
According to 2022 data, the most numerous races in SeaTac, WA are White alone (8,842 residents), Hispanic (6,777 residents), and Asian alone (5,412 residents). 48.7% of SeaTac residents speak English at home. 40.5% of SeaTac, WA residents are foreign-born (13.8% born in Africa, 12.3% born in Asia, 9.9% born in Latin America), which is 63.0% greater than the foreign-born rate of 15.0% across the entire state of Washington.
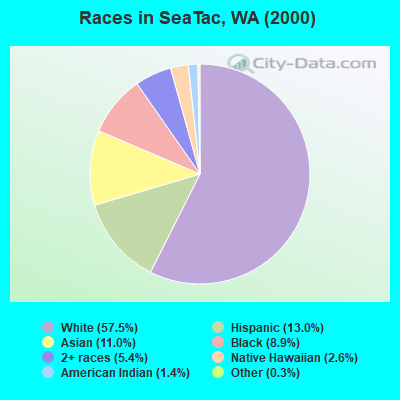
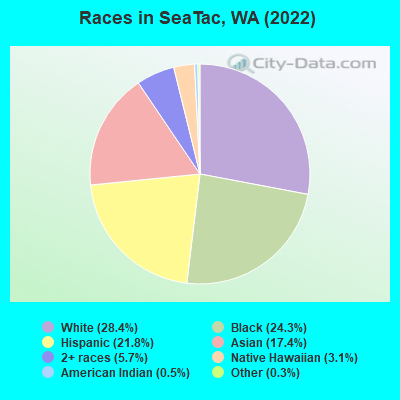
Race distribution in SeaTac
2000 2022
14,666 57.5% White alone 3,302 13.0% Hispanic 2,804 11.0% Asian alone 2,266 8.9% Black alone 1,371 5.4% Two or more races 664 2.6% Native Hawaiian and Other 346 1.4% American Indian alone 77 0.3% Other race alone
8,842 28.4% White alone 7,557 24.3% Black alone 6,777 21.8% Hispanic 5,412 17.4% Asian alone 1,774 5.7% Two or more races 973 3.1% Native Hawaiian and Other 145 0.5% American Indian alone 92 0.3% Other race alone
2000 2022
4,652,490 78.9% White alone 441,509 7.5% Hispanic 319,401 5.4% Asian alone 184,631 3.1% Black alone 175,926 3.0% Two or more races 85,396 1.4% American Indian alone 22,779 0.4% Native Hawaiian and Other 11,989 0.2% Other race alone
4,941,456 63.5% White alone 1,093,313 14.0% Hispanic 755,832 9.7% Asian alone 523,448 6.7% Two or more races 299,537 3.8% Black alone 69,024 0.9% American Indian alone 52,231 0.7% Native Hawaiian and Other 50,945 0.7% Other race alone
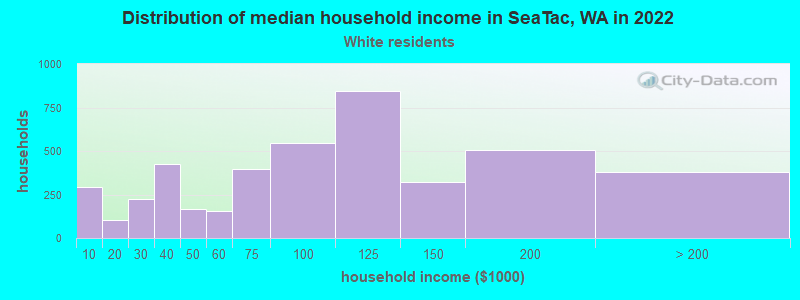
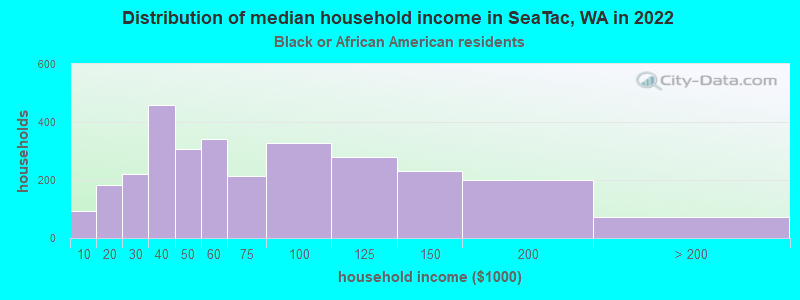
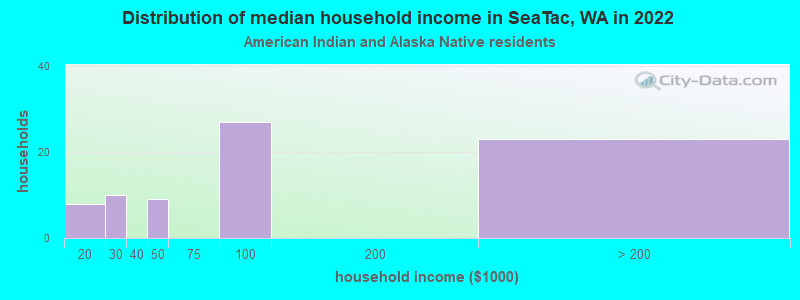
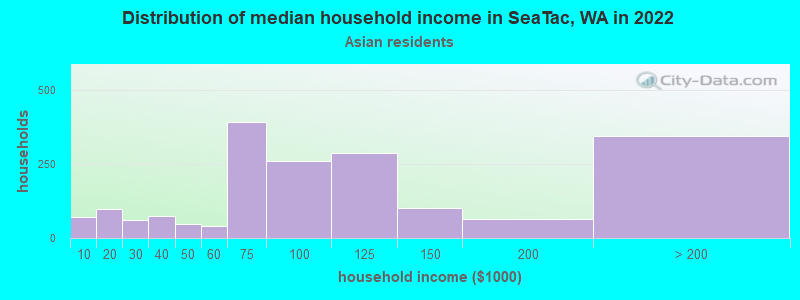
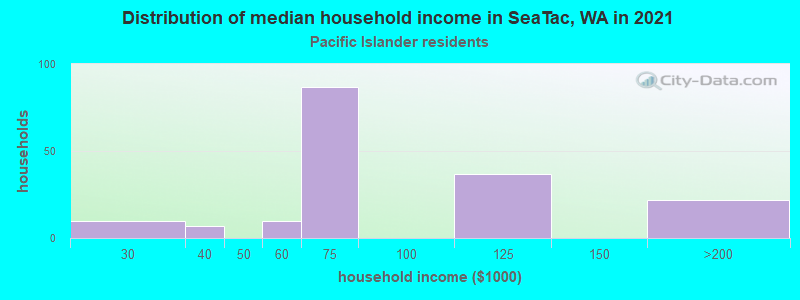
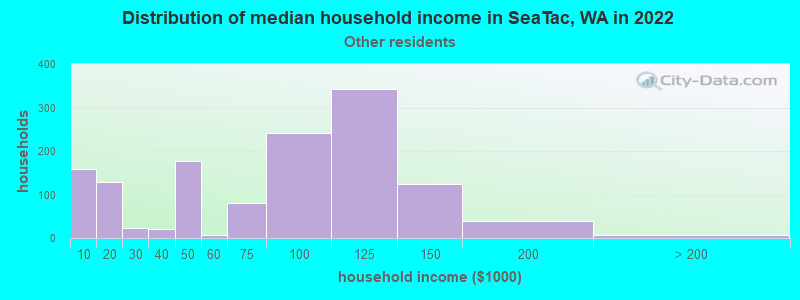
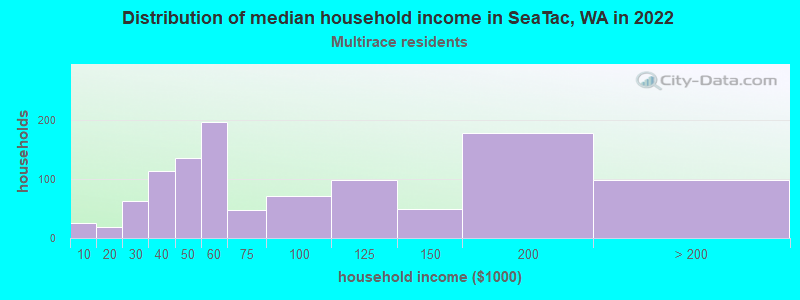
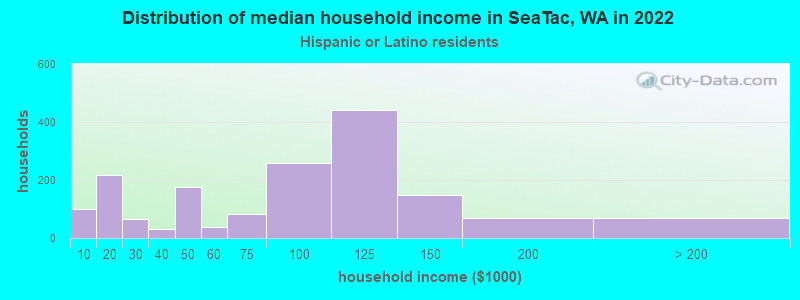
Income and house value in SeaTac Median household income in 2022 $91,974 White non-Hispanic householders$58,749 Black householders$95,573 Asian householders$85,653 Native Hawaiian and other Pacific Islander householders$85,414 Some other race householders$68,747 Two or more races householders$80,445 Hispanic or Latino race householdersMedian 2022 house value $540,610 White Non-Hispanic householders$552,347 Black or African American householders$481,923 American Indian or Alaska Native householders $574,096 Asian householders$589,631 Native Hawaiian and other Pacific Islander householders$543,372 Some other race householders$509,540 Two or more races householders$541,300 Hispanic or Latino householders
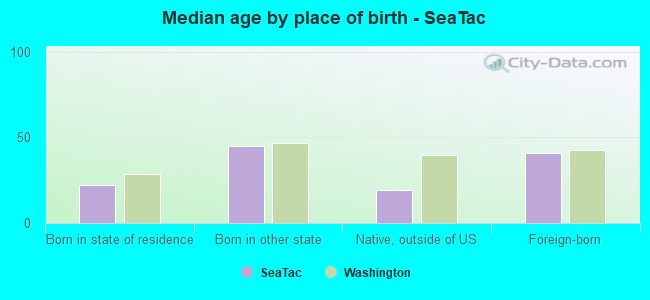
Median age by race in SeaTac
46.2 Median age for White residents46.5 46.2 36.0 Median age for Black or African American residents34.5 38.6 49.8 Median age for American Indian / Alaska Native residents50.6 61.7 35.5 Median age for Asian residents34.0 38.4 27.9 Median age for Native Hawaiian / Pacific Islander residents38.8 26.4 26.2 Median age for Other race residents29.7 19.5 29.8 Median age for Two or more races residents30.2 28.7 50.9 Median age for White alone residents51.0 51.2 27.5 Median age for Hispanic or Latino residents31.0 19.3
Owner/renter occupied households by race in SeaTac
House owners and renters - White residents 3,023 69.0% Owner occupied1,355 31.0% Renter occupiedHouse owners and renters - Black or African American residents 455 14.7% Owner occupied2,639 85.3% Renter occupiedHouse owners and renters - American Indian / Alaska Native residents 58 87.3% Owner occupied9 12.7% Renter occupiedHouse owners and renters - Asian residents 1,200 66.4% Owner occupied608 33.6% Renter occupiedHouse owners and renters - Native Hawaiian / Pacific Islander residents 28 12.4% Owner occupied195 87.6% Renter occupiedHouse owners and renters - Other race residents 357 27.3% Owner occupied950 72.7% Renter occupiedHouse owners and renters - Two or more races residents 360 34.1% Owner occupied696 65.9% Renter occupiedHouse owners and renters - White alone residents 2,864 68.6% Owner occupied1,309 31.4% Renter occupiedHouse owners and renters - Hispanic or Latino residents 590 35.6% Owner occupied1,067 64.4% Renter occupied
Language usage in SeaTac
English speakers - Total 48.7% of residents of SeaTac speak English at home.
17.3% of residents speak Spanish at home 2,678 52.6% Speak English very well2,410 47.4% Speak English less than very well35.6% of residents speak other language at home 5,409 51.7% Speak English very well5,045 48.3% Speak English less than very well
English speakers - Born in the United States 84.8% of residents of SeaTac speak English at home.
9.1% of residents speak Spanish at home 510 88.9% Speak English very well64 11.1% Speak English less than very well6.6% of residents speak other language at home 333 79.9% Speak English very well84 20.1% Speak English less than very well
English speakers - Native, born elsewhere 48.6% of residents of SeaTac speak English at home.
7.8% of residents speak Spanish at home 75 100.0% Speak English very well47.4% of residents speak other language at home 327 71.4% Speak English very well131 28.6% Speak English less than very well
English speakers - Foreign-born 10.2% of residents of SeaTac speak English at home.
21.0% of residents speak Spanish at home 732 28.2% Speak English very well1,865 71.8% Speak English less than very well68.1% of residents speak other language at home 3,816 45.3% Speak English very well4,608 54.7% Speak English less than very well
White (Caucasian) - Speak only English Native:
93.9% (7,948)Foreign-born:
33.5% (372)
White (Caucasian) - Speak another language Native:
6.0% (511)Foreign-born:
66.4% (736)
Black or African American - Speak only English Native:
73.1% (2,069)Foreign-born:
6.7% (296)
Black or African American - Speak another language Native:
26.5% (749)Foreign-born:
91.7% (4,040)
American Indian / Alaska Native - Speak another language Native:
7.0% (10)Foreign-born:
100.0% (85)
Asian - Speak only English Native:
51.6% (731)Foreign-born:
12.8% (469)
Asian - Speak another language Native:
49.1% (696)Foreign-born:
87.2% (3,181)
Native Hawaiian / Pacific Islander - Speak only English Native:
55.8% (278)Foreign-born:
6.4% (27)
Native Hawaiian / Pacific Islander - Speak another language Native:
47.2% (235)Foreign-born:
90.4% (378)
Other race - Speak only English Native:
18.5% (459)Foreign-born:
1.3% (32)
Other race - Speak another language Native:
80.3% (1,998)Foreign-born:
99.9% (2,397)
Two or more races - Speak only English Native:
82.4% (1,617)Foreign-born:
25.0% (124)
Two or more races - Speak another language Native:
17.9% (351)Foreign-born:
74.7% (370)
White alone - Speak only English Native:
97.1% (7,667)Foreign-born:
40.9% (303)
White alone - Speak another language Native:
2.8% (222)Foreign-born:
57.6% (426)
Hispanic or Latino - Speak only English Native:
33.1% (1,179)Foreign-born:
4.1% (111)
Hispanic or Latino - Speak another language Native:
68.4% (2,435)Foreign-born:
96.1% (2,599)
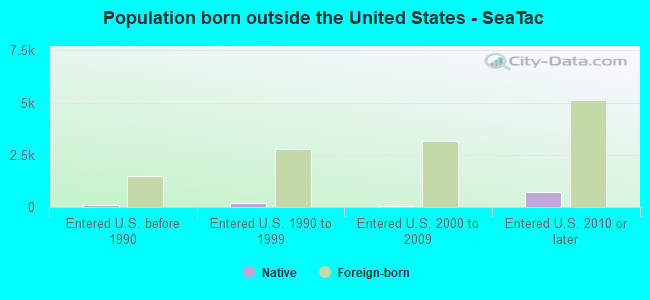
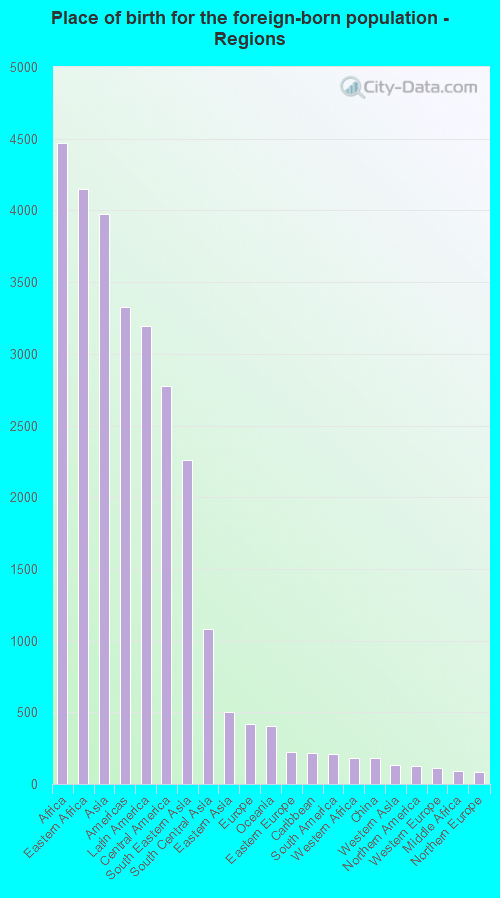
Foreign-born residents in SeaTac 12,591 residents are foreign born (13.8% Africa , 12.3% Asia , 9.9% Latin America ).
This city:
40.5%Washington:
14.9%
Marital status for residents in SeaTac Marital status - White (Caucasian) population 15 years and over
Males 40.4% Never married39.5% Now married2.6% Separated6.0% Widowed11.5% DivorcedFemales 23.5% Never married43.5% Now married1.2% Separated11.0% Widowed20.8% DivorcedWomen who gave birth in the past 12 months Now married:
83.9% (72)Unmarried:
16.1% (14)
Women who did not give birth in the past 12 months Now married:
43.4% (782)Unmarried:
56.6% (1,020)
Marital status - Black or African American population 15 years and over
Males 35.9% Never married49.0% Now married0.6% Separated0.9% Widowed13.5% DivorcedFemales 25.6% Never married57.9% Now married5.5% Separated2.9% Widowed8.2% DivorcedWomen who gave birth in the past 12 months Now married:
100.0% (113)Unmarried:
0.0% (0)
Women who did not give birth in the past 12 months Now married:
60.9% (951)Unmarried:
39.1% (611)
Marital status - American Indian / Alaska Native population 15 years and over
Males 73.6% Never married7.8% Now married0.0% Separated0.0% Widowed18.6% DivorcedFemales 37.5% Never married10.2% Now married11.4% Separated33.0% Widowed8.0% DivorcedWomen who did not give birth in the past 12 months Now married:
57.6% (23)Unmarried:
42.4% (17)
Marital status - Asian population 15 years and over
Males 38.1% Never married57.8% Now married0.4% Separated0.0% Widowed3.6% DivorcedFemales 30.2% Never married57.6% Now married0.0% Separated3.3% Widowed8.9% DivorcedWomen who gave birth in the past 12 months Now married:
100.0% (78)Unmarried:
0.0% (0)
Women who did not give birth in the past 12 months Now married:
43.4% (621)Unmarried:
56.6% (808)
Marital status - Native Hawaiian / Pacific Islander population 15 years and over
Males 49.0% Never married51.0% Now married0.0% Separated0.0% Widowed0.0% DivorcedFemales 29.5% Never married49.2% Now married1.4% Separated20.0% Widowed0.0% DivorcedWomen who gave birth in the past 12 months Now married:
100.0% (23)Unmarried:
0.0% (0)
Women who did not give birth in the past 12 months Now married:
49.3% (113)Unmarried:
50.7% (116)
Marital status - Other race population 15 years and over
Males 54.7% Never married39.1% Now married2.4% Separated0.0% Widowed3.9% DivorcedFemales 60.4% Never married38.1% Now married0.0% Separated1.5% Widowed0.0% DivorcedWomen who gave birth in the past 12 months Now married:
100.0% (73)Unmarried:
0.0% (0)
Women who did not give birth in the past 12 months Now married:
25.6% (267)Unmarried:
74.4% (774)
Marital status - Two or more races population 15 years and over
Males 42.2% Never married48.4% Now married3.5% Separated0.0% Widowed5.8% DivorcedFemales 45.6% Never married33.5% Now married1.6% Separated3.8% Widowed15.5% DivorcedWomen who gave birth in the past 12 months Now married:
97.1% (76)Unmarried:
2.9% (2)
Women who did not give birth in the past 12 months Now married:
26.2% (138)Unmarried:
73.8% (390)
Marital status - White alone, not Hispanic / Latino population 15 years and over
Males 40.1% Never married38.3% Now married2.9% Separated6.6% Widowed12.1% DivorcedFemales 21.0% Never married43.9% Now married1.1% Separated11.4% Widowed22.6% DivorcedWomen who gave birth in the past 12 months Now married:
100.0% (74)Unmarried:
0.0% (0)
Women who did not give birth in the past 12 months Now married:
42.0% (636)Unmarried:
58.0% (879)
Marital status - Hispanic or Latino population 15 years and over
Males 54.4% Never married40.0% Now married1.7% Separated0.0% Widowed3.9% DivorcedFemales 54.6% Never married40.0% Now married1.2% Separated3.2% Widowed1.1% DivorcedWomen who gave birth in the past 12 months Now married:
86.8% (116)Unmarried:
13.2% (18)
Women who did not give birth in the past 12 months Now married:
33.6% (490)Unmarried:
66.4% (966)
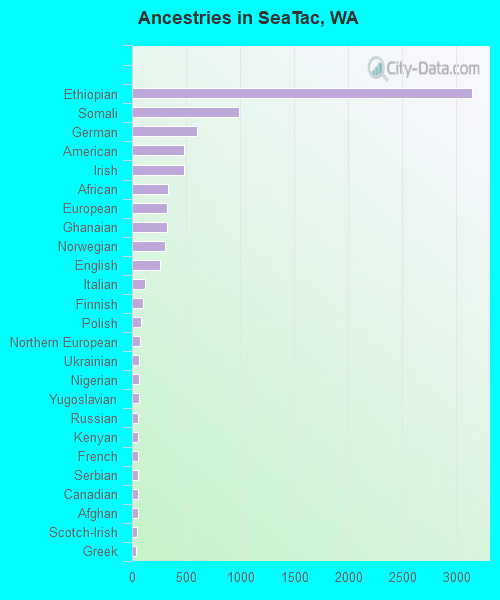
Ancestries in SeaTac
3,146 17.6% Ethiopian991 5.6% Somali606 3.4% German483 2.7% American477 2.7% Irish333 1.9% African328 1.8% European320 1.8% Ghanaian302 1.7% Norwegian258 1.4% English124 0.7% Italian103 0.6% Finnish79 0.4% Polish72 0.4% Northern European69 0.4% Ukrainian63 0.4% Nigerian62 0.3% Yugoslavian59 0.3% Russian57 0.3% Kenyan57 0.3% French55 0.3% Serbian54 0.3% Canadian51 0.3% Afghan47 0.3% Scotch-Irish33 0.2% Greek30 0.2% Scandinavian28 0.2% Iranian25 0.1% Swedish24 0.1% British24 0.1% Danish23 0.1% Scottish22 0.1% Slovene17 0.10% Dutch14 0.08% Latvian10 0.06% Armenian10 0.06% Turkish7 0.04% Croatian3 0.02% Hungarian2 0.01% Sudanese
Geographical mobility in SeaTac Same house 1 year ago 8,189 84.4% White (Caucasian)6,662 88.5% Black or African American163 70.4% American Indian / Alaska Native3,892 72.5% Asian748 74.5% Native Hawaiian / Pacific Islander4,490 87.2% Other race1,768 65.2% Two or more races7,401 84.3% White alone, not Hispanic / Latino5,469 82.0% Hispanic or LatinoMoved within same county 1,002 10.3% White / Caucasian670 8.9% Black or African American9 3.8% American Indian / Alaska Native1,251 23.3% Asian163 16.3% Native Hawaiian / Pacific Islander515 10.0% Other race378 13.9% Two or more races984 11.2% White alone, not Hispanic / Latino627 9.4% Hispanic or LatinoMoved within same state 392 4.0% White / Caucasian57 0.8% Black or African American31 13.3% American Indian / Alaska Native41 0.8% Asian115 11.4% Native Hawaiian / Pacific Islander109 4.0% Two or more races298 3.4% White alone, not Hispanic / Latino157 2.3% Hispanic or LatinoMoved from different state 126 1.3% White / Caucasian84 1.1% Black or African American121 2.3% Other race328 12.1% Two or more races79 0.9% White alone, not Hispanic / Latino458 6.9% Hispanic or LatinoMoved from abroad 9 0.1% White37 0.5% Black or African American169 3.2% Asian24 0.9% Two or more races10 0.1% White alone, not Hispanic / Latino6 0.1% Hispanic or Latino
Children Nativity (place of birth) in SeaTac
Children under 6 years - Living with two parents Both parents native 369 100.0% NativeBoth parents foreign-born 936 93.0% Native71 7.0% Foreign-bornOne native, one foreign-born parent 260 100.0% NativeChildren under 6 years - Living with one parent Native parent 126 100.0% NativeForeign-born parent 252 45.1% Native307 54.9% Foreign-bornChildren 6 to 17 years - Living with two parents Both parents native 354 100.0% NativeBoth parents foreign-born 1,699 86.4% Native266 13.6% Foreign-bornOne native, one foreign-born parent 259 100.0% NativeChildren 6 to 17 years - Living with one parent Native parent 554 100.0% NativeForeign-born parent 1,186 54.3% Native999 45.7% Foreign-born
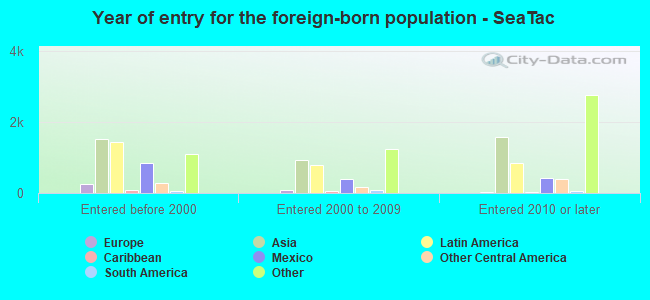
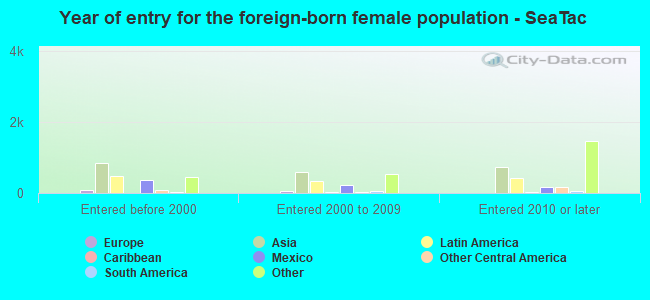
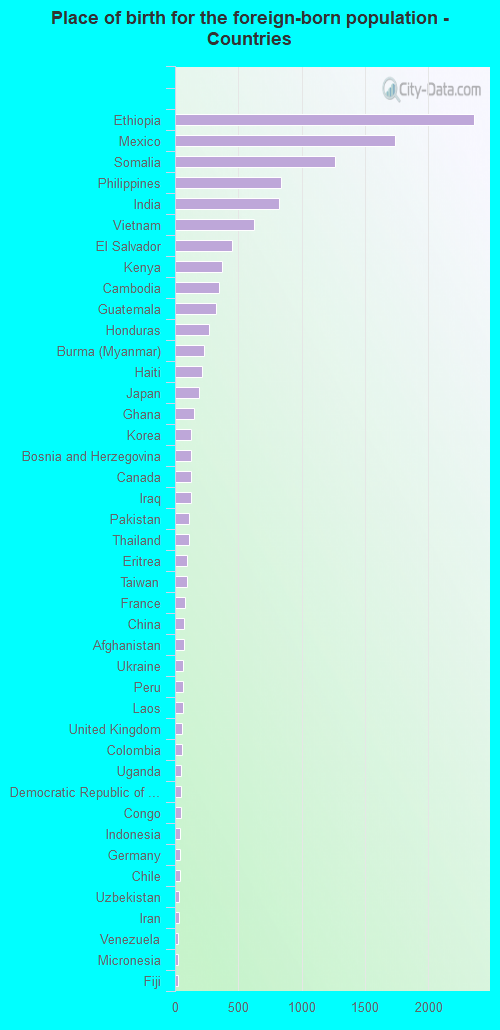
Place of birth for residents in SeaTac 4,467 Africa4,149 Eastern Africa3,973 Asia3,324 Americas3,195 Latin America2,772 Central America2,257 South Eastern Asia1,083 South Central Asia500 Eastern Asia419 Europe405 Oceania222 Eastern Europe214 Caribbean208 South America179 Western Africa178 China133 Western Asia128 Northern America115 Western Europe93 Middle Africa81 Northern Europe6 Northern Africa2,361 Ethiopia1,733 Mexico1,266 Somalia834 Philippines824 India621 Vietnam451 El Salvador370 Kenya346 Cambodia321 Guatemala265 Honduras226 Burma (Myanmar)213 Haiti191 Japan150 Ghana130 Korea130 Bosnia and Herzegovina128 Canada124 Iraq109 Pakistan107 Thailand98 Eritrea94 Taiwan76 France75 China75 Afghanistan66 Ukraine63 Peru60 Laos58 United Kingdom58 Colombia50 Uganda49 Democratic Republic of Congo (Zaire)44 Congo40 Indonesia38 Germany37 Chile33 Uzbekistan30 Iran27 Venezuela27 Micronesia23 Fiji20 Brazil18 Malaysia18 Poland13 Ireland8 Hong Kong8 Turkey6 Croatia1 Jamaica
Grandparents responsible for own grandchildren in SeaTac
Grandparents (30 to 59 years) White / Caucasian 50 100.0% Not responsible for grandchildrenAsian 124 100.0% Not responsible for grandchildrenNative Hawaiian / Pacific Islander 6 19.6% Responsible for grandchildren26 80.4% Not responsible for grandchildrenOther race 72 100.0% Responsible for grandchildrenTwo or more races 62 100.0% Not responsible for grandchildrenWhite alone, not Hispanic / Latino 54 100.0% Not responsible for grandchildrenHispanic or Latino 65 92.1% Responsible for grandchildren6 7.9% Not responsible for grandchildrenGrandparents (60 years and over) White / Caucasian 37 100.0% Not responsible for grandchildrenAsian 117 100.0% Not responsible for grandchildrenNative Hawaiian / Pacific Islander 6 19.4% Responsible for grandchildren27 80.6% Not responsible for grandchildrenOther race 122 100.0% Not responsible for grandchildrenWhite alone, not Hispanic / Latino 37 100.0% Not responsible for grandchildrenHispanic or Latino 149 100.0% Not responsible for grandchildren