Jump to a detailed profile or search site with Google Custom Search

Sandy Springs, GA (Georgia) Houses and Residents

Estimated median house or condo value in 2022: $649,500 (it was $316,600 in 2000)
Sandy Springs:

$649,500
Georgia:

$297,400
Lower value quartile - upper value quartile: $330,400 - $964,800

Mean price in 2022:

Detached houses: $1,006,374
Here:

$1,006,374
State:

$376,364

Townhouses or other attached units: $349,999
Here:

$349,999
State:

$341,709

In 2-unit structures: $221,970
Here:

$221,970
State:

$269,631

In 3-to-4-unit structures: $131,062
Here:

$131,062
State:

$250,092

In 5-or-more-unit structures: $265,773
Here:

$265,773
State:

$370,730

Mobile homes: $433,465
Here:

$433,465
State:

$102,413

Total population: 101,908 (Urban population: 85,524, Rural population: 0)

Houses: 53,784 (50,135 occupied: 27,967 owner occupied, 22,168 renter occupied)

% of renters here:

44%
State:

34%

Housing density: 1,426 houses/condos per square mile

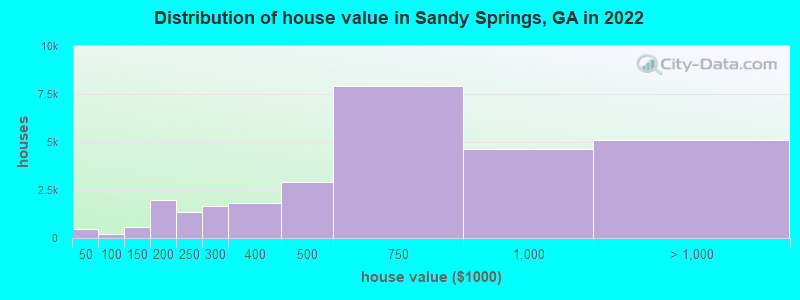
Median price asked for vacant for-sale houses and condos in 2022: $471,375.

Median contract rent in 2022: $1,582 (lower quartile is $1,296, upper quartile is $1,891)


Median rent asked for vacant for-rent units in 2022: $1,977


Median gross rent in Sandy Springs, GA in 2022: $1,713

Housing units in Sandy Springs with a mortgage: 18,085 (3,426 second mortgage, 0 home equity loan, 3,318 both second mortgage and home equity loan)
Houses without a mortgage: 318

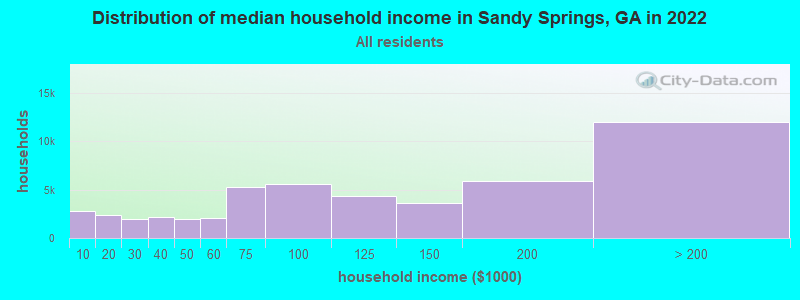
Median household income for houses/condos with a mortgage: $199,365

Median household income for apartments without a mortgage: $95,132

Median monthly housing costs: $1,778

Compare current foreclosures near Sandy Springs, GA:

Check out more offers near Sandy Springs, GA.
Powered by Foreclosure.com

Settings
X
Data:
Loading data...
Based on 2000-2022 data
Loading data...

123
Hide US histogram

Sandy Springs, Georgia Age and Sex of Residents
Median year house/condo built: 1985

Median year apartment built: 1993

Household type by relationship:

Households: 107,767
  • Male householders: 25,128 (7,356 living alone), Female householders: 25,007 (10,069 living alone)
  • 21,924 spouses (21,425 opposite-sex spouses), 4,036 unmarried partners, (3,522 opposite-sex unmarried partners), 24,179 children (21,724 natural, 2,020 adopted, 435 stepchildren), 774 grandchildren, 1,301 brothers or sisters, 951 parents, 0 foster children, 1,116 other relatives, 2,278 non-relatives
  • In group quarters: 1,073

Size of family households: 15,925 2-persons, 6,309 3-persons, 4,408 4-persons, 1,109 5-persons, 412 6-persons.

Size of nonfamily households: 17,425 1-person, 4,421 2-persons, 126 4-persons.

12,728 married couples with children.
6,093 single-parent households (1,053 men, 5,040 women).

81.3% of residents of Sandy Springs speak English at home.
7.9% of residents speak Spanish at home (61% speak English very well, 18% speak English well, 16% speak English not well, 5% don't speak English at all).
5.1% of residents speak other Indo-European language at home (65% speak English very well, 24% speak English well, 12% speak English not well).
4.7% of residents speak Asian or Pacific Island language at home (68% speak English very well, 26% speak English well, 5% speak English not well, 1% don't speak English at all).
1.2% of residents speak other language at home (88% speak English very well, 10% speak English well, 3% speak English not well).

Foreign born population: 17,166 (15.9%)
(42.4% of them are naturalized citizens)

Median number of rooms in houses and condos:
Here:

8.0
State:

6.8

Median number of rooms in apartments
Here:

3.9
State:

4.6

Owner-occupied Renter-occupied
Bedrooms in owner-occupied houses and condos in Sandy Springs, Georgia
  • Bedrooms in owner-occupied houses and condos in Sandy Springs, Georgia
  • 103no bedroom
  • 1,6111 bedroom
  • 4,9212 bedrooms
  • 6,2843 bedrooms
  • 7,4574 bedrooms
  • 7,5915+ bedrooms
Bedrooms in renter-occupied apartments in Sandy Springs, Georgia
  • Bedrooms in renter-occupied apartments in Sandy Springs, Georgia
  • 1,730no bedroom
  • 7,0491 bedroom
  • 10,5402 bedrooms
  • 2,4363 bedrooms
  • 3214 bedrooms
  • 925+ bedrooms
Owner-occupied Renter-occupied
Cars and other vehicles available in Sandy Springs in owner-occupied houses/condos
  • Cars and other vehicles available in Sandy Springs in owner-occupied houses/condos
  • 317no vehicle
  • 9,7561 vehicle
  • 11,8792 vehicles
  • 4,4023 vehicles
  • 1,3684 vehicles
  • 2455+ vehicles
Cars and other vehicles available in Sandy Springs in renter-occupied apartments
  • Cars and other vehicles available in Sandy Springs in renter-occupied apartments
  • 3,116no vehicle
  • 11,7001 vehicle
  • 6,7232 vehicles
  • 4403 vehicles
  • 1894 vehicles
  • 05+ vehicles
Owner-occupied Renter-occupied
Rooms in owner-occupied houses in Sandy Springs, Georgia
  • Rooms in owner-occupied houses in Sandy Springs, Georgia
  • 1031 room
  • 6162 rooms
  • 1,3083 rooms
  • 1,9274 rooms
  • 3,0335 rooms
  • 3,1296 rooms
  • 2,0697 rooms
  • 3,5178 rooms
  • 12,2659+ rooms
Rooms in renter-occupied apartments in Sandy Springs, Georgia
  • Rooms in renter-occupied apartments in Sandy Springs, Georgia
  • 1,7301 room
  • 1,7732 rooms
  • 5,8963 rooms
  • 4,7204 rooms
  • 4,0855 rooms
  • 1,4616 rooms
  • 9077 rooms
  • 9148 rooms
  • 6829+ rooms
Year house built
Median 2022 house/condo value by year built
Median house/condo value by year householder moved into unit
Breakdown of mean house values by ages of householders
Owners and renters by unit type in Sandy Springs, GA
  • Sandy Springs, GA household income distribution

  • Distribution of median household income in Sandy Springs, GA in 2022
  • 2,758Less than $10,000
  • 2,405$10,000 to $19,999
  • 1,984$20,000 to $29,999
  • 2,140$30,000 to $39,999
  • 2,001$40,000 to $49,999
  • 2,098$50,000 to $59,999
  • 5,270$60,000 to $74,999
  • 5,627$75,000 to $99,999
  • 4,394$100,000 to $124,999
  • 3,600$125,000 to $149,999
  • 5,864$150,000 to $199,999
  • 11,994$200,000 or more
  • Home value of owner - occupied houses in 2022 in Sandy Springs, GA

  • Distribution of house value in Sandy Springs, GA in 2022
  • 365Less than $10,000
  • 8$10,000 to $14,999
  • 19$15,000 to $19,999
  • 16$20,000 to $24,999
  • 18$25,000 to $29,999
  • 19$40,000 to $49,999
  • 29$50,000 to $59,999
  • 28$60,000 to $69,999
  • 59$80,000 to $89,999
  • 59$90,000 to $99,999
  • 244$100,000 to $124,999
  • 316$125,000 to $149,999
  • 751$150,000 to $174,999
  • 1,246$175,000 to $199,999
  • 1,343$200,000 to $249,999
  • 1,662$250,000 to $299,999
  • 1,824$300,000 to $399,999
  • 2,907$400,000 to $499,999
  • 7,895$500,000 to $749,999
  • 4,656$750,000 to $999,999
  • 2,704$1,000,000 to $1,499,999
  • 1,001$1,500,000 to $1,999,999
  • 1,401$2,000,000 or more
  • Rent paid by renters in 2022 in Sandy Springs, GA

  • Distribution of rent paid by renters in Sandy Springs, GA in 2022
  • 43$100 to $149
  • 96$200 to $249
  • 17$250 to $299
  • 52$400 to $449
  • 70$450 to $499
  • 8$500 to $549
  • 71$550 to $599
  • 186$600 to $649
  • 10$650 to $699
  • 170$750 to $799
  • 248$800 to $899
  • 779$900 to $999
  • 3,454$1,000 to $1,249
  • 5,959$1,250 to $1,499
  • 9,631$1,500 to $1,999
  • 2,290$2,000 to $2,499
  • 1,046$2,500 to $2,999
  • 248$3,000 to $3,499
  • 843$3,500 or more
  • 378No cash rent
Time Leaving Home To Go To Work in 2022

Percentage of workers working in this county: 73.1%
Number of people working at home: 19,936 (32.1% of all workers)

Travel time (in minutes) to work in 2022

Travel time to work (commute)

  • Less than 5 minutes: 417
  • 5 to 9 minutes: 3,262
  • 10 to 14 minutes: 5,573
  • 15 to 19 minutes: 6,476
  • 20 to 24 minutes: 7,467
  • 25 to 29 minutes: 3,857
  • 30 to 34 minutes: 4,929
  • 35 to 39 minutes: 1,803
  • 40 to 44 minutes: 1,567
  • 45 to 59 minutes: 3,215
  • 60 to 89 minutes: 2,341
  • 90 or more minutes: 1,246
Means of transportation to work in 2022 - Sandy Springs

Means of transportation to work:

  • Drove a car alone: 71,760 (70.7%)
  • Carpooled: 5,397 (5.3%)
  • Bus: 828 (0.8%)
  • Subway or elevated rail: 684 (0.7%)
  • Long-distance train or commuter rail: 26 (0.0%)
  • Light rail, streetcar or trolley: 138 (0.1%)
  • Taxi: 1,521 (1.5%)
  • Bicycle: 40 (0.0%)
  • Walked: 1,011 (1.0%)
  • Worked at home: 20,933 (20.6%)
Class of Workers in 2022
  • Unemployment by race in 2022
  • Unemployment rate for White non-Hispanic residents
  • 3.6%Males
  • 3.0%Females
  • Unemployment rate for Black residents
  • 8.9%Males
  • 5.7%Females
  • Unemployment rate for American Indian and Alaska Native residents
  • 24.6%Males
  • Unemployment rate for Asian residents
  • 0.8%Males
  • 2.5%Females
  • Unemployment rate for other race residents
  • 3.1%Females
  • Unemployment rate for two or more race residents
  • 9.3%Males
  • 4.6%Females
  • Unemployment rate for Hispanic or Latino residents
  • 3.8%Males
  • 6.3%Females
Year of entry for the foreign-born population in Sandy Springs, Georgia
  • Year of entry for the foreign-born population in Sandy Springs, Georgia
  • 6,9932010 or later
  • 5,1452000 to 2009
  • 3,4181990 to 1999
  • 2,2011980 to 1989
  • 1,2551970 to 1979
  • 877Before 1970
Ancestries in Sandy Springs, GA

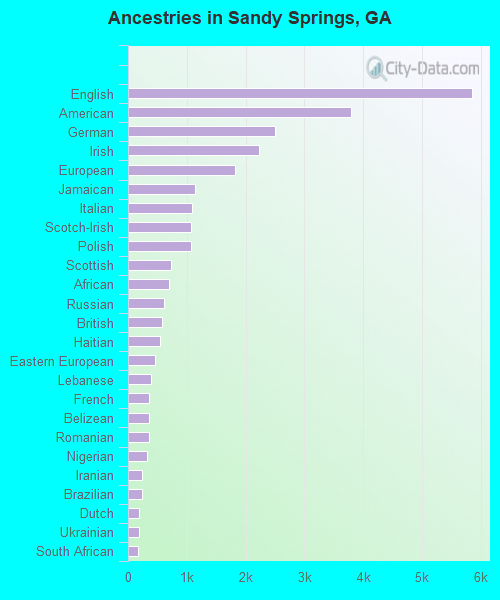
First ancestries reported:

  • English: 5,850 (10.3%)
  • American: 3,794 (6.7%)
  • German: 2,501 (4.4%)
  • Irish: 2,237 (3.9%)
  • European: 1,829 (3.2%)
  • Jamaican: 1,133 (2.0%)
  • Italian: 1,090 (1.9%)
  • Scotch-Irish: 1,077 (1.9%)
  • Polish: 1,074 (1.9%)
  • Scottish: 735 (1.3%)
  • African: 698 (1.2%)
  • Russian: 611 (1.1%)
  • British: 574 (1.0%)
  • Haitian: 542 (1.0%)
  • Eastern European: 457 (0.8%)
  • Lebanese: 386 (0.7%)
  • French: 365 (0.6%)
  • Belizean: 361 (0.6%)
  • Romanian: 357 (0.6%)
  • Nigerian: 318 (0.6%)
  • Iranian: 239 (0.4%)
  • Brazilian: 234 (0.4%)
  • Dutch: 186 (0.3%)
  • Ukrainian: 181 (0.3%)
  • South African: 178 (0.3%)
  • Zimbabwean: 177 (0.3%)
  • Lithuanian: 169 (0.3%)
  • Norwegian: 150 (0.3%)
  • Trinidadian and Tobagonian: 142 (0.2%)
  • Canadian: 137 (0.2%)
  • Ethiopian: 128 (0.2%)
  • Greek: 126 (0.2%)
  • Maltese: 126 (0.2%)
  • Hungarian: 124 (0.2%)
  • Welsh: 122 (0.2%)
  • Northern European: 112 (0.2%)
  • Israeli: 102 (0.2%)
  • Swedish: 98 (0.2%)
  • Kenyan: 95 (0.2%)
  • Armenian: 86 (0.2%)
  • Turkish: 78 (0.1%)
  • Czech: 78 (0.1%)
  • Scandinavian: 78 (0.1%)
  • Danish: 72 (0.1%)
  • Austrian: 65 (0.1%)
  • West Indian: 53 (0.09%)
  • Senegalese: 51 (0.09%)
  • Finnish: 50 (0.09%)
  • Ghanaian: 46 (0.08%)
  • Portuguese: 43 (0.08%)
  • Swiss: 38 (0.07%)
  • Moroccan: 36 (0.06%)
  • Palestinian: 34 (0.06%)
  • Australian: 34 (0.06%)
  • Serbian: 28 (0.05%)
  • Luxembourger: 28 (0.05%)
  • Jordanian: 27 (0.05%)
  • Czechoslovakian: 26 (0.05%)
  • Yugoslavian: 21 (0.04%)
  • Guyanese: 18 (0.03%)
  • French Canadian: 17 (0.03%)
  • Slovak: 15 (0.03%)
  • Iraqi: 13 (0.02%)
  • Macedonian: 13 (0.02%)
  • Belgian: 13 (0.02%)
  • New Zealander: 11 (0.02%)
  • British West Indian: 11 (0.02%)
  • Croatian: 8 (0.01%)
  • Latvian: 7 (0.01%)
  • Cajun: 7 (0.01%)
  • Assyrian: 6 (0.01%)
  • Afghan: 3 (0.01%)

Most common places of birth for foreign-born residents (%):

India
Sandy Springs:

17.2% (3,256)
Georgia:

9.2% (103,325)

Mexico
Sandy Springs:

9.2% (1,744)
Georgia:

20.0% (223,400)

South Africa
Sandy Springs:

5.9% (1,119)
Georgia:

0.5% (6,116)

China, excluding Hong Kong and Taiwan
Sandy Springs:

4.4% (828)
Georgia:

3.5% (39,227)

Brazil
Sandy Springs:

3.6% (684)
Georgia:

1.6% (18,211)

Venezuela
Sandy Springs:

3.4% (644)
Georgia:

1.7% (19,012)

Vietnam
Sandy Springs:

3.4% (642)
Georgia:

4.1% (45,797)

Jamaica
Sandy Springs:

3.4% (639)
Georgia:

4.6% (51,270)

Haiti
Sandy Springs:

2.5% (471)
Georgia:

1.6% (17,476)

Philippines
Sandy Springs:

2.2% (426)
Georgia:

1.8% (20,700)

United Kingdom, excluding England and Scotland
Sandy Springs:

2.1% (399)
Georgia:

0.8% (9,101)

Colombia
Sandy Springs:

2.1% (398)
Georgia:

2.1% (23,813)

Germany
Sandy Springs:

1.9% (366)
Georgia:

1.7% (18,651)

Nigeria
Sandy Springs:

1.8% (347)
Georgia:

2.5% (27,846)

Israel
Sandy Springs:

1.8% (345)
Georgia:

0.2% (2,671)

Romania
Sandy Springs:

1.8% (340)
Georgia:

0.6% (6,388)

Korea
Sandy Springs:

1.8% (340)
Georgia:

3.9% (43,756)

Place of birth for U.S.-born residents:

  • This state: 35,900
  • Other state: 52,809
  • Northeast: 11,552
  • Midwest: 12,554
  • South: 23,974
  • West: 4,729

80.1% of Sandy Springs residents lived in the same house 1 years ago.
   Out of people who lived in different houses, 23.6% lived in this county.
   Out of people who lived in different counties, 29.9% lived in Georgia.


Sandy Springs:

80.1%
State average:

86.6%

Education attainment for males 25 years and older:

  • No schooling: 684
  • Nursery to 4th grade: 0
  • 5th and 6th grade: 342
  • 7th and 8th grade: 0
  • 9th grade: 206
  • 10th grade: 221
  • 11th grade: 0
  • 12th grade, no diploma: 55
  • High school graduate (or equivalency): 3,238
  • Less than 1 year of college: 757
  • Some college more than 1 year, no degree: 3,013
  • Associate degree: 2,196
  • Bachelor's degree: 15,353
  • Master's degree: 8,058
  • Professional school degree: 2,889
  • Doctorate degree: 1,048
Educational Attainment for Males

Education attainment for females 25 years and older:

  • No schooling: 632
  • Nursery to 4th grade: 0
  • 5th and 6th grade: 174
  • 7th and 8th grade: 0
  • 9th grade: 332
  • 10th grade: 260
  • 11th grade: 77
  • 12th grade, no diploma: 109
  • High school graduate (or equivalency): 2,986
  • Less than 1 year of college: 1,120
  • Some college more than 1 year, no degree: 4,368
  • Associate degree: 2,955
  • Bachelor's degree: 17,777
  • Master's degree: 8,121
  • Professional school degree: 2,562
  • Doctorate degree: 887
Educational Attainment for Females
Sandy Springs marital status for males
Sandy Springs marital status for females

Housing units in structures:

  • One, detached: 19,220
  • One, attached: 6,758
  • Two: 80
  • 3 or 4: 2,528
  • 5 to 9: 4,870
  • 10 to 19: 5,878
  • 20 to 49: 2,371
  • 50 or more: 11,637
  • Mobile homes: 442
Housing units lacking complete plumbing facilities in 2022: 0.1%

Housing units lacking complete kitchen facilities in 2022: 0.4%

House/condo owner moved in on average 9 years ago

Renter moved in on average 0 years ago

Year householders moved into residence in Sandy Springs
Houses and condos Apartments
Most commonly used house heating fuel in houses and condos in Sandy Springs, GA
  • 66.1%Utility gas
  • 31.8%Electricity
  • 1.6%Bottled, tank, or LP gas
  • 0.5%Other fuel
Most commonly used house heating fuel in apartments in Sandy Springs, GA
  • 60.4%Electricity
  • 35.8%Utility gas
  • 2.7%Bottled, tank, or LP gas
  • 1.0%No fuel used

Private vs. public school enrollment:

Students in private schools in grades 1 to 8 (elementary and middle school): 2,902
Here:

30.1%
Georgia:

12.1%

Students in private schools in grades 9 to 12 (high school): 1,381
Here:

34.7%
Georgia:

10.8%

Students in private undergraduate colleges: 527
Here:

17.2%
Georgia:

17.1%
School Enrollment by Level of School for Male Students
School Enrollment by Level of School for Female Students
Age and Sex of Sensory-Disabled Noninstitutionalized Residents
Age and Sex of Physically-Disabled Noninstitutionalized Residents
Age and Sex of Mentally-Disabled Noninstitutionalized Residents
Age and Sex of Self-Care Disabled Noninstitutionalized Residents
Age and Sex of Go-Outside-Home Disabled Noninstitutionalized Residents
Age and Sex of Noninstitutionalized Residents with Employment Disability