Races in Sandy Springs, Georgia (GA) Detailed Stats
Data:
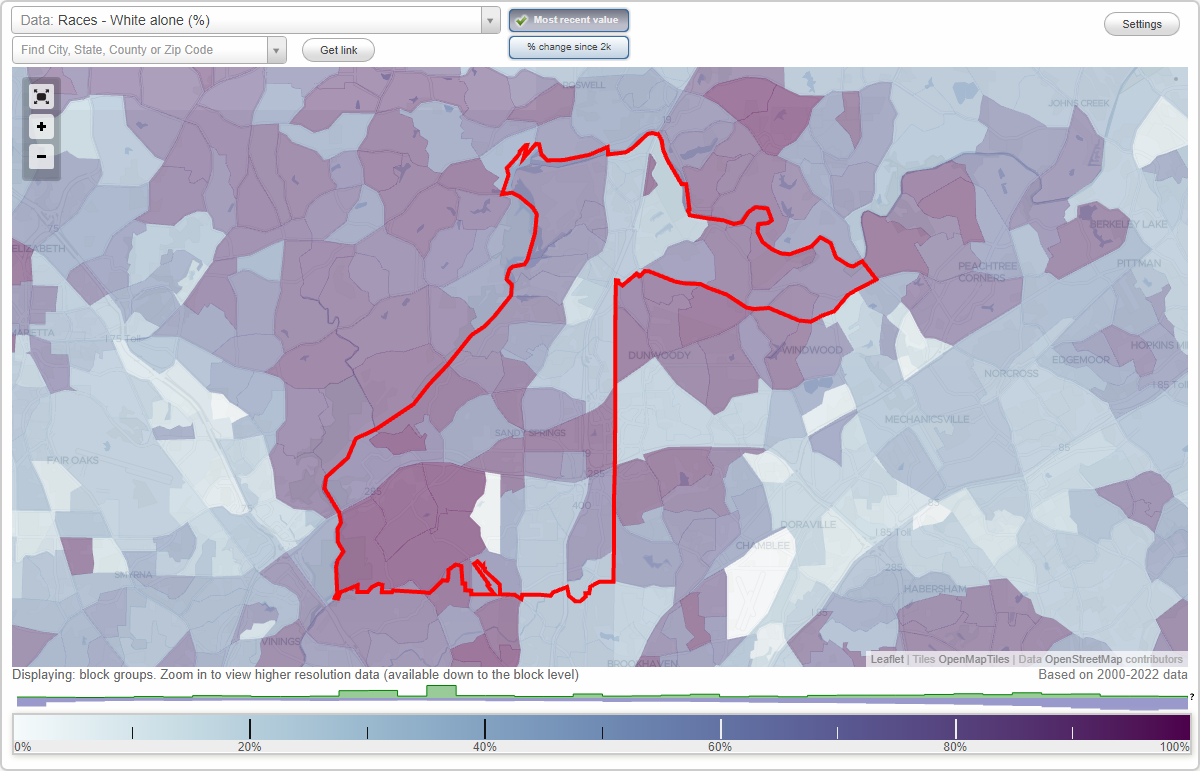
Races - White alone (%)
Races - White alone (% change since 2000)
Races - Black alone (%)
Races - Black alone (% change since 2000)
Races - American Indian alone (%)
Races - American Indian alone (% change since 2000)
Races - Asian alone (%)
Races - Asian alone (% change since 2000)
Races - Hispanic (%)
Races - Hispanic (% change since 2000)
Races - Native Hawaiian and Other Pacific Islander alone (%)
Races - Native Hawaiian and Other Pacific Islander alone (% change since 2000)
Races - Two or more races(%)
Races - Two or more races(% change since 2000)
Races - Other race alone (%)
Races - Other race alone (% change since 2000)
Racial diversity
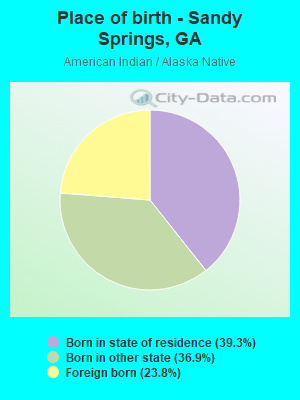
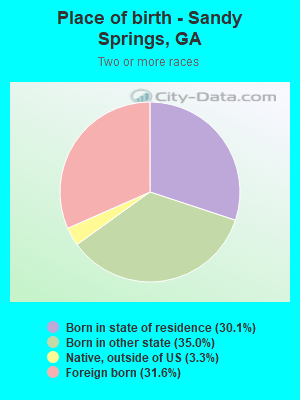
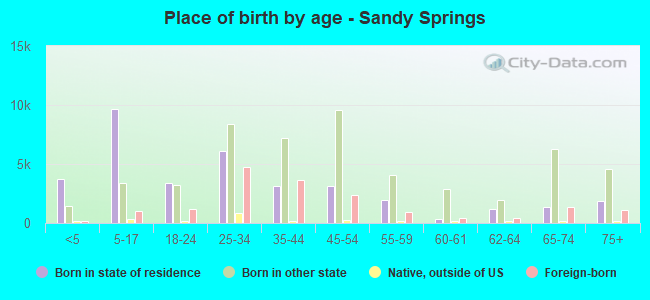
Place of birth - Born in state of residence (%)
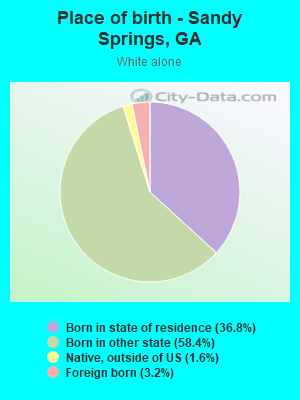
Place of birth - Born in state of residence (%) - White
Place of birth - Born in state of residence (%) - Black or African American
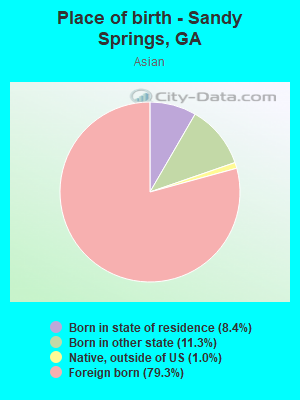
Place of birth - Born in state of residence (%) - Asian
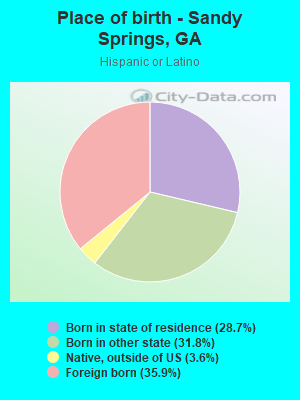
Place of birth - Born in state of residence (%) - Hispanic or Latino
Place of birth - Born in state of residence (%) - American Indian and Alaska Native
Place of birth - Born in state of residence (%) - Multirace
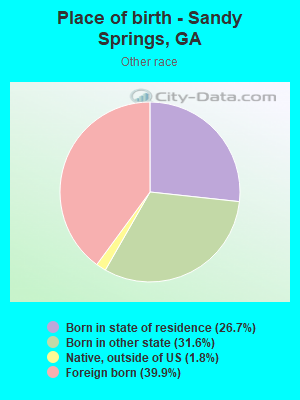
Place of birth - Born in state of residence (%) - Other Race
Place of birth - Born in other state (%)
Place of birth - Born in other state (%) - White
Place of birth - Born in other state (%) - Black or African American
Place of birth - Born in other state (%) - Asian
Place of birth - Born in other state (%) - Hispanic or Latino
Place of birth - Born in other state (%) - American Indian and Alaska Native
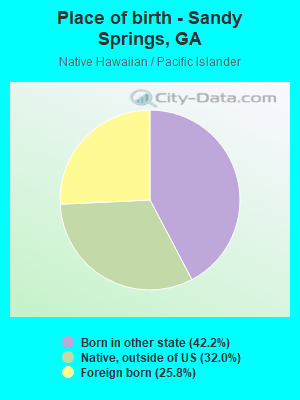
Place of birth - Born in other state (%) - Multirace
Place of birth - Born in other state (%) - Other Race
Place of birth - Native, outside of US (%)
Place of birth - Native, outside of US (%) - White
Place of birth - Native, outside of US (%) - Black or African American
Place of birth - Native, outside of US (%) - Asian
Place of birth - Native, outside of US (%) - Hispanic or Latino
Place of birth - Native, outside of US (%) - American Indian and Alaska Native
Place of birth - Native, outside of US (%) - Multirace
Place of birth - Native, outside of US (%) - Other Race
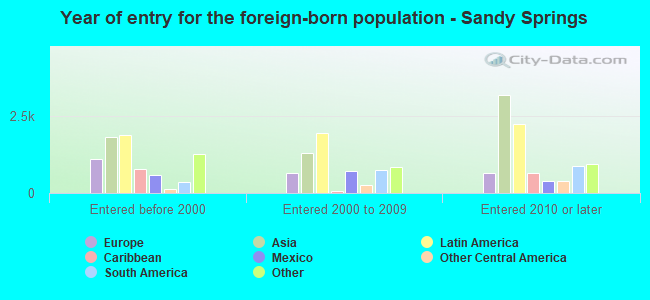
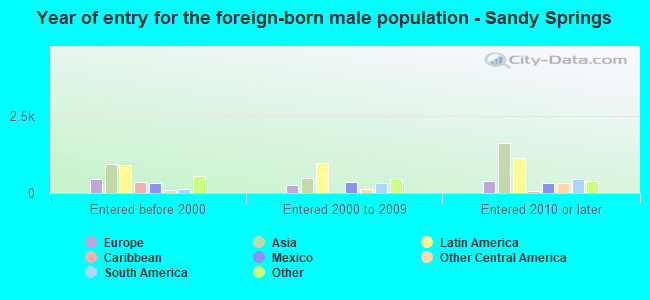
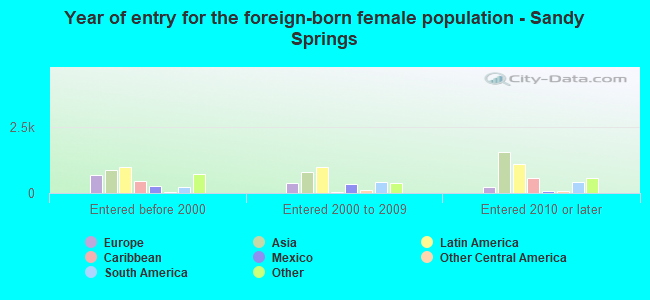
Place of birth - Foreign born (%)
Place of birth - Foreign born (%) - White
Place of birth - Foreign born (%) - Black or African American
Place of birth - Foreign born (%) - Asian
Place of birth - Foreign born (%) - Hispanic or Latino
Place of birth - Foreign born (%) - American Indian and Alaska Native
Place of birth - Foreign born (%) - Multirace
Place of birth - Foreign born (%) - Other Race
Residents speaking English at home (%)
Residents speaking English at home - Born in the United States (%)
Residents speaking English at home - Native, born elsewhere (%)
Residents speaking English at home - Foreign born (%)
Residents speaking Spanish at home (%)
Residents speaking Spanish at home - Born in the United States (%)
Residents speaking Spanish at home - Native, born elsewhere (%)
Residents speaking Spanish at home - Foreign born (%)
Residents speaking other language at home (%)
Residents speaking other language at home - Born in the United States (%)
Residents speaking other language at home - Native, born elsewhere (%)
Residents speaking other language at home - Foreign born (%)
Marital status - Never married (%)
Marital status - Now married (%)
Marital status - Separated (%)
Marital status - Widowed (%)
Marital status - Divorced (%)
Ancestries Reported - Arab (%)
Ancestries Reported - Czech (%)
Ancestries Reported - Danish (%)
Ancestries Reported - Dutch (%)
Ancestries Reported - English (%)
Ancestries Reported - French (%)
Ancestries Reported - French Canadian (%)
Ancestries Reported - German (%)
Ancestries Reported - Greek (%)
Ancestries Reported - Hungarian (%)
Ancestries Reported - Irish (%)
Ancestries Reported - Italian (%)
Ancestries Reported - Lithuanian (%)
Ancestries Reported - Norwegian (%)
Ancestries Reported - Polish (%)
Ancestries Reported - Portuguese (%)
Ancestries Reported - Russian (%)
Ancestries Reported - Scotch-Irish (%)
Ancestries Reported - Scottish (%)
Ancestries Reported - Slovak (%)
Ancestries Reported - Subsaharan African (%)
Ancestries Reported - Swedish (%)
Ancestries Reported - Swiss (%)
Ancestries Reported - Ukrainian (%)
Ancestries Reported - United States (%)
Ancestries Reported - Welsh (%)
Ancestries Reported - West Indian (%)
Ancestries Reported - Other (%)
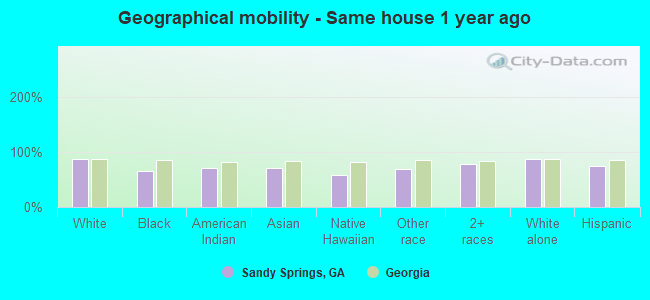
Geographical mobility - Same house 1 year ago (%)
Geographical mobility - Same house 1 year ago (%) - White
Geographical mobility - Same house 1 year ago (%) - Black or African American
Geographical mobility - Same house 1 year ago (%) - Asian
Geographical mobility - Same house 1 year ago (%) - Hispanic or Latino
Geographical mobility - Same house 1 year ago (%) - American Indian and Alaska Native
Geographical mobility - Same house 1 year ago (%) - Multirace
Geographical mobility - Same house 1 year ago (%) - Other Race
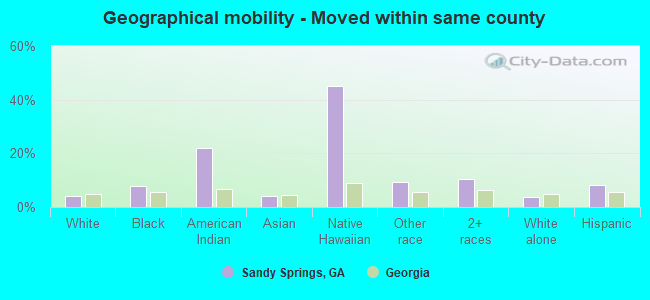
Geographical mobility - Moved within same county (%)
Geographical mobility - Moved within same county (%) - White
Geographical mobility - Moved within same county (%) - Black or African American
Geographical mobility - Moved within same county (%) - Asian
Geographical mobility - Moved within same county (%) - Hispanic or Latino
Geographical mobility - Moved within same county (%) - American Indian and Alaska Native
Geographical mobility - Moved within same county (%) - Multirace
Geographical mobility - Moved within same county (%) - Other Race
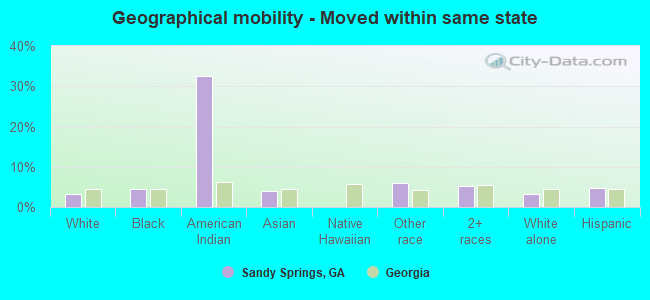
Geographical mobility - Moved from different county within same state (%)
Geographical mobility - Moved from different county within same state (%) - White
Geographical mobility - Moved from different county within same state (%) - Black or African American
Geographical mobility - Moved from different county within same state (%) - Asian
Geographical mobility - Moved from different county within same state (%) - Hispanic or Latino
Geographical mobility - Moved from different county within same state (%) - American Indian and Alaska Native
Geographical mobility - Moved from different county within same state (%) - Multirace
Geographical mobility - Moved from different county within same state (%) - Other Race
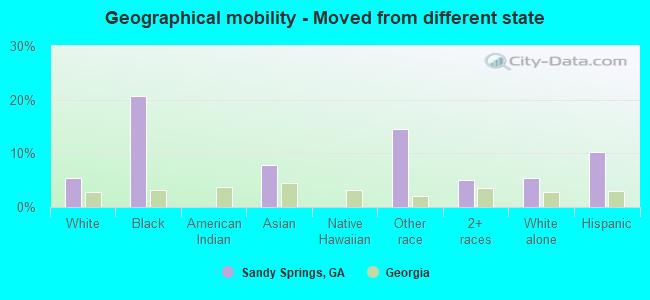
Geographical mobility - Moved from different state (%)
Geographical mobility - Moved from different state (%) - White
Geographical mobility - Moved from different state (%) - Black or African American
Geographical mobility - Moved from different state (%) - Asian
Geographical mobility - Moved from different state (%) - Hispanic or Latino
Geographical mobility - Moved from different state (%) - American Indian and Alaska Native
Geographical mobility - Moved from different state (%) - Multirace
Geographical mobility - Moved from different state (%) - Other Race
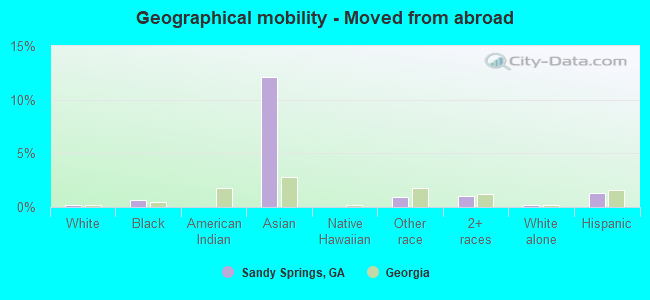
Geographical mobility - Moved from abroad (%)
Geographical mobility - Moved from abroad (%) - White
Geographical mobility - Moved from abroad (%) - Black or African American
Geographical mobility - Moved from abroad (%) - Asian
Geographical mobility - Moved from abroad (%) - Hispanic or Latino
Geographical mobility - Moved from abroad (%) - American Indian and Alaska Native
Geographical mobility - Moved from abroad (%) - Multirace
Geographical mobility - Moved from abroad (%) - Other Race
Place of birth for the foreign-born population - Ireland (%)
Place of birth for the foreign-born population - Denmark (%)
Place of birth for the foreign-born population - Norway (%)
Place of birth for the foreign-born population - Sweden (%)
Place of birth for the foreign-born population - United Kingdom (%)
Place of birth for the foreign-born population - England (%)
Place of birth for the foreign-born population - Scotland (%)
Place of birth for the foreign-born population - Other Northern Europe (%)
Place of birth for the foreign-born population - Austria (%)
Place of birth for the foreign-born population - Belgium (%)
Place of birth for the foreign-born population - France (%)
Place of birth for the foreign-born population - Germany (%)
Place of birth for the foreign-born population - Netherlands (%)
Place of birth for the foreign-born population - Switzerland (%)
Place of birth for the foreign-born population - Other Western Europe (%)
Place of birth for the foreign-born population - Greece (%)
Place of birth for the foreign-born population - Italy (%)
Place of birth for the foreign-born population - Portugal (%)
Place of birth for the foreign-born population - Spain (%)
Place of birth for the foreign-born population - Other Southern Europe (%)
Place of birth for the foreign-born population - Albania (%)
Place of birth for the foreign-born population - Belarus (%)
Place of birth for the foreign-born population - Bosnia and Herzegovina (%)
Place of birth for the foreign-born population - Bulgaria (%)
Place of birth for the foreign-born population - Croatia (%)
Place of birth for the foreign-born population - Czechoslovakia (%)
Place of birth for the foreign-born population - Hungary (%)
Place of birth for the foreign-born population - Latvia (%)
Place of birth for the foreign-born population - Lithuania (%)
Place of birth for the foreign-born population - North Macedonia (Macedonia) (%)
Place of birth for the foreign-born population - Moldova (%)
Place of birth for the foreign-born population - Poland (%)
Place of birth for the foreign-born population - Romania (%)
Place of birth for the foreign-born population - Russia (%)
Place of birth for the foreign-born population - Serbia (%)
Place of birth for the foreign-born population - Ukraine (%)
Place of birth for the foreign-born population - Other Eastern Europe (%)
Place of birth for the foreign-born population - China (%)
Place of birth for the foreign-born population - Hong Kong (%)
Place of birth for the foreign-born population - Taiwan (%)
Place of birth for the foreign-born population - Japan (%)
Place of birth for the foreign-born population - Korea (%)
Place of birth for the foreign-born population - Other Eastern Asia (%)
Place of birth for the foreign-born population - Afghanistan (%)
Place of birth for the foreign-born population - Bangladesh (%)
Place of birth for the foreign-born population - India (%)
Place of birth for the foreign-born population - Iran (%)
Place of birth for the foreign-born population - Kazakhstan (%)
Place of birth for the foreign-born population - Nepal (%)
Place of birth for the foreign-born population - Pakistan (%)
Place of birth for the foreign-born population - Sri Lanka (%)
Place of birth for the foreign-born population - Uzbekistan (%)
Place of birth for the foreign-born population - Other South Central Asia (%)
Place of birth for the foreign-born population - Burma (%)
Place of birth for the foreign-born population - Cambodia (%)
Place of birth for the foreign-born population - Indonesia (%)
Place of birth for the foreign-born population - Laos (%)
Place of birth for the foreign-born population - Malaysia (%)
Place of birth for the foreign-born population - Philippines (%)
Place of birth for the foreign-born population - Singapore (%)
Place of birth for the foreign-born population - Thailand (%)
Place of birth for the foreign-born population - Vietnam (%)
Place of birth for the foreign-born population - Other South Eastern Asia (%)
Place of birth for the foreign-born population - Armenia (%)
Place of birth for the foreign-born population - Iraq (%)
Place of birth for the foreign-born population - Israel (%)
Place of birth for the foreign-born population - Jordan (%)
Place of birth for the foreign-born population - Kuwait (%)
Place of birth for the foreign-born population - Lebanon (%)
Place of birth for the foreign-born population - Saudi Arabia (%)
Place of birth for the foreign-born population - Syria (%)
Place of birth for the foreign-born population - Turkey (%)
Place of birth for the foreign-born population - Yemen (%)
Place of birth for the foreign-born population - Other Western Asia (%)
Place of birth for the foreign-born population - Eritrea (%)
Place of birth for the foreign-born population - Ethiopia (%)
Place of birth for the foreign-born population - Kenya (%)
Place of birth for the foreign-born population - Somalia (%)
Place of birth for the foreign-born population - Uganda (%)
Place of birth for the foreign-born population - Zimbabwe (%)
Place of birth for the foreign-born population - Other Eastern Africa (%)
Place of birth for the foreign-born population - Cameroon (%)
Place of birth for the foreign-born population - Congo (%)
Place of birth for the foreign-born population - Democratic Republic of Congo (Zaire) (%)
Place of birth for the foreign-born population - Other Middle Africa (%)
Place of birth for the foreign-born population - Egypt (%)
Place of birth for the foreign-born population - Morocco (%)
Place of birth for the foreign-born population - Sudan (%)
Place of birth for the foreign-born population - Other Northern Africa (%)
Place of birth for the foreign-born population - South Africa (%)
Place of birth for the foreign-born population - Other Southern Africa (%)
Place of birth for the foreign-born population - Cabo Verde (%)
Place of birth for the foreign-born population - Ghana (%)
Place of birth for the foreign-born population - Liberia (%)
Place of birth for the foreign-born population - Nigeria (%)
Place of birth for the foreign-born population - Senegal (%)
Place of birth for the foreign-born population - Sierra Leone (%)
Place of birth for the foreign-born population - Other Western Africa (%)
Place of birth for the foreign-born population - Australia (%)
Place of birth for the foreign-born population - New Zealand (%)
Place of birth for the foreign-born population - Fiji (%)
Place of birth for the foreign-born population - Micronesia (%)
Place of birth for the foreign-born population - Bahamas (%)
Place of birth for the foreign-born population - Barbados (%)
Place of birth for the foreign-born population - Cuba (%)
Place of birth for the foreign-born population - Dominica (%)
Place of birth for the foreign-born population - Dominican Republic (%)
Place of birth for the foreign-born population - Grenada (%)
Place of birth for the foreign-born population - Haiti (%)
Place of birth for the foreign-born population - Jamaica (%)
Place of birth for the foreign-born population - St. Vincent and the Grenadines (%)
Place of birth for the foreign-born population - Trinidad and Tobago (%)
Place of birth for the foreign-born population - West Indies (%)
Place of birth for the foreign-born population - Other Caribbean (%)
Place of birth for the foreign-born population - Belize (%)
Place of birth for the foreign-born population - Costa Rica (%)
Place of birth for the foreign-born population - El Salvador (%)
Place of birth for the foreign-born population - Guatemala (%)
Place of birth for the foreign-born population - Honduras (%)
Place of birth for the foreign-born population - Mexico (%)
Place of birth for the foreign-born population - Nicaragua (%)
Place of birth for the foreign-born population - Panama (%)
Place of birth for the foreign-born population - Other Central America (%)
Place of birth for the foreign-born population - Argentina (%)
Place of birth for the foreign-born population - Bolivia (%)
Place of birth for the foreign-born population - Brazil (%)
Place of birth for the foreign-born population - Chile (%)
Place of birth for the foreign-born population - Colombia (%)
Place of birth for the foreign-born population - Ecuador (%)
Place of birth for the foreign-born population - Guyana (%)
Place of birth for the foreign-born population - Peru (%)
Place of birth for the foreign-born population - Uruguay (%)
Place of birth for the foreign-born population - Venezuela (%)
Place of birth for the foreign-born population - Other South America (%)
Place of birth for the foreign-born population - Canada (%)
Place of birth for the foreign-born population - Other Northern America (%)
Place of birth for the foreign-born population - Other (%)
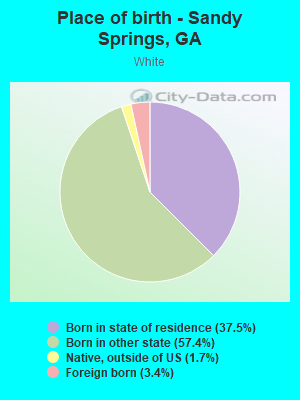
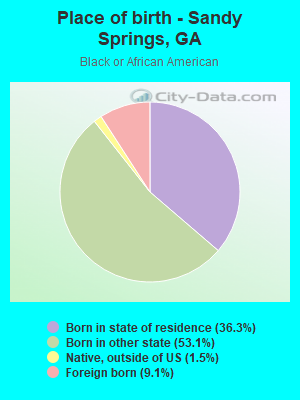
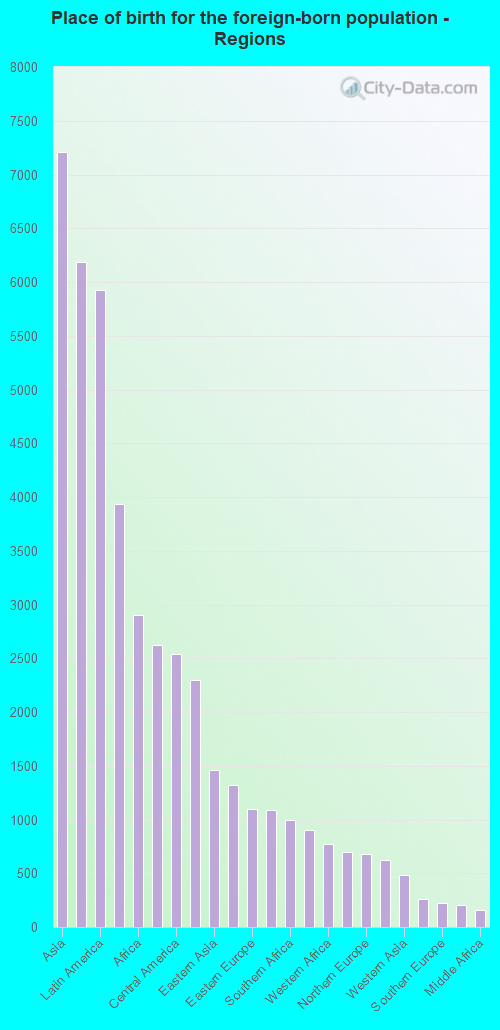
According to 2022 data, the most numerous races in Sandy Springs, GA are White alone (60,425 residents), Black alone (18,973 residents), and Hispanic (12,608 residents). 80.6% of Sandy Springs residents speak English at home. 17.5% of Sandy Springs, GA residents are foreign-born (6.4% born in Asia, 5.3% born in Latin America, 2.6% born in Africa, 2.3% born in Europe), which is 42.8% greater than the foreign-born rate of 10.0% across the entire state of Georgia.
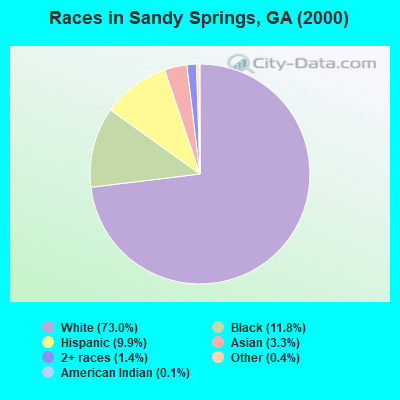
Race distribution in Sandy Springs
2000 2022
62,657 73.0% White alone 10,139 11.8% Black alone 8,514 9.9% Hispanic 2,793 3.3% Asian alone 1,212 1.4% Two or more races 327 0.4% Other race alone 99 0.1% American Indian alone 40 0.05% Native Hawaiian and Other
60,425 56.1% White alone 18,973 17.6% Black alone 12,608 11.7% Hispanic 9,106 8.4% Asian alone 5,227 4.9% Two or more races 1,164 1.1% Other race alone 174 0.2% American Indian alone 90 0.08% Native Hawaiian and Other
2000 2022
5,128,661 62.6% White alone 2,331,465 28.5% Black alone 435,227 5.3% Hispanic 171,513 2.1% Asian alone 87,364 1.1% Two or more races 17,670 0.2% American Indian alone 11,275 0.1% Other race alone 3,278 0.04% Native Hawaiian and Other
5,415,657 49.6% White alone 3,349,240 30.7% Black alone 1,132,604 10.4% Hispanic 479,156 4.4% Asian alone 462,923 4.2% Two or more races 54,416 0.5% Other race alone 11,923 0.1% American Indian alone 6,957 0.06% Native Hawaiian and Other
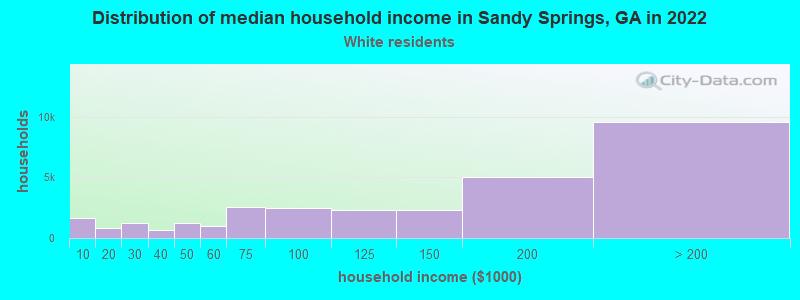
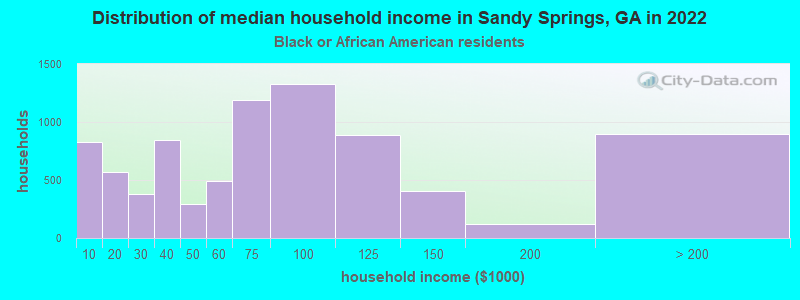
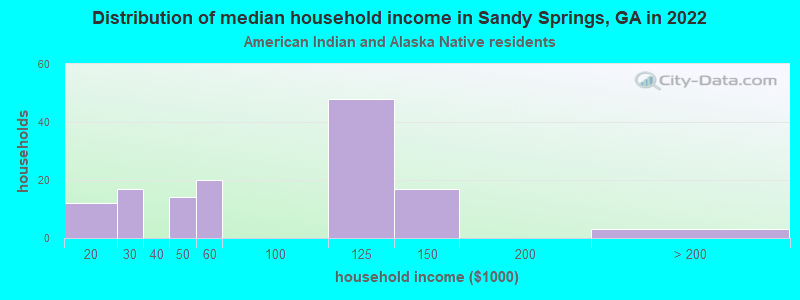
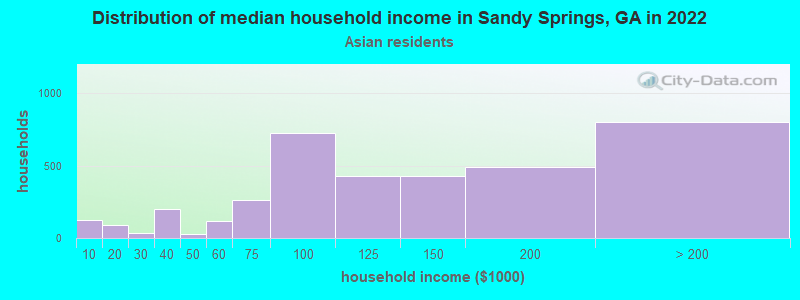
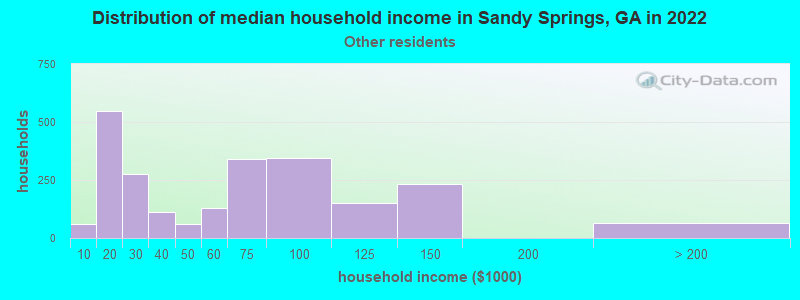
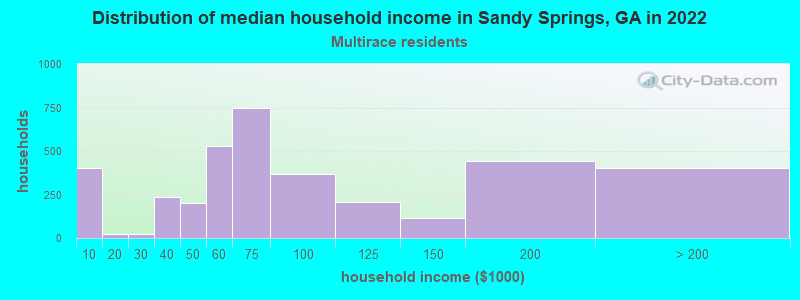
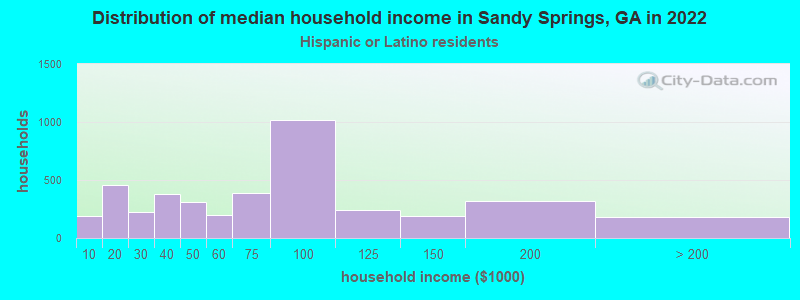
Income and house value in Sandy Springs Median household income in 2022 $141,283 White non-Hispanic householders$67,968 Black householders$103,777 American Indian and Alaska Native householders$105,327 Asian householders$49,801 Some other race householders$74,910 Two or more races householders$71,601 Hispanic or Latino race householdersMedian 2022 house value $715,147 White Non-Hispanic householders$380,960 Black or African American householders$266,487 American Indian or Alaska Native householders $661,603 Asian householders$461,584 Native Hawaiian and other Pacific Islander householders$685,811 Some other race householders$673,707 Two or more races householders$508,563 Hispanic or Latino householders
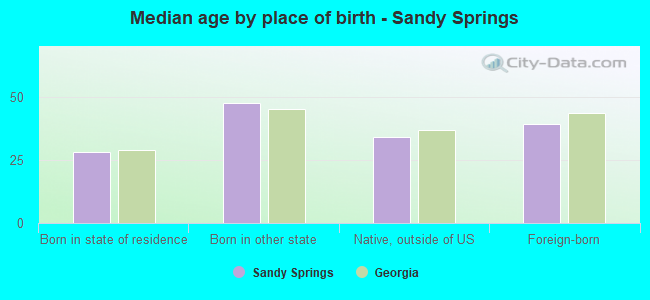
Median age by race in Sandy Springs
46.8 Median age for White residents44.2 48.9 36.3 Median age for Black or African American residents37.4 34.6 34.8 Median age for American Indian / Alaska Native residents28.6 -666,666,666.0 31.7 Median age for Asian residents31.3 32.6 -666,666,666.0 Median age for Native Hawaiian / Pacific Islander residents-666,666,666.0 -666,666,666.0 27.7 Median age for Other race residents30.1 26.6 32.7 Median age for Two or more races residents32.4 33.4 47.1 Median age for White alone residents44.0 51.0 28.2 Median age for Hispanic or Latino residents28.9 27.4
Owner/renter occupied households by race in Sandy Springs
House owners and renters - White residents 21,627 70.3% Owner occupied9,132 29.7% Renter occupiedHouse owners and renters - Black or African American residents 2,609 31.7% Owner occupied5,630 68.3% Renter occupiedHouse owners and renters - American Indian / Alaska Native residents 47 48.2% Owner occupied51 51.8% Renter occupiedHouse owners and renters - Asian residents 1,666 40.0% Owner occupied2,494 60.0% Renter occupiedHouse owners and renters - Native Hawaiian / Pacific Islander residents 20 100.0% Renter occupiedHouse owners and renters - Other race residents 333 12.4% Owner occupied2,356 87.6% Renter occupiedHouse owners and renters - Two or more races residents 1,610 38.6% Owner occupied2,556 61.4% Renter occupiedHouse owners and renters - White alone residents 21,000 70.4% Owner occupied8,840 29.6% Renter occupiedHouse owners and renters - Hispanic or Latino residents 1,253 26.7% Owner occupied3,435 73.3% Renter occupied
Language usage in Sandy Springs
English speakers - Total 80.6% of residents of Sandy Springs speak English at home.
7.6% of residents speak Spanish at home 4,108 52.5% Speak English very well3,720 47.5% Speak English less than very well11.7% of residents speak other language at home 9,081 75.5% Speak English very well2,950 24.5% Speak English less than very well
English speakers - Born in the United States 93.1% of residents of Sandy Springs speak English at home.
2.8% of residents speak Spanish at home 1,251 85.6% Speak English very well210 14.4% Speak English less than very well4.0% of residents speak other language at home 1,858 89.8% Speak English very well211 10.2% Speak English less than very well
English speakers - Native, born elsewhere 75.2% of residents of Sandy Springs speak English at home.
12.3% of residents speak Spanish at home 80 34.3% Speak English very well153 65.7% Speak English less than very well12.5% of residents speak other language at home 237 100.0% Speak English very well
English speakers - Foreign-born 26.0% of residents of Sandy Springs speak English at home.
22.9% of residents speak Spanish at home 1,789 45.6% Speak English very well2,136 54.4% Speak English less than very well51.2% of residents speak other language at home 6,121 69.7% Speak English very well2,661 30.3% Speak English less than very well
White (Caucasian) - Speak only English Native:
96.3% (55,100)Foreign-born:
50.1% (1,053)
White (Caucasian) - Speak another language Native:
3.7% (2,123)Foreign-born:
49.9% (1,049)
Black or African American - Speak only English Native:
98.2% (17,465)Foreign-born:
51.2% (1,984)
Black or African American - Speak another language Native:
1.8% (328)Foreign-born:
48.9% (1,897)
American Indian / Alaska Native - Speak only English Native:
53.8% (53)Foreign-born:
53.5% (18)
American Indian / Alaska Native - Speak another language Native:
48.0% (47)Foreign-born:
29.5% (10)
Asian - Speak only English Native:
44.7% (634)Foreign-born:
12.7% (915)
Asian - Speak another language Native:
55.3% (783)Foreign-born:
87.3% (6,302)
Native Hawaiian / Pacific Islander - Speak only English Native:
42.2% (15)Foreign-born:
92.1% (8)
Other race - Speak only English Native:
53.3% (2,148)Foreign-born:
9.4% (277)
Other race - Speak another language Native:
46.7% (1,879)Foreign-born:
90.6% (2,657)
Two or more races - Speak only English Native:
66.5% (3,755)Foreign-born:
27.5% (811)
Two or more races - Speak another language Native:
33.5% (1,892)Foreign-born:
72.5% (2,139)
White alone - Speak only English Native:
96.6% (53,900)Foreign-born:
54.3% (1,053)
White alone - Speak another language Native:
3.4% (1,888)Foreign-born:
45.7% (885)
Hispanic or Latino - Speak only English Native:
48.6% (3,372)Foreign-born:
13.2% (597)
Hispanic or Latino - Speak another language Native:
51.4% (3,563)Foreign-born:
86.8% (3,925)
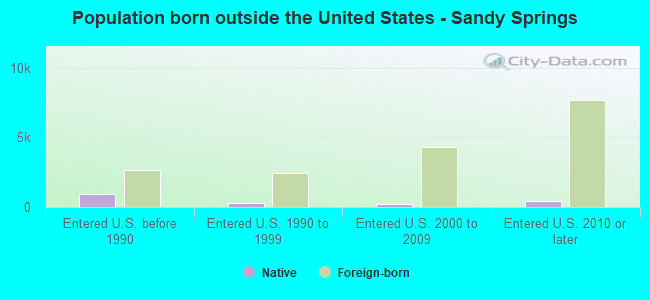
Foreign-born residents in Sandy Springs 18,965 residents are foreign born (6.4% Asia , 5.3% Latin America , 2.6% Africa , 2.3% Europe ).
This city:
17.5%Georgia:
10.4%
Marital status for residents in Sandy Springs Marital status - White (Caucasian) population 15 years and over
Males 26.2% Never married60.2% Now married2.0% Separated3.3% Widowed8.4% DivorcedFemales 25.6% Never married53.9% Now married0.2% Separated9.1% Widowed11.2% DivorcedWomen who gave birth in the past 12 months Now married:
94.5% (947)Unmarried:
5.5% (55)
Women who did not give birth in the past 12 months Now married:
47.2% (5,550)Unmarried:
52.8% (6,209)
Marital status - Black or African American population 15 years and over
Males 42.7% Never married39.4% Now married0.0% Separated0.6% Widowed17.3% DivorcedFemales 46.7% Never married28.0% Now married1.3% Separated5.7% Widowed18.3% DivorcedWomen who gave birth in the past 12 months Now married:
100.0% (376)Unmarried:
0.0% (0)
Women who did not give birth in the past 12 months Now married:
26.8% (1,710)Unmarried:
73.2% (4,665)
Marital status - American Indian / Alaska Native population 15 years and over
Males 44.3% Never married11.4% Now married0.0% Separated0.0% Widowed44.3% DivorcedFemales 54.4% Never married3.9% Now married11.7% Separated11.7% Widowed18.4% DivorcedWomen who gave birth in the past 12 months Now married:
100.0% (19)Unmarried:
0.0% (0)
Women who did not give birth in the past 12 months Now married:
5.1% (6)Unmarried:
94.9% (119)
Marital status - Asian population 15 years and over
Males 36.5% Never married62.6% Now married0.2% Separated0.4% Widowed0.3% DivorcedFemales 33.1% Never married56.9% Now married1.5% Separated1.6% Widowed6.9% DivorcedWomen who gave birth in the past 12 months Now married:
88.5% (131)Unmarried:
11.5% (17)
Women who did not give birth in the past 12 months Now married:
52.7% (1,312)Unmarried:
47.3% (1,176)
Marital status - Native Hawaiian / Pacific Islander population 15 years and over
Males 100.0% Never married0.0% Now married0.0% Separated0.0% Widowed0.0% DivorcedFemales 0.0% Never married100.0% Now married0.0% Separated0.0% Widowed0.0% DivorcedWomen who did not give birth in the past 12 months Now married:
100.0% (37)Unmarried:
0.0% (0)
Marital status - Other race population 15 years and over
Males 40.9% Never married43.1% Now married11.6% Separated0.0% Widowed4.4% DivorcedFemales 63.7% Never married16.4% Now married2.1% Separated14.6% Widowed3.2% DivorcedWomen who gave birth in the past 12 months Now married:
0.0% (0)Unmarried:
100.0% (53)
Women who did not give birth in the past 12 months Now married:
17.7% (383)Unmarried:
82.3% (1,786)
Marital status - Two or more races population 15 years and over
Males 40.7% Never married49.1% Now married0.0% Separated0.0% Widowed10.2% DivorcedFemales 35.4% Never married45.8% Now married0.0% Separated6.2% Widowed12.7% DivorcedWomen who gave birth in the past 12 months Now married:
100.0% (150)Unmarried:
0.0% (0)
Women who did not give birth in the past 12 months Now married:
35.6% (852)Unmarried:
64.4% (1,539)
Marital status - White alone, not Hispanic / Latino population 15 years and over
Males 26.0% Never married60.0% Now married2.0% Separated3.4% Widowed8.6% DivorcedFemales 25.7% Never married53.8% Now married0.0% Separated9.2% Widowed11.3% DivorcedWomen who gave birth in the past 12 months Now married:
94.5% (947)Unmarried:
5.5% (55)
Women who did not give birth in the past 12 months Now married:
46.0% (5,170)Unmarried:
54.0% (6,070)
Marital status - Hispanic or Latino population 15 years and over
Males 46.6% Never married44.4% Now married2.4% Separated2.2% Widowed4.3% DivorcedFemales 48.4% Never married36.0% Now married1.4% Separated8.4% Widowed5.8% DivorcedWomen who gave birth in the past 12 months Now married:
78.9% (122)Unmarried:
21.1% (33)
Women who did not give birth in the past 12 months Now married:
35.1% (1,160)Unmarried:
64.9% (2,150)
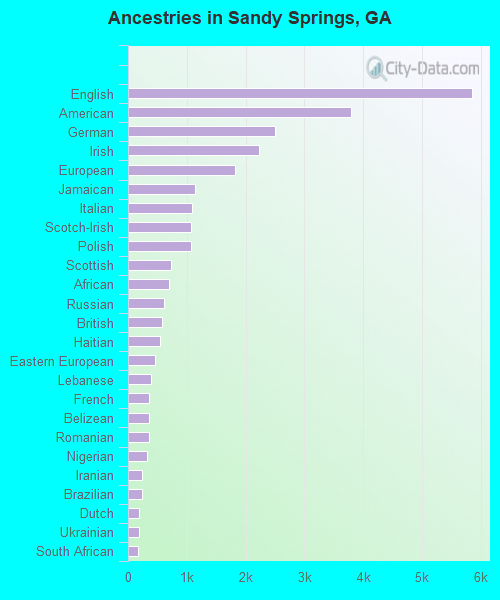
Ancestries in Sandy Springs
5,850 10.3% English3,794 6.7% American2,501 4.4% German2,237 3.9% Irish1,829 3.2% European1,133 2.0% Jamaican1,090 1.9% Italian1,077 1.9% Scotch-Irish1,074 1.9% Polish735 1.3% Scottish698 1.2% African611 1.1% Russian574 1.0% British542 1.0% Haitian457 0.8% Eastern European386 0.7% Lebanese365 0.6% French361 0.6% Belizean357 0.6% Romanian318 0.6% Nigerian239 0.4% Iranian234 0.4% Brazilian186 0.3% Dutch181 0.3% Ukrainian178 0.3% South African177 0.3% Zimbabwean169 0.3% Lithuanian150 0.3% Norwegian142 0.2% Trinidadian and Tobagonian137 0.2% Canadian128 0.2% Ethiopian126 0.2% Greek126 0.2% Maltese124 0.2% Hungarian122 0.2% Welsh112 0.2% Northern European102 0.2% Israeli98 0.2% Swedish95 0.2% Kenyan86 0.2% Armenian78 0.1% Turkish78 0.1% Czech78 0.1% Scandinavian72 0.1% Danish65 0.1% Austrian53 0.09% West Indian51 0.09% Senegalese50 0.09% Finnish46 0.08% Ghanaian43 0.08% Portuguese38 0.07% Swiss36 0.06% Moroccan34 0.06% Palestinian34 0.06% Australian28 0.05% Serbian28 0.05% Luxembourger27 0.05% Jordanian26 0.05% Czechoslovakian21 0.04% Yugoslavian18 0.03% Guyanese17 0.03% French Canadian15 0.03% Slovak13 0.02% Iraqi13 0.02% Macedonian13 0.02% Belgian11 0.02% New Zealander11 0.02% British West Indian8 0.01% Croatian7 0.01% Latvian7 0.01% Cajun6 0.01% Assyrian3 0.01% Afghan
Geographical mobility in Sandy Springs Same house 1 year ago 53,459 87.3% White (Caucasian)12,881 66.3% Black or African American104 71.5% American Indian / Alaska Native6,556 72.0% Asian27 58.6% Native Hawaiian / Pacific Islander5,042 69.2% Other race7,312 78.3% Two or more races52,197 87.5% White alone, not Hispanic / Latino9,525 75.5% Hispanic or LatinoMoved within same county 2,436 4.0% White / Caucasian1,542 7.9% Black or African American32 21.9% American Indian / Alaska Native380 4.2% Asian20 45.2% Native Hawaiian / Pacific Islander689 9.5% Other race975 10.4% Two or more races2,271 3.8% White alone, not Hispanic / Latino1,040 8.2% Hispanic or LatinoMoved within same state 1,973 3.2% White / Caucasian852 4.4% Black or African American47 32.4% American Indian / Alaska Native352 3.9% Asian426 5.8% Other race485 5.2% Two or more races1,860 3.1% White alone, not Hispanic / Latino588 4.7% Hispanic or LatinoMoved from different state 3,307 5.4% White / Caucasian4,024 20.7% Black or African American717 7.9% Asian1,061 14.6% Other race470 5.0% Two or more races3,248 5.4% White alone, not Hispanic / Latino1,296 10.3% Hispanic or LatinoMoved from abroad 89 0.1% White127 0.7% Black or African American1,101 12.1% Asian65 0.9% Other race94 1.0% Two or more races89 0.1% White alone, not Hispanic / Latino159 1.3% Hispanic or Latino
Children Nativity (place of birth) in Sandy Springs
Children under 6 years - Living with two parents Both parents native 3,440 100.0% NativeBoth parents foreign-born 701 81.4% Native160 18.6% Foreign-bornOne native, one foreign-born parent 901 100.0% NativeChildren under 6 years - Living with one parent Native parent 1,130 100.0% NativeForeign-born parent 306 98.0% Native6 2.0% Foreign-bornChildren 6 to 17 years - Living with two parents Both parents native 4,940 98.4% Native80 1.6% Foreign-bornBoth parents foreign-born 1,360 85.2% Native236 14.8% Foreign-bornOne native, one foreign-born parent 989 100.0% NativeChildren 6 to 17 years - Living with one parent Native parent 3,078 100.0% NativeForeign-born parent 1,500 61.2% Native950 38.8% Foreign-born
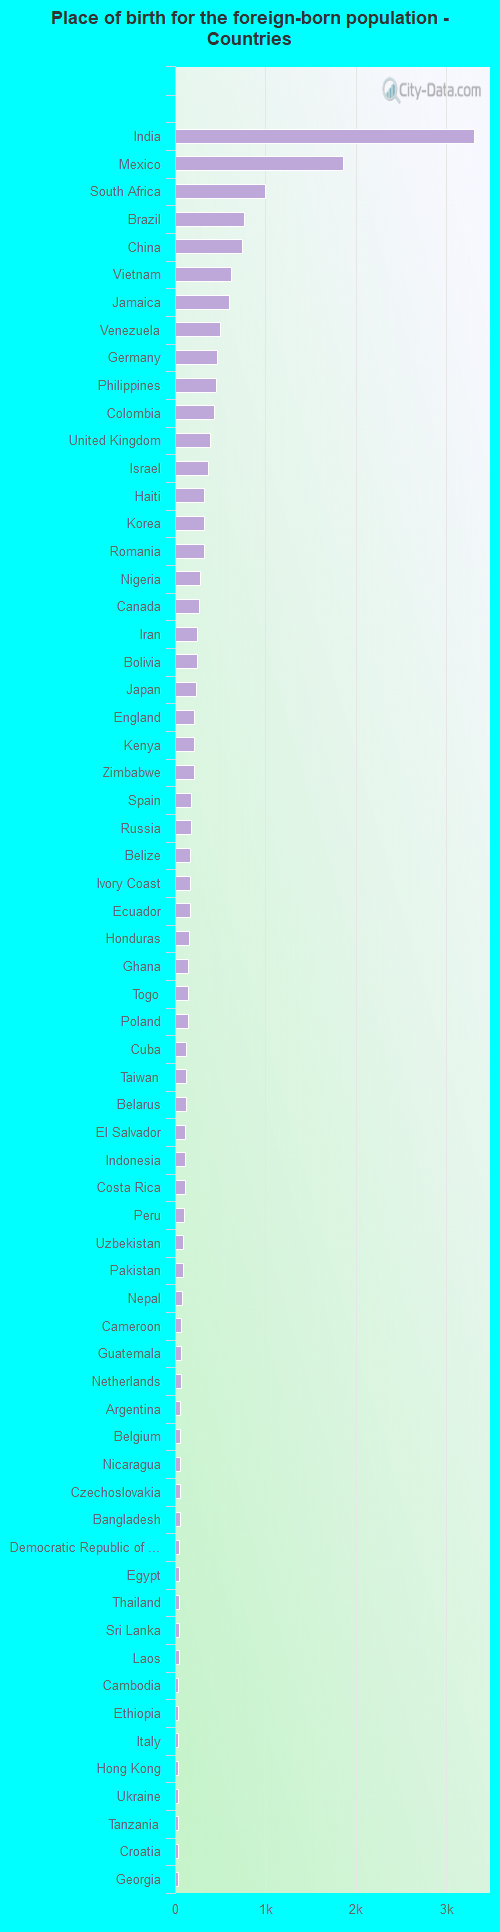
Place of birth for residents in Sandy Springs 7,207 Asia6,186 Americas5,922 Latin America3,934 South Central Asia2,906 Africa2,627 Europe2,536 Central America2,301 South America1,465 Eastern Asia1,325 South Eastern Asia1,097 Eastern Europe1,084 Caribbean997 Southern Africa902 China772 Western Africa698 Eastern Africa682 Northern Europe619 Western Europe482 Western Asia263 Northern America227 Southern Europe203 Northern Africa155 Middle Africa37 Oceania31 Australia and New Zealand Subregion3,307 India1,857 Mexico997 South Africa759 Brazil745 China622 Vietnam596 Jamaica499 Venezuela464 Germany448 Philippines434 Colombia391 United Kingdom362 Israel326 Haiti324 Korea322 Romania281 Nigeria263 Canada247 Iran247 Bolivia237 Japan214 England210 Kenya206 Zimbabwe182 Spain176 Russia164 Belize161 Ivory Coast161 Ecuador152 Honduras143 Ghana140 Togo139 Poland126 Cuba126 Taiwan117 Belarus115 El Salvador112 Indonesia108 Costa Rica102 Peru89 Uzbekistan83 Pakistan82 Nepal66 Cameroon66 Guatemala61 Netherlands59 Argentina58 Belgium58 Nicaragua57 Czechoslovakia57 Bangladesh46 Democratic Republic of Congo (Zaire)45 Egypt44 Thailand41 Sri Lanka41 Laos38 Cambodia35 Ethiopia32 Italy31 Hong Kong31 Ukraine31 Tanzania31 Croatia31 Georgia27 Turkey27 Uruguay26 Senegal26 Ireland25 Trinidad and Tobago25 Armenia20 Denmark20 New Zealand17 Bosnia and Herzegovina15 Malaysia15 France14 Iraq12 Kazakhstan12 Afghanistan12 Panama12 Greece11 Morocco10 Scotland10 Australia10 Latvia10 Switzerland9 Austria9 Grenada7 Lebanon7 Guyana6 Marshall Islands3 Chile
Grandparents responsible for own grandchildren in Sandy Springs
Grandparents (30 to 59 years) White / Caucasian 56 100.0% Responsible for grandchildrenBlack or African American 9 9.6% Responsible for grandchildren88 90.4% Not responsible for grandchildrenWhite alone, not Hispanic / Latino 18 100.0% Responsible for grandchildrenHispanic or Latino 34 100.0% Responsible for grandchildrenGrandparents (60 years and over) White / Caucasian 13 19.0% Responsible for grandchildren57 81.0% Not responsible for grandchildrenBlack or African American 137 100.0% Not responsible for grandchildrenWhite alone, not Hispanic / Latino 14 18.6% Responsible for grandchildren61 81.4% Not responsible for grandchildren