San Juan, WA (Washington) Houses and Residents
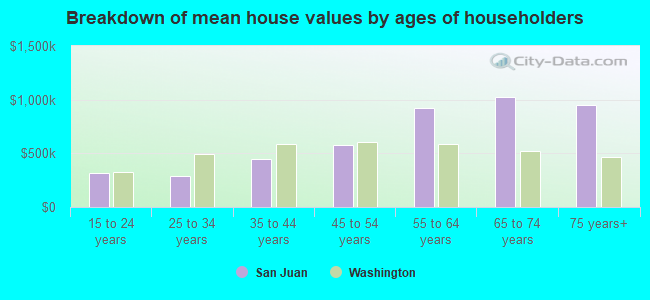
| San Juan: | $805,650 |
| Washington: | $569,500 |
Total population: 7,447 (Urban population: 0, Rural population: 6,894 (148 farm, 6,746 nonfarm))
Houses: 4,099 (3,059 occupied: 2,252 owner occupied, 807 renter occupied)
| % of renters here: | 26% |
| State: | 36% |
Housing density: 67 houses/condos per square mile
Median price asked for vacant for-sale houses and condos in 2022 in this county: $809,257.
Median contract rent in 2022: $1,143 (lower quartile is $830, upper quartile is $1,578)
Median rent asked for vacant for-rent units in 2022: $1,188
Median gross rent in San Juan, WA in 2022: $1,350
Housing units in San Juan with a mortgage: 876 (81 second mortgage, 104 home equity loan, 7 both second mortgage and home equity loan)
Houses without a mortgage: 647
Compare current foreclosures near San Juan, WA:
| Photo | Address | Area | Beds / Baths | Price | Details |
|---|---|---|---|---|---|

|
#1
Roche Harbor Rd, C O Marlys K Merna
Friday Harbor, WA 98250
|
2,500 sq. feet
|
2 baths 3 beds |
show details | |

|
#2
Upper Dr
Friday Harbor, WA 98250
|
1,508 sq. feet
|
2 baths 2 beds |
show details | |

|
#3
Westside Rd
Friday Harbor, WA 98250
|
1,568 sq. feet
|
2 baths 3 beds |
show details | |

|
#4
Madrona Dr
Friday Harbor, WA 98250
|
1,088 sq. feet
|
2 baths 2 beds |
show details | |

|
#5
Indralaya Rd
Eastsound, WA 98245
|
2,863 sq. feet
|
1 baths 1 beds |
show details | |

|
#6
Three Corner Lake Rd
Friday Harbor, WA 98250
|
- sq. feet
|
- baths - beds |
show details | |

|
#7
Tuesday Way
Friday Harbor, WA 98250
|
1,248 sq. feet
|
- baths - beds |
show details | |

|
#8
Airport Circle Dr # 328
Friday Harbor, WA 98250
|
- sq. feet
|
- baths - beds |
show details | |

|
#9
Apple Tree Ln
Friday Harbor, WA 98250
|
- sq. feet
|
- baths - beds |
show details | |

|
#10
Timber Ln
Eastsound, WA 98245
|
- sq. feet
|
- baths - beds |
show details |
| Photo | Address | Area | Beds / Baths | Price | Details |
|---|---|---|---|---|---|

|
#11
Tomihi Dr
Eastsound, WA 98245
|
- sq. feet
|
- baths - beds |
show details | |

|
Check over 1 million property listings on Foreclosure.com!
|
browse all offers | |||

Household type by relationship:
Households: 15,582- In family households: 11,707 (3,163 male householders, 1,275 female householders)
3,676 spouses, 2,911 children (2,666 natural, 122 adopted, 123 stepchildren), 99 grandchildren, 72 brothers or sisters, 53 parents, foster children, 69 other relatives, 324 non-relatives
- In nonfamily households: 3,875 (1,535 male householders (1,197 living alone)), 1,640 female householders (1,391 living alone)), 700 nonrelatives
- In group quarters: 187 (60 institutionalized population)
1,786 married couples with children.
755 single-parent households (244 men, 511 women).
95.1% of residents of San Juan speak English at home.
2.4% of residents speak Spanish at home (68% speak English very well, 11% speak English well, 16% speak English not well, 4% don't speak English at all).
2.0% of residents speak other Indo-European language at home (75% speak English very well, 23% speak English well, 2% don't speak English at all).
0.4% of residents speak Asian or Pacific Island language at home (54% speak English very well, 21% speak English well, 25% speak English not well).
0.1% of residents speak other language at home (100% speak English not well).
Foreign born population: 625 (7.4%)
(52.6% of them are naturalized citizens)
| Here: | 5.3 |
| State: | 6.5 |
| Here: | 3.5 |
| State: | 3.9 |
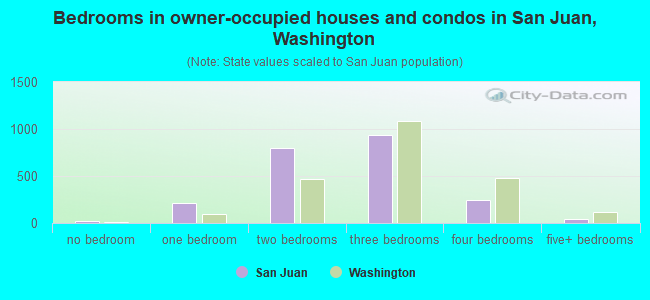
- Bedrooms in owner-occupied houses and condos in San Juan, Washington
- 19no bedroom
- 2111 bedroom
- 7962 bedrooms
- 9413 bedrooms
- 2424 bedrooms
- 435+ bedrooms
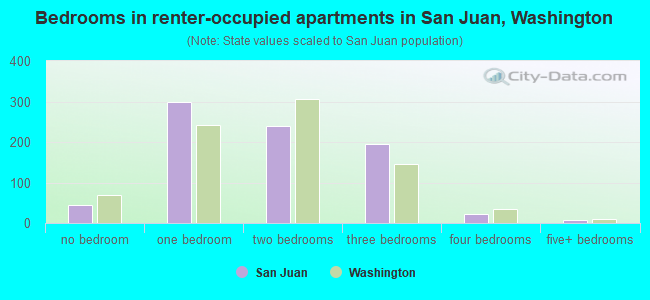
- Bedrooms in renter-occupied apartments in San Juan, Washington
- 45no bedroom
- 2981 bedroom
- 2392 bedrooms
- 1963 bedrooms
- 224 bedrooms
- 75+ bedrooms
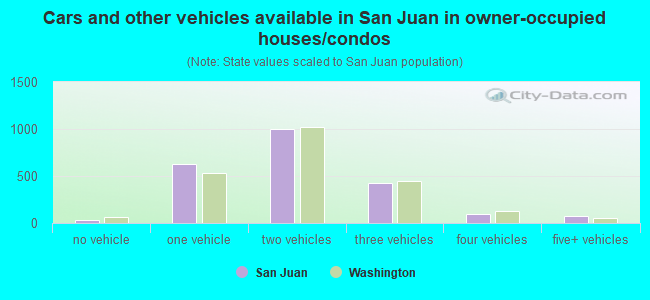
- Cars and other vehicles available in San Juan in owner-occupied houses/condos
- 34no vehicle
- 6321 vehicle
- 9982 vehicles
- 4233 vehicles
- 914 vehicles
- 745+ vehicles
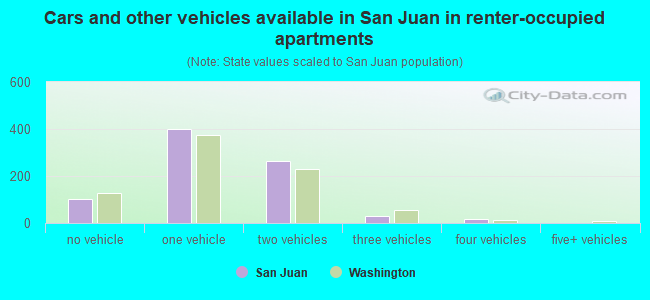
- Cars and other vehicles available in San Juan in renter-occupied apartments
- 101no vehicle
- 3981 vehicle
- 2632 vehicles
- 283 vehicles
- 174 vehicles
- 05+ vehicles
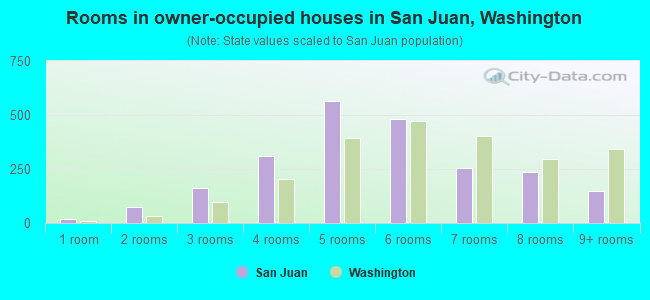
- Rooms in owner-occupied houses in San Juan, Washington
- 191 room
- 742 rooms
- 1613 rooms
- 3114 rooms
- 5675 rooms
- 4806 rooms
- 2567 rooms
- 2348 rooms
- 1509+ rooms
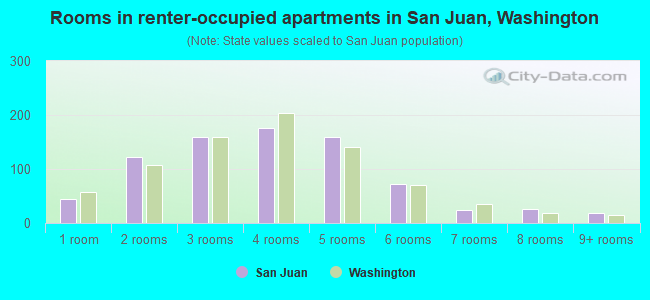
- Rooms in renter-occupied apartments in San Juan, Washington
- 451 room
- 1232 rooms
- 1603 rooms
- 1764 rooms
- 1605 rooms
- 736 rooms
- 257 rooms
- 268 rooms
- 199+ rooms
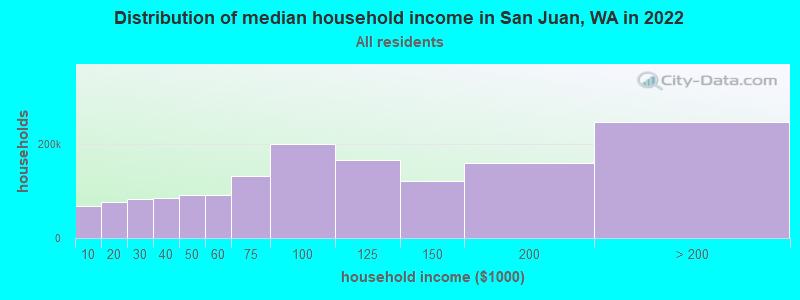
San Juan, WA household income distribution

- 19,225Less than $10,000
- 27,030$10,000 to $19,999
- 29,557$20,000 to $29,999
- 28,286$30,000 to $39,999
- 33,268$40,000 to $49,999
- 28,990$50,000 to $59,999
- 41,615$60,000 to $74,999
- 64,718$75,000 to $99,999
- 55,006$100,000 to $124,999
- 39,997$125,000 to $149,999
- 52,336$150,000 to $199,999
- 63,200$200,000 or more
Percentage of workers working in this county: 92.5%
Number of people working at home: 580 (15.8% of all workers)
Travel time to work (commute)
- Less than 5 minutes: 401
- 5 to 9 minutes: 872
- 10 to 14 minutes: 513
- 15 to 19 minutes: 487
- 20 to 24 minutes: 204
- 25 to 29 minutes: 35
- 30 to 34 minutes: 62
- 35 to 39 minutes: 7
- 40 to 44 minutes: 15
- 45 to 59 minutes: 15
- 60 to 89 minutes: 27
- 90 or more minutes: 66
Means of transportation to work:
- Drove a car alone: 1,941 (63.9%)
- Carpooled: 329 (10.8%)
- Ferryboat: 43 (1.4%)
- Bicycle: 18 (0.6%)
- Walked: 314 (10.3%)
- Other means: 59 (1.9%)
- Worked at home: 332 (10.9%)
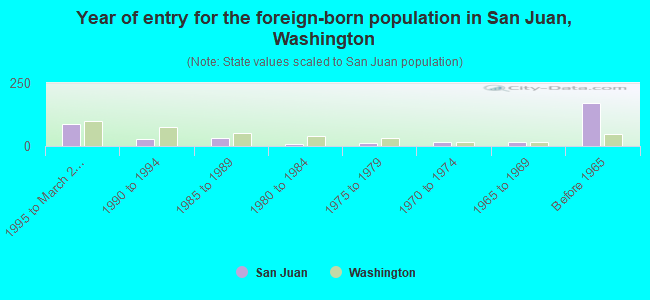
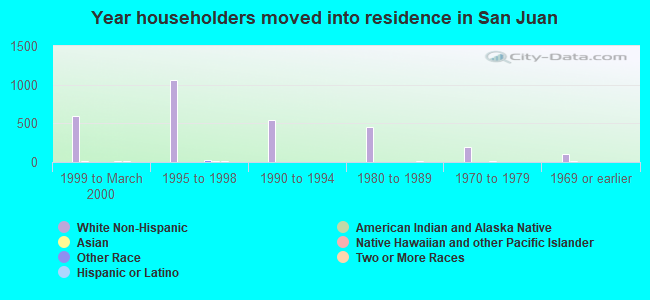
- Year of entry for the foreign-born population in San Juan, Washington
- 891995 to March 2000
- 271990 to 1994
- 321985 to 1989
- 91980 to 1984
- 101975 to 1979
- 171970 to 1974
- 161965 to 1969
- 170Before 1965
Most common places of birth for foreign-born residents (%):
| San Juan: | 26.2% (97) |
| Washington: | 7.7% (47,568) |
| San Juan: | 23.8% (88) |
| Washington: | 3.3% (20,321) |
| San Juan: | 12.7% (47) |
| Washington: | 24.1% (148,115) |
| San Juan: | 11.9% (44) |
| Washington: | 3.4% (21,167) |
| San Juan: | 7.3% (27) |
| Washington: | 3.3% (20,530) |
| San Juan: | 3.5% (13) |
| Washington: | 0.5% (3,086) |
| San Juan: | 3.2% (12) |
| Washington: | 0.4% (2,307) |
| San Juan: | 2.4% (9) |
| Washington: | 0.4% (2,329) |
| San Juan: | 2.2% (8) |
| Washington: | 1.0% (6,393) |
| San Juan: | 2.2% (8) |
| Washington: | 0.3% (1,692) |
| San Juan: | 1.9% (7) |
| Washington: | 2.5% (15,491) |
| San Juan: | 1.6% (6) |
| Washington: | 0.6% (3,795) |
Place of birth for U.S.-born residents:
- This state: 2,479
- Other state: 3,987
- Northeast: 436
- Midwest: 873
- South: 371
- West: 2,307
51% of San Juan residents lived in the same house 5 years ago.
Out of people who lived in different houses, 43% lived in this county.
Out of people who lived in different counties, 39% lived in Washington.
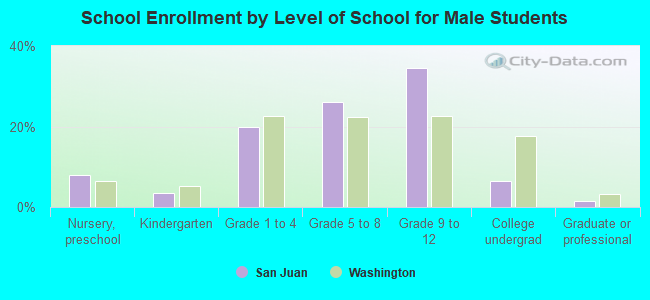
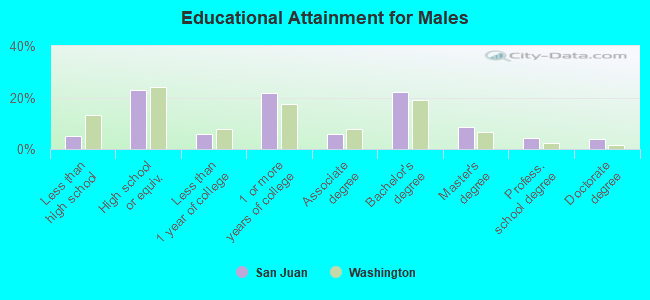
Education attainment for males 25 years and older:
- No schooling: 0
- Nursery to 4th grade: 0
- 5th and 6th grade: 0
- 7th and 8th grade: 7
- 9th grade: 10
- 10th grade: 35
- 11th grade: 13
- 12th grade, no diploma: 56
- High school graduate (or equivalency): 556
- Less than 1 year of college: 142
- Some college more than 1 year, no degree: 527
- Associate degree: 139
- Bachelor's degree: 534
- Master's degree: 209
- Professional school degree: 108
- Doctorate degree: 91
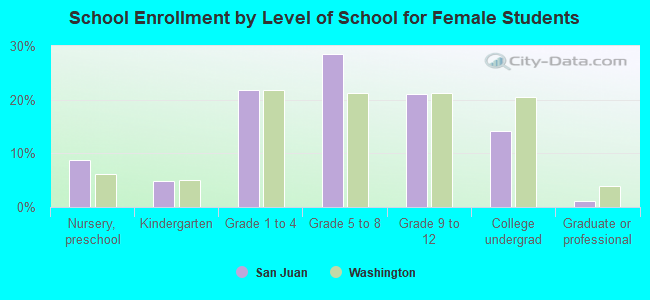
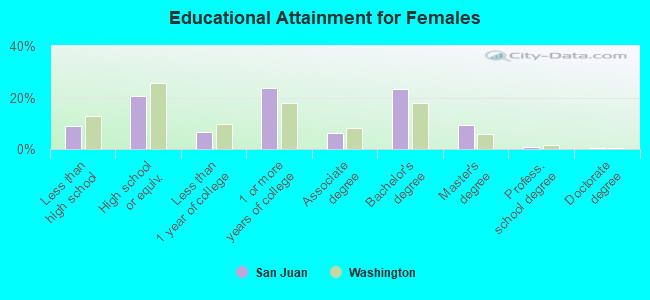
Education attainment for females 25 years and older:
- No schooling: 9
- Nursery to 4th grade: 7
- 5th and 6th grade: 0
- 7th and 8th grade: 30
- 9th grade: 32
- 10th grade: 29
- 11th grade: 61
- 12th grade, no diploma: 73
- High school graduate (or equivalency): 555
- Less than 1 year of college: 181
- Some college more than 1 year, no degree: 636
- Associate degree: 164
- Bachelor's degree: 623
- Master's degree: 248
- Professional school degree: 26
- Doctorate degree: 12


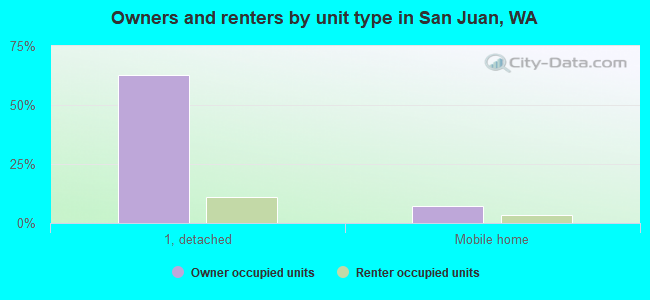
Housing units in structures:
- One, detached: 3,142
- One, attached: 66
- Two: 44
- 3 or 4: 125
- 5 to 9: 146
- 10 to 19: 130
- 20 to 49: 56
- Mobile homes: 354
- Boats, RVs, vans, etc.: 36
Median worth of mobile homes: $261,975
Housing units lacking complete kitchen facilities: 3.9%
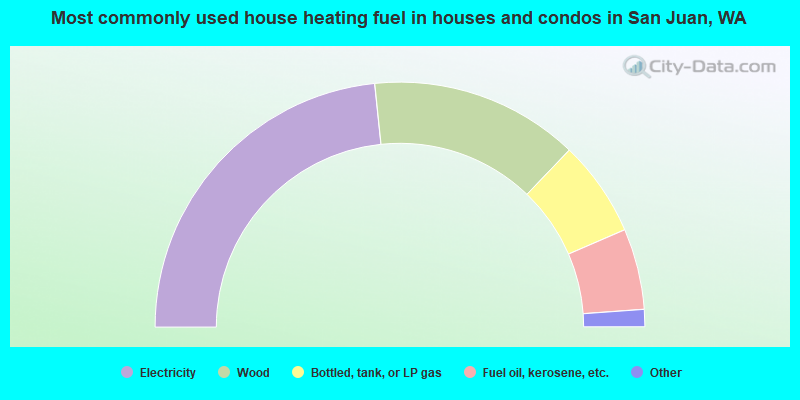
- 46.7%Electricity
- 27.6%Wood
- 12.7%Bottled, tank, or LP gas
- 10.7%Fuel oil, kerosene, etc.
- 1.3%Other fuel
- 1.0%Utility gas
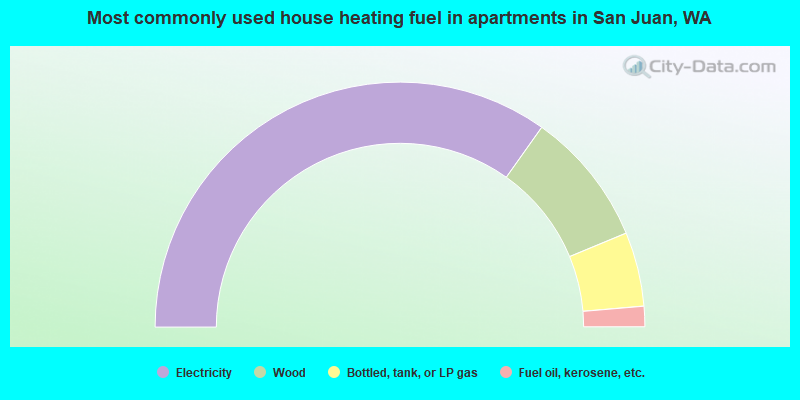
- 69.6%Electricity
- 17.8%Wood
- 9.8%Bottled, tank, or LP gas
- 2.7%Fuel oil, kerosene, etc.
Private vs. public school enrollment:
| Here: | 9.3% |
| Washington: | 9.2% |
| Here: | 7.7% |
| Washington: | 7.0% |
| Here: | 2.8% |
| Washington: | 15.7% |