Races in San Juan, Washington (WA) Detailed Stats
Ancestries, Foreign-born residents, place of birth
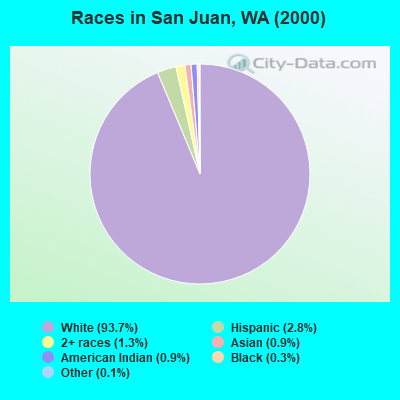
Race distribution in San Juan

- 6,45993.7%White alone
- 1922.8%Hispanic
- 911.3%Two or more races
- 610.9%Asian alone
- 590.9%American Indian alone
- 210.3%Black alone
- 70.1%Other race alone
- 40.06%Native Hawaiian and Other
Pacific Islander alone
2000
2022
-
- 4,652,49078.9%White alone
- 441,5097.5%Hispanic
- 319,4015.4%Asian alone
- 184,6313.1%Black alone
- 175,9263.0%Two or more races
- 85,3961.4%American Indian alone
- 22,7790.4%Native Hawaiian and Other
Pacific Islander alone - 11,9890.2%Other race alone

-
- 4,941,45663.5%White alone
- 1,093,31314.0%Hispanic
- 755,8329.7%Asian alone
- 523,4486.7%Two or more races
- 299,5373.8%Black alone
- 69,0240.9%American Indian alone
- 52,2310.7%Native Hawaiian and Other
Pacific Islander alone - 50,9450.7%Other race alone

Income and house value in San Juan
- Median household income in 2022
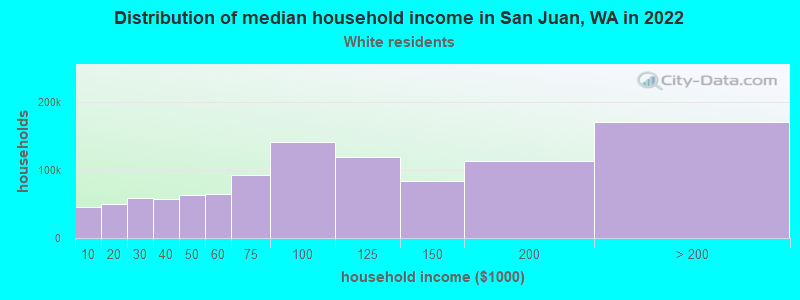
- $84,895White non-Hispanic householders
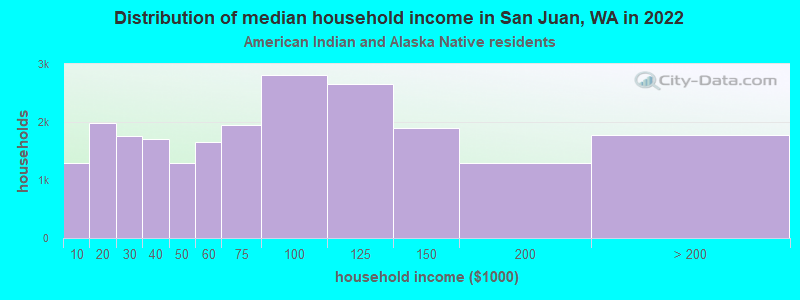
- $91,038American Indian and Alaska Native householders
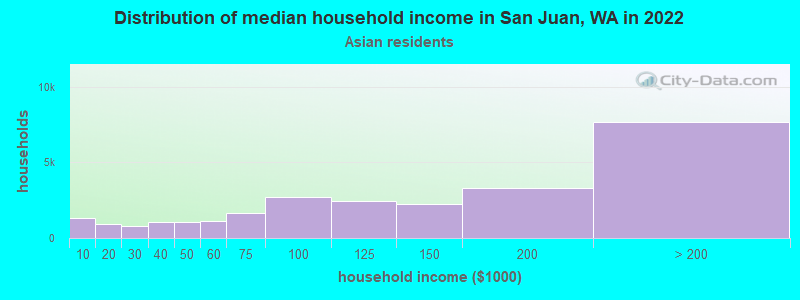
- $15,781Asian householders
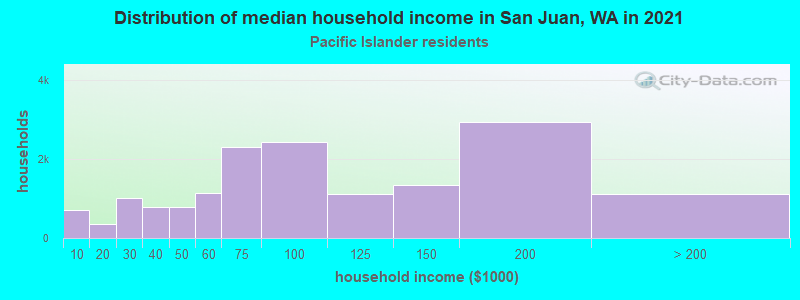
- $80,410Native Hawaiian and other Pacific Islander householders
- over $200,000Some other race householders
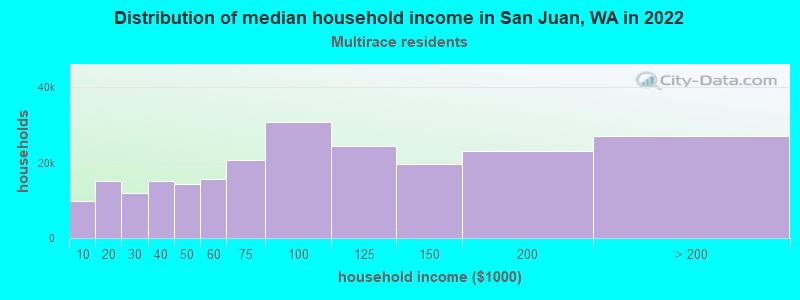
- $141,631Two or more races householders
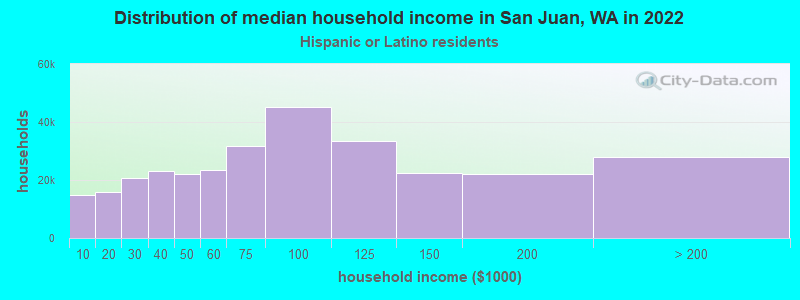
- $150,392Hispanic or Latino race householders
- Median 2022 house value
- $839,042White Non-Hispanic householders
- $544,740American Indian or Alaska Native householders
- $389,100Native Hawaiian and other Pacific Islander householders
- $346,653Some other race householders
- $747,921Two or more races householders
- $445,130Hispanic or Latino householders
Household income for White non-Hispanic householders
Household income for American Indian and Alaska Native householders
Household income for Asian householders
Household income for Native Hawaiian and other Pacific Islander householders
Household income for Two or more races householders
Household income for Hispanic or Latino race householders
Zip code: 98250