Riviera Beach, MD (Maryland) Houses and Residents
Estimated median house or condo value in 2022: $337,619 (it was $127,000 in 2000 )
Riviera Beach:
$337,619Maryland:
$398,100
Lower value quartile - upper value quartile: $272,822 - $400,062Mean price in 2022: Detached houses: $399,823 Here:
$399,823State:
$526,819
Townhouses or other attached units: $290,339 Here:
$290,339State:
$328,305
In 2-unit structures: $251,701 Here:
$251,701State:
$346,599
Total population: 12,677 (Urban population: 12,670, Rural population: 0)
Houses: 4,873 (4,634 occupied: 3,764 owner occupied, 899 renter occupied )
% of renters here:
19%State:
32%
Housing density: 1,827 houses/condos per square mile
Median price asked for vacant for-sale houses and condos in 2022: $519,807.
Median contract rent in 2022: $1,554 (lower quartile is $1,085, upper quartile is $1,928)
Median rent asked for vacant for-rent units in 2022: $1,951
Median gross rent in Riviera Beach, MD in 2022: $1,912
Housing units in Riviera Beach with a mortgage: 2,911 (192 second mortgage, 17 home equity loan, 173 both second mortgage and home equity loan )Houses without a mortgage: 75
Median household income for houses/condos with a mortgage: $115,462
Median household income for apartments without a mortgage: $68,421
Median monthly housing costs: $1,584
Data:
Median house or condo value ($)
Median house or condo value ($ change since 2000)
Median house or condo value ($) - White
Median house or condo value ($) - Black or African American
Median house or condo value ($) - Asian
Median house or condo value ($) - Hispanic or Latino
Median house or condo value ($) - American Indian and Alaska Native
Median house or condo value ($) - Multirace
Median house or condo value ($) - Other Race
Median price asked for mobile homes ($)
Household density (households per square mile)
Mean house or condo value by units in structure - 1, detached ($)
Mean house or condo value by units in structure - 1, attached ($)
Mean house or condo value by units in structure - 2 ($)
Mean house or condo value by units in structure by units in structure - 3 or 4 ($)
Mean house or condo value by units in structure - 5 or more ($)
Mean house or condo value by units in structure - Boat, RV, van, etc. ($)
Mean house or condo value by units in structure - Mobile home ($)
Median contract rent ($)
Median contract rent - Lower quartile ($)
Median contract rent - Upper quartile ($)
Median gross rent ($)
Urban houses (%)
Rural houses (%)
Houses occupied (%)
Houses occupied (% change since 2000)
Houses owner occupied (%)
Houses owner occupied (% change since 2000)
Houses renter occupied (%)
Houses renter occupied (% change since 2000)
Vacant housing units - For rent (%)
Vacant housing units - For rent (% change since 2000)
Vacant housing units - For sale only (%)
Vacant housing units - For sale only (% change since 2000)
Vacant housing units - Rented or sold, not occupied (%)
Vacant housing units - Rented or sold, not occupied (% change since 2000)
Vacant housing units - For seasonal, recreational, or occasional use (%)
Vacant housing units - For seasonal, recreational, or occasional use (% change since 2000)
Vacant housing units - For migrant workers (%)
Vacant housing units - For migrant workers (% change since 2000)
Vacant housing units - Other vacant (%)
Vacant housing units - Other vacant (% change since 2000)
Median monthly housing costs ($)
Median household income for houses/condos with a mortgage ($)
Median household income for houses/condos without a mortgage ($)
Median household income ($)
Median household income ($) - White
Median household income ($) - Black or African American
Median household income ($) - Asian
Median household income ($) - Hispanic or Latino
Median household income ($) - American Indian and Alaska Native
Median household income ($) - Multirace
Median household income ($) - Other Race
Mortgage status - with mortgage (%)
Mortgage status - with second mortgage (%)
Mortgage status - with home equity loan (%)
Mortgage status - with both second mortgage and home equity loan (%)
Mortgage status - without a mortgage (%)
Median year house/condo built
Median year apartment built
Household type by relationship - Male householder living alone (%)
Household type by relationship - Male householder not living alone (%)
Household type by relationship - Female householder living alone (%)
Household type by relationship - Female householder not living alone (%)
Household type by relationship - Opposite-Sex spouse (%)
Household type by relationship - Same-Sex spouse (%)
Household type by relationship - Opposite-Sex unmarried partner (%)
Household type by relationship - Same-Sex unmarried partner (%)
Household type by relationship - In group quarters (%)
Size of family households - 2-person household (%)
Size of family households - 3-person household (%)
Size of family households - 4-person household (%)
Size of family households - 5-person household (%)
Size of family households - 6-person household (%)
Size of family households - 7-or-more-person household (%)
Size of nonfamily households - 1-person household (%)
Size of nonfamily households - 2-person household (%)
Size of nonfamily households - 3-person household (%)
Size of nonfamily households - 4-person household (%)
Size of nonfamily households - 5-person household (%)
Size of nonfamily households - 6-person household (%)
Size of nonfamily households - 7-or-moreperson household (%)
Year house built - Built 2010 or later (%)
Year house built - Built 2000 to 2009 (%)
Year house built - Built 1990 to 1999 (%)
Year house built - Built 1980 to 1989 (%)
Year house built - Built 1970 to 1979 (%)
Year house built - Built 1960 to 1969 (%)
Year house built - Built 1950 to 1959 (%)
Year house built - Built 1940 to 1949 (%)
Year house built - Built 1939 or earlier (%)
Median number of rooms in houses and condos
Median number of rooms in apartments
Median number of bedrooms in owner occupied houses
Mean number of bedrooms in owner occupied houses
Median number of bedrooms in renter occupied houses
Mean number of bedrooms in renter occupied houses
Median number of vehichles in owner occupied houses
Mean number of vehichles in owner occupied houses
Median number of vehichles in renter occupied houses
Mean number of vehichles in renter occupied houses
Rooms in owner-occupied houses - 1 room (%)
Rooms in owner-occupied houses - 2 rooms (%)
Rooms in owner-occupied houses - 3 rooms (%)
Rooms in owner-occupied houses - 4 rooms (%)
Rooms in owner-occupied houses - 5 rooms (%)
Rooms in owner-occupied houses - 6 rooms (%)
Rooms in owner-occupied houses - 7 rooms (%)
Rooms in owner-occupied houses - 8 rooms (%)
Rooms in owner-occupied houses - 9+ rooms (%)
Rooms in renter-occupied houses - 1 room (%)
Rooms in renter-occupied houses - 2 rooms (%)
Rooms in renter-occupied houses - 3 rooms (%)
Rooms in renter-occupied houses - 4 rooms (%)
Rooms in renter-occupied houses - 5 rooms (%)
Rooms in renter-occupied houses - 6 rooms (%)
Rooms in renter-occupied houses - 7 rooms (%)
Rooms in renter-occupied houses - 8 rooms (%)
Rooms in renter-occupied houses - 9+ rooms (%)
Bedrooms in owner-occupied houses - no bedrooms (%)
Bedrooms in owner-occupied houses - 1 bedroom (%)
Bedrooms in owner-occupied houses - 2 bedrooms (%)
Bedrooms in owner-occupied houses - 3 bedrooms (%)
Bedrooms in owner-occupied houses - 4 bedrooms (%)
Bedrooms in owner-occupied houses - 5+ bedrooms (%)
Bedrooms in renter-occupied houses - no bedrooms (%)
Bedrooms in renter-occupied houses - 1 bedroom (%)
Bedrooms in renter-occupied houses - 2 bedrooms (%)
Bedrooms in renter-occupied houses - 3 bedrooms (%)
Bedrooms in renter-occupied houses - 4 bedrooms (%)
Bedrooms in renter-occupied houses - 5+ bedrooms (%)
Vehicles available in owner-occupied houses - no vehicle available (%)
Vehicles available in owner-occupied houses - 1 vehicle available(%)
Vehicles available in owner-occupied houses - 2 Vehicles available (%)
Vehicles available in owner-occupied houses - 3 Vehicles available (%)
Vehicles available in owner-occupied houses - 4 Vehicles available (%)
Vehicles available in owner-occupied houses - 5+ Vehicles available (%)
Vehicles available in renter-occupied houses - no vehicle available (%)
Vehicles available in renter-occupied houses - 1 vehicle available (%)
Vehicles available in renter-occupied houses - 2 Vehicles available (%)
Vehicles available in renter-occupied houses - 3 Vehicles available (%)
Vehicles available in renter-occupied houses - 4 Vehicles available (%)
Vehicles available in renter-occupied houses - 5+ Vehicles available (%)
Housing units in structures - 1, detached (%)
Housing units in structures - 1, attached (%)
Housing units in structures - 2 (%)
Housing units in structures - 3 or 4 (%)
Housing units in structures - 5 to 9 (%)
Housing units in structures - 10 to 19 (%)
Housing units in structures - 20 to 49 (%)
Housing units in structures - 50 or more (%)
Housing units in structures - Mobile home (%)
Housing units in structures - Boat, RV, van, etc. (%)
Housing units in structures - Owners - 1, detached (%)
Housing units in structures - Owners - 1, attached (%)
Housing units in structures - Owners - 2 (%)
Housing units in structures - Owners - 3 or 4 (%)
Housing units in structures - Owners - 5 to 9 (%)
Housing units in structures - Owners - 10 to 19 (%)
Housing units in structures - Owners - 20 to 49 (%)
Housing units in structures - Owners - 50 or more (%)
Housing units in structures - Owners - Mobile home (%)
Housing units in structures - Owners - Boat, RV, van, etc. (%)
Housing units in structures - Renters - 1, detached (%)
Housing units in structures - Renters - 1, attached (%)
Housing units in structures - Renters - 2 (%)
Housing units in structures - Renters - 3 or 4 (%)
Housing units in structures - Renters - 5 to 9 (%)
Housing units in structures - Renters - 10 to 19 (%)
Housing units in structures - Renters - 20 to 49 (%)
Housing units in structures - Renters - 50 or more (%)
Housing units in structures - Renters - Mobile home (%)
Housing units in structures - Renters - Boat, RV, van, etc. (%)
House/condo owner moved in on average (years ago)
Renter moved in on average (years ago)
Year householder moved into unit - Moved in 1999 to March 2000 (%)
Year householder moved into unit - Moved in 1999 to March 2000 (%) - White
Year householder moved into unit - Moved in 1999 to March 2000 (%) - Black or African American
Year householder moved into unit - Moved in 1999 to March 2000 (%) - Asian
Year householder moved into unit - Moved in 1999 to March 2000 (%) - Hispanic or Latino
Year householder moved into unit - Moved in 1999 to March 2000 (%) - American Indian and Alaska Native
Year householder moved into unit - Moved in 1999 to March 2000 (%) - Multirace
Year householder moved into unit - Moved in 1999 to March 2000 (%) - Other Race
Year householder moved into unit - Moved in 1995 to 1998 (%)
Year householder moved into unit - Moved in 1995 to 1998 (%) - White
Year householder moved into unit - Moved in 1995 to 1998 (%) - Black or African American
Year householder moved into unit - Moved in 1995 to 1998 (%) - Asian
Year householder moved into unit - Moved in 1995 to 1998 (%) - Hispanic or Latino
Year householder moved into unit - Moved in 1995 to 1998 (%) - American Indian and Alaska Native
Year householder moved into unit - Moved in 1995 to 1998 (%) - Multirace
Year householder moved into unit - Moved in 1995 to 1998 (%) - Other Race
Year householder moved into unit - Moved in 1990 to 1994 (%)
Year householder moved into unit - Moved in 1990 to 1994 (%) - White
Year householder moved into unit - Moved in 1990 to 1994 (%) - Black or African American
Year householder moved into unit - Moved in 1990 to 1994 (%) - Asian
Year householder moved into unit - Moved in 1990 to 1994 (%) - Hispanic or Latino
Year householder moved into unit - Moved in 1990 to 1994 (%) - American Indian and Alaska Native
Year householder moved into unit - Moved in 1990 to 1994 (%) - Multirace
Year householder moved into unit - Moved in 1990 to 1994 (%) - Other Race
Year householder moved into unit - Moved in 1980 to 1989 (%)
Year householder moved into unit - Moved in 1980 to 1989 (%) - White
Year householder moved into unit - Moved in 1980 to 1989 (%) - Black or African American
Year householder moved into unit - Moved in 1980 to 1989 (%) - Asian
Year householder moved into unit - Moved in 1980 to 1989 (%) - Hispanic or Latino
Year householder moved into unit - Moved in 1980 to 1989 (%) - American Indian and Alaska Native
Year householder moved into unit - Moved in 1980 to 1989 (%) - Multirace
Year householder moved into unit - Moved in 1980 to 1989 (%) - Other Race
Year householder moved into unit - Moved in 1970 to 1979 (%)
Year householder moved into unit - Moved in 1970 to 1979 (%) - White
Year householder moved into unit - Moved in 1970 to 1979 (%) - Black or African American
Year householder moved into unit - Moved in 1970 to 1979 (%) - Asian
Year householder moved into unit - Moved in 1970 to 1979 (%) - Hispanic or Latino
Year householder moved into unit - Moved in 1970 to 1979 (%) - American Indian and Alaska Native
Year householder moved into unit - Moved in 1970 to 1979 (%) - Multirace
Year householder moved into unit - Moved in 1970 to 1979 (%) - Other Race
Year householder moved into unit - Moved in 1969 or earlier (%)
Year householder moved into unit - Moved in 1969 or earlier (%) - White
Year householder moved into unit - Moved in 1969 or earlier (%) - Black or African American
Year householder moved into unit - Moved in 1969 or earlier (%) - Asian
Year householder moved into unit - Moved in 1969 or earlier (%) - Hispanic or Latino
Year householder moved into unit - Moved in 1969 or earlier (%) - American Indian and Alaska Native
Year householder moved into unit - Moved in 1969 or earlier (%) - Multirace
Year householder moved into unit - Moved in 1969 or earlier (%) - Other Race
Housing units lacking complete plumbing facilities (%)
Housing units lacking complete kitchen facilities (%)
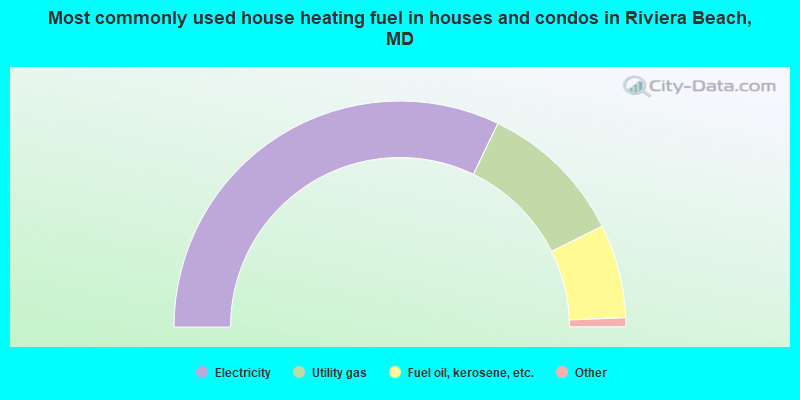
House heating fuel used in houses and condos - Utility gas (%)
House heating fuel used in houses and condos - Bottled, tank, or LP gas (%)
House heating fuel used in houses and condos - Electricity (%)
House heating fuel used in houses and condos - Fuel oil, kerosene, etc. (%)
House heating fuel used in houses and condos - Coal or coke (%)
House heating fuel used in houses and condos - Wood (%)
House heating fuel used in houses and condos - Solar energy (%)
House heating fuel used in houses and condos - Other fuel (%)
House heating fuel used in houses and condos - No fuel used (%)
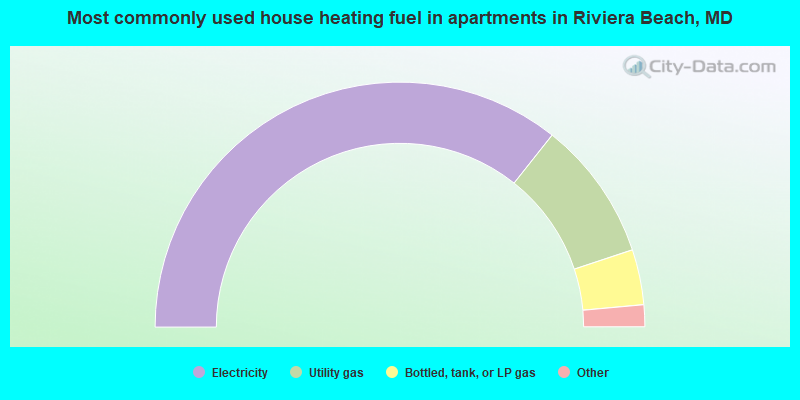
House heating fuel used in apartments - Utility gas (%)
House heating fuel used in apartments - Bottled, tank, or LP gas (%)
House heating fuel used in apartments - Electricity (%)
House heating fuel used in apartments - Fuel oil, kerosene, etc. (%)
House heating fuel used in apartments - Coal or coke (%)
House heating fuel used in apartments - Wood (%)
House heating fuel used in apartments - Solar energy (%)
House heating fuel used in apartments - Other fuel (%)
House heating fuel used in apartments - No fuel used (%)
Median year house/condo built: 1980Median year apartment built: 1971Household type by relationship:
Households: 12,227
Male householders: 1,997 (566 living alone ), Female householders: 2,611 (530 living alone )2,407 spouses (2,354 opposite-sex spouses ), 404 unmarried partners , (404 opposite-sex unmarried partners ), 3,673 children (3,537 natural , 33 adopted , 101 stepchildren ), 227 grandchildren , 199 brothers or sisters , 128 parents , 0 foster children , 130 other relatives , 438 non-relatives In group quarters: 9
Size of family households: 1,108 2-persons , 1,032 3-persons , 700 4-persons , 144 5-persons , 75 6-persons , 5 7-or-more-persons .
Size of nonfamily households: 1,149 1-person , 388 2-persons , 109 3-persons .
1,428 married couples with children. single-parent households (133 men , 848 women ).
90.5% of residents of Riviera Beach speak English at home. of residents speak Spanish at home (30% speak English very well , 63% speak English well , 7% don't speak English at all ).of residents speak other Indo-European language at home (91% speak English very well , 2% speak English well , 7% don't speak English at all ).of residents speak Asian or Pacific Island language at home (58% speak English very well , 39% speak English well , 4% don't speak English at all ).of residents speak other language at home (100% speak English very well ).
Foreign born population: 844 (6.9%)of them are naturalized citizens )
Median number of rooms in houses and condos:
Median number of rooms in apartments
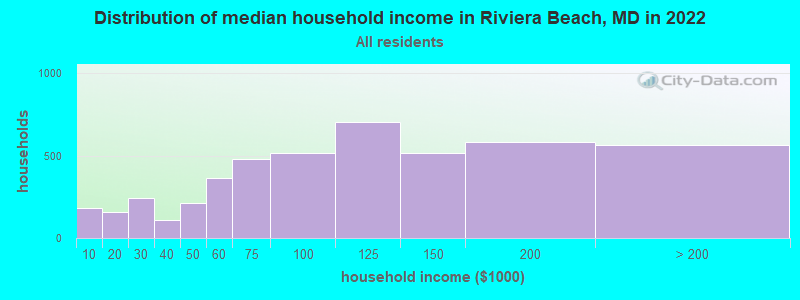
Riviera Beach, MD household income distribution 181 Less than $10,000157 $10,000 to $19,999245 $20,000 to $29,999109 $30,000 to $39,999215 $40,000 to $49,999365 $50,000 to $59,999479 $60,000 to $74,999515 $75,000 to $99,999704 $100,000 to $124,999514 $125,000 to $149,999585 $150,000 to $199,999567 $200,000 or more
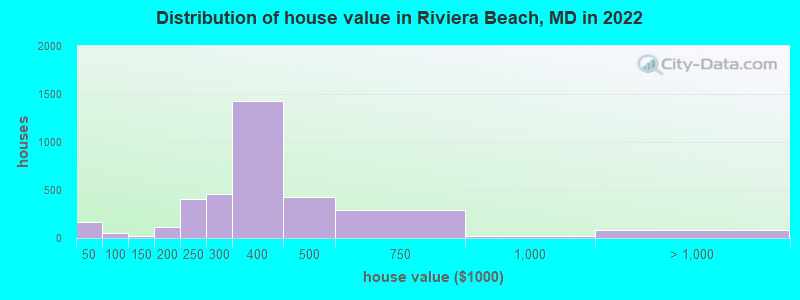
Home value of owner - occupied houses in 2022 in Riviera Beach, MD 69 Less than $10,00022 $25,000 to $29,99953 $30,000 to $34,99925 $40,000 to $49,9998 $50,000 to $59,99922 $70,000 to $79,99916 $100,000 to $124,99996 $150,000 to $174,99915 $175,000 to $199,999404 $200,000 to $249,999457 $250,000 to $299,9991,430 $300,000 to $399,999429 $400,000 to $499,999292 $500,000 to $749,99924 $750,000 to $999,99980 $1,000,000 to $1,499,999Rent paid by renters in 2022 in Riviera Beach, MD 24 $550 to $59934 $700 to $7496 $750 to $799200 $1,000 to $1,24995 $1,250 to $1,499272 $1,500 to $1,999108 $2,000 to $2,49974 $2,500 to $2,99960 No cash rent
Percentage of workers working in this county: 67.2%Number of people working at home: 644 (9.7% of all workers )
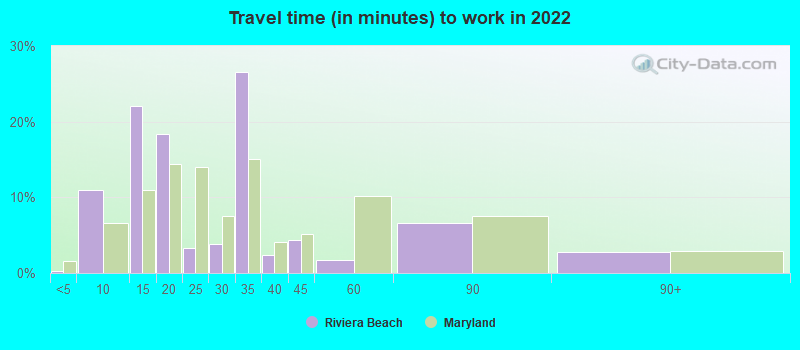
Travel time to work (commute)
Less than 5 minutes: 45 to 9 minutes: 21810 to 14 minutes: 69715 to 19 minutes: 47020 to 24 minutes: 73825 to 29 minutes: 63230 to 34 minutes: 1,00235 to 39 minutes: 23740 to 44 minutes: 44745 to 59 minutes: 61960 to 89 minutes: 53790 or more minutes: 181
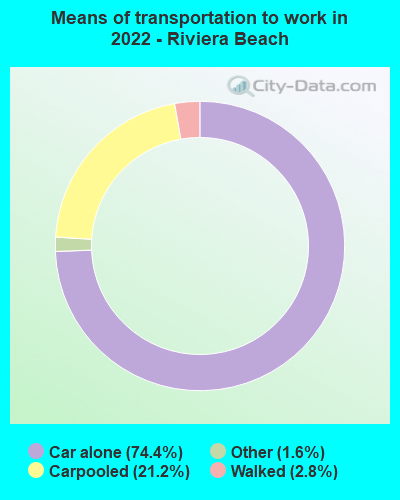
Means of transportation to work:
Drove a car alone: 805 (49.2%)Carpooled: 230 (14.1%)Taxi: 21 (1.3%)Walked: 31 (1.9%)Worked at home: 644 (39.4%)
Unemployment by race in 2022
Unemployment rate for White non-Hispanic residents 2.6% Males4.2% FemalesUnemployment rate for Asian residents 14.3% FemalesUnemployment rate for other race residents 28.6% FemalesUnemployment rate for two or more race residents 31.5% Males
Year of entry for the foreign-born population in Riviera Beach, Maryland
51 2010 or later 175 2000 to 2009 319 1990 to 1999 64 1980 to 1989 36 1970 to 1979 99 Before 1970
First ancestries reported:
German: 772 (18.3%)
Irish: 502 (11.9%)
American: 368 (8.7%)
English: 274 (6.5%)
Nigerian: 274 (6.5%)
Italian: 154 (3.7%)
Portuguese: 139 (3.3%)
Polish: 135 (3.2%)
Jamaican: 122 (2.9%)
Scotch-Irish: 99 (2.4%)
Czech: 87 (2.1%)
Scottish: 80 (1.9%)
European: 43 (1.0%)
French: 36 (0.9%)
Ghanaian: 26 (0.6%)
Austrian: 23 (0.5%)
Norwegian: 22 (0.5%)
Lithuanian: 20 (0.5%)
French Canadian: 15 (0.4%)
Ukrainian: 15 (0.4%)
Hungarian: 14 (0.3%)
Eastern European: 11 (0.3%)
Greek: 7 (0.2%)
Guyanese: 7 (0.2%)
Egyptian: 6 (0.1%) Most common places of birth for foreign-born residents (%): Mexico Riviera Beach:
33.8% (295)Maryland:
3.5% (34,065)
Taiwan Riviera Beach:
12.4% (108)Maryland:
0.9% (8,520)
Germany Riviera Beach:
9.7% (85)Maryland:
1.2% (11,265)
Canada Riviera Beach:
7.6% (66)Maryland:
0.9% (8,603)
China, excluding Hong Kong and Taiwan Riviera Beach:
5.7% (50)Maryland:
4.6% (44,742)
Korea Riviera Beach:
4.4% (38)Maryland:
3.4% (32,635)
Czechoslovakia (includes Czech Republic and Slovakia) Riviera Beach:
3.8% (33)Maryland:
0.2% (1,473)
Brazil Riviera Beach:
3.8% (33)Maryland:
1.2% (11,980)
Peru Riviera Beach:
2.8% (24)Maryland:
1.8% (17,161)
Pakistan Riviera Beach:
2.4% (21)Maryland:
1.8% (17,037)
Colombia Riviera Beach:
2.4% (21)Maryland:
1.3% (12,898)
Ghana Riviera Beach:
2.1% (18)Maryland:
1.8% (17,774)
Place of birth for U.S.-born residents:
This state: 8,775Other state: 2,250Northeast: 809Midwest: 400South: 727West: 286 90.2% of Riviera Beach residents lived in the same house 1 years ago.
Out of people who lived in different houses, 32.4% lived in this county.
Out of people who lived in different counties, 70.5% lived in Maryland.
Riviera Beach:
90.2%State average:
88.5%
Education attainment for males 25 years and older:
No schooling: 136Nursery to 4th grade: 05th and 6th grade: 07th and 8th grade: 229th grade: 1110th grade: 1211th grade: 6112th grade, no diploma: 42High school graduate (or equivalency): 1,456Less than 1 year of college: 493Some college more than 1 year, no degree: 482Associate degree: 158Bachelor's degree: 758Master's degree: 482Professional school degree: 7Doctorate degree: 38
Education attainment for females 25 years and older:
No schooling: 36Nursery to 4th grade: 05th and 6th grade: 07th and 8th grade: 199th grade: 3710th grade: 4111th grade: 23912th grade, no diploma: 5High school graduate (or equivalency): 1,233Less than 1 year of college: 349Some college more than 1 year, no degree: 728Associate degree: 254Bachelor's degree: 1,014Master's degree: 474Professional school degree: 14Doctorate degree: 13
Housing units in structures:
One, detached: 2,494One, attached: 2,176Two: 413 or 4: 7610 to 19: 72Mobile homes: 13Housing units lacking complete kitchen facilities in 2022: 0.6%House/condo owner moved in on average 11 years ago
Renter moved in on average 4 years ago
Private vs. public school enrollment:
Students in private schools in grades 1 to 8 (elementary and middle school): 148 Students in private schools in grades 9 to 12 (high school): 31 Students in private undergraduate colleges: 0