Races in Riviera Beach, Maryland (MD) Detailed Stats
Data:
Races - White alone (%)
Races - White alone (% change since 2000)
Races - Black alone (%)
Races - Black alone (% change since 2000)
Races - American Indian alone (%)
Races - American Indian alone (% change since 2000)
Races - Asian alone (%)
Races - Asian alone (% change since 2000)
Races - Hispanic (%)
Races - Hispanic (% change since 2000)
Races - Native Hawaiian and Other Pacific Islander alone (%)
Races - Native Hawaiian and Other Pacific Islander alone (% change since 2000)
Races - Two or more races(%)
Races - Two or more races(% change since 2000)
Races - Other race alone (%)
Races - Other race alone (% change since 2000)
Racial diversity
Place of birth - Born in state of residence (%)
Place of birth - Born in state of residence (%) - White
Place of birth - Born in state of residence (%) - Black or African American
Place of birth - Born in state of residence (%) - Asian
Place of birth - Born in state of residence (%) - Hispanic or Latino
Place of birth - Born in state of residence (%) - American Indian and Alaska Native
Place of birth - Born in state of residence (%) - Multirace
Place of birth - Born in state of residence (%) - Other Race
Place of birth - Born in other state (%)
Place of birth - Born in other state (%) - White
Place of birth - Born in other state (%) - Black or African American
Place of birth - Born in other state (%) - Asian
Place of birth - Born in other state (%) - Hispanic or Latino
Place of birth - Born in other state (%) - American Indian and Alaska Native
Place of birth - Born in other state (%) - Multirace
Place of birth - Born in other state (%) - Other Race
Place of birth - Native, outside of US (%)
Place of birth - Native, outside of US (%) - White
Place of birth - Native, outside of US (%) - Black or African American
Place of birth - Native, outside of US (%) - Asian
Place of birth - Native, outside of US (%) - Hispanic or Latino
Place of birth - Native, outside of US (%) - American Indian and Alaska Native
Place of birth - Native, outside of US (%) - Multirace
Place of birth - Native, outside of US (%) - Other Race
Place of birth - Foreign born (%)
Place of birth - Foreign born (%) - White
Place of birth - Foreign born (%) - Black or African American
Place of birth - Foreign born (%) - Asian
Place of birth - Foreign born (%) - Hispanic or Latino
Place of birth - Foreign born (%) - American Indian and Alaska Native
Place of birth - Foreign born (%) - Multirace
Place of birth - Foreign born (%) - Other Race
Residents speaking English at home (%)
Residents speaking English at home - Born in the United States (%)
Residents speaking English at home - Native, born elsewhere (%)
Residents speaking English at home - Foreign born (%)
Residents speaking Spanish at home (%)
Residents speaking Spanish at home - Born in the United States (%)
Residents speaking Spanish at home - Native, born elsewhere (%)
Residents speaking Spanish at home - Foreign born (%)
Residents speaking other language at home (%)
Residents speaking other language at home - Born in the United States (%)
Residents speaking other language at home - Native, born elsewhere (%)
Residents speaking other language at home - Foreign born (%)
Marital status - Never married (%)
Marital status - Now married (%)
Marital status - Separated (%)
Marital status - Widowed (%)
Marital status - Divorced (%)
Ancestries Reported - Arab (%)
Ancestries Reported - Czech (%)
Ancestries Reported - Danish (%)
Ancestries Reported - Dutch (%)
Ancestries Reported - English (%)
Ancestries Reported - French (%)
Ancestries Reported - French Canadian (%)
Ancestries Reported - German (%)
Ancestries Reported - Greek (%)
Ancestries Reported - Hungarian (%)
Ancestries Reported - Irish (%)
Ancestries Reported - Italian (%)
Ancestries Reported - Lithuanian (%)
Ancestries Reported - Norwegian (%)
Ancestries Reported - Polish (%)
Ancestries Reported - Portuguese (%)
Ancestries Reported - Russian (%)
Ancestries Reported - Scotch-Irish (%)
Ancestries Reported - Scottish (%)
Ancestries Reported - Slovak (%)
Ancestries Reported - Subsaharan African (%)
Ancestries Reported - Swedish (%)
Ancestries Reported - Swiss (%)
Ancestries Reported - Ukrainian (%)
Ancestries Reported - United States (%)
Ancestries Reported - Welsh (%)
Ancestries Reported - West Indian (%)
Ancestries Reported - Other (%)
Geographical mobility - Same house 1 year ago (%)
Geographical mobility - Same house 1 year ago (%) - White
Geographical mobility - Same house 1 year ago (%) - Black or African American
Geographical mobility - Same house 1 year ago (%) - Asian
Geographical mobility - Same house 1 year ago (%) - Hispanic or Latino
Geographical mobility - Same house 1 year ago (%) - American Indian and Alaska Native
Geographical mobility - Same house 1 year ago (%) - Multirace
Geographical mobility - Same house 1 year ago (%) - Other Race
Geographical mobility - Moved within same county (%)
Geographical mobility - Moved within same county (%) - White
Geographical mobility - Moved within same county (%) - Black or African American
Geographical mobility - Moved within same county (%) - Asian
Geographical mobility - Moved within same county (%) - Hispanic or Latino
Geographical mobility - Moved within same county (%) - American Indian and Alaska Native
Geographical mobility - Moved within same county (%) - Multirace
Geographical mobility - Moved within same county (%) - Other Race
Geographical mobility - Moved from different county within same state (%)
Geographical mobility - Moved from different county within same state (%) - White
Geographical mobility - Moved from different county within same state (%) - Black or African American
Geographical mobility - Moved from different county within same state (%) - Asian
Geographical mobility - Moved from different county within same state (%) - Hispanic or Latino
Geographical mobility - Moved from different county within same state (%) - American Indian and Alaska Native
Geographical mobility - Moved from different county within same state (%) - Multirace
Geographical mobility - Moved from different county within same state (%) - Other Race
Geographical mobility - Moved from different state (%)
Geographical mobility - Moved from different state (%) - White
Geographical mobility - Moved from different state (%) - Black or African American
Geographical mobility - Moved from different state (%) - Asian
Geographical mobility - Moved from different state (%) - Hispanic or Latino
Geographical mobility - Moved from different state (%) - American Indian and Alaska Native
Geographical mobility - Moved from different state (%) - Multirace
Geographical mobility - Moved from different state (%) - Other Race
Geographical mobility - Moved from abroad (%)
Geographical mobility - Moved from abroad (%) - White
Geographical mobility - Moved from abroad (%) - Black or African American
Geographical mobility - Moved from abroad (%) - Asian
Geographical mobility - Moved from abroad (%) - Hispanic or Latino
Geographical mobility - Moved from abroad (%) - American Indian and Alaska Native
Geographical mobility - Moved from abroad (%) - Multirace
Geographical mobility - Moved from abroad (%) - Other Race
Place of birth for the foreign-born population - Ireland (%)
Place of birth for the foreign-born population - Denmark (%)
Place of birth for the foreign-born population - Norway (%)
Place of birth for the foreign-born population - Sweden (%)
Place of birth for the foreign-born population - United Kingdom (%)
Place of birth for the foreign-born population - England (%)
Place of birth for the foreign-born population - Scotland (%)
Place of birth for the foreign-born population - Other Northern Europe (%)
Place of birth for the foreign-born population - Austria (%)
Place of birth for the foreign-born population - Belgium (%)
Place of birth for the foreign-born population - France (%)
Place of birth for the foreign-born population - Germany (%)
Place of birth for the foreign-born population - Netherlands (%)
Place of birth for the foreign-born population - Switzerland (%)
Place of birth for the foreign-born population - Other Western Europe (%)
Place of birth for the foreign-born population - Greece (%)
Place of birth for the foreign-born population - Italy (%)
Place of birth for the foreign-born population - Portugal (%)
Place of birth for the foreign-born population - Spain (%)
Place of birth for the foreign-born population - Other Southern Europe (%)
Place of birth for the foreign-born population - Albania (%)
Place of birth for the foreign-born population - Belarus (%)
Place of birth for the foreign-born population - Bosnia and Herzegovina (%)
Place of birth for the foreign-born population - Bulgaria (%)
Place of birth for the foreign-born population - Croatia (%)
Place of birth for the foreign-born population - Czechoslovakia (%)
Place of birth for the foreign-born population - Hungary (%)
Place of birth for the foreign-born population - Latvia (%)
Place of birth for the foreign-born population - Lithuania (%)
Place of birth for the foreign-born population - North Macedonia (Macedonia) (%)
Place of birth for the foreign-born population - Moldova (%)
Place of birth for the foreign-born population - Poland (%)
Place of birth for the foreign-born population - Romania (%)
Place of birth for the foreign-born population - Russia (%)
Place of birth for the foreign-born population - Serbia (%)
Place of birth for the foreign-born population - Ukraine (%)
Place of birth for the foreign-born population - Other Eastern Europe (%)
Place of birth for the foreign-born population - China (%)
Place of birth for the foreign-born population - Hong Kong (%)
Place of birth for the foreign-born population - Taiwan (%)
Place of birth for the foreign-born population - Japan (%)
Place of birth for the foreign-born population - Korea (%)
Place of birth for the foreign-born population - Other Eastern Asia (%)
Place of birth for the foreign-born population - Afghanistan (%)
Place of birth for the foreign-born population - Bangladesh (%)
Place of birth for the foreign-born population - India (%)
Place of birth for the foreign-born population - Iran (%)
Place of birth for the foreign-born population - Kazakhstan (%)
Place of birth for the foreign-born population - Nepal (%)
Place of birth for the foreign-born population - Pakistan (%)
Place of birth for the foreign-born population - Sri Lanka (%)
Place of birth for the foreign-born population - Uzbekistan (%)
Place of birth for the foreign-born population - Other South Central Asia (%)
Place of birth for the foreign-born population - Burma (%)
Place of birth for the foreign-born population - Cambodia (%)
Place of birth for the foreign-born population - Indonesia (%)
Place of birth for the foreign-born population - Laos (%)
Place of birth for the foreign-born population - Malaysia (%)
Place of birth for the foreign-born population - Philippines (%)
Place of birth for the foreign-born population - Singapore (%)
Place of birth for the foreign-born population - Thailand (%)
Place of birth for the foreign-born population - Vietnam (%)
Place of birth for the foreign-born population - Other South Eastern Asia (%)
Place of birth for the foreign-born population - Armenia (%)
Place of birth for the foreign-born population - Iraq (%)
Place of birth for the foreign-born population - Israel (%)
Place of birth for the foreign-born population - Jordan (%)
Place of birth for the foreign-born population - Kuwait (%)
Place of birth for the foreign-born population - Lebanon (%)
Place of birth for the foreign-born population - Saudi Arabia (%)
Place of birth for the foreign-born population - Syria (%)
Place of birth for the foreign-born population - Turkey (%)
Place of birth for the foreign-born population - Yemen (%)
Place of birth for the foreign-born population - Other Western Asia (%)
Place of birth for the foreign-born population - Eritrea (%)
Place of birth for the foreign-born population - Ethiopia (%)
Place of birth for the foreign-born population - Kenya (%)
Place of birth for the foreign-born population - Somalia (%)
Place of birth for the foreign-born population - Uganda (%)
Place of birth for the foreign-born population - Zimbabwe (%)
Place of birth for the foreign-born population - Other Eastern Africa (%)
Place of birth for the foreign-born population - Cameroon (%)
Place of birth for the foreign-born population - Congo (%)
Place of birth for the foreign-born population - Democratic Republic of Congo (Zaire) (%)
Place of birth for the foreign-born population - Other Middle Africa (%)
Place of birth for the foreign-born population - Egypt (%)
Place of birth for the foreign-born population - Morocco (%)
Place of birth for the foreign-born population - Sudan (%)
Place of birth for the foreign-born population - Other Northern Africa (%)
Place of birth for the foreign-born population - South Africa (%)
Place of birth for the foreign-born population - Other Southern Africa (%)
Place of birth for the foreign-born population - Cabo Verde (%)
Place of birth for the foreign-born population - Ghana (%)
Place of birth for the foreign-born population - Liberia (%)
Place of birth for the foreign-born population - Nigeria (%)
Place of birth for the foreign-born population - Senegal (%)
Place of birth for the foreign-born population - Sierra Leone (%)
Place of birth for the foreign-born population - Other Western Africa (%)
Place of birth for the foreign-born population - Australia (%)
Place of birth for the foreign-born population - New Zealand (%)
Place of birth for the foreign-born population - Fiji (%)
Place of birth for the foreign-born population - Micronesia (%)
Place of birth for the foreign-born population - Bahamas (%)
Place of birth for the foreign-born population - Barbados (%)
Place of birth for the foreign-born population - Cuba (%)
Place of birth for the foreign-born population - Dominica (%)
Place of birth for the foreign-born population - Dominican Republic (%)
Place of birth for the foreign-born population - Grenada (%)
Place of birth for the foreign-born population - Haiti (%)
Place of birth for the foreign-born population - Jamaica (%)
Place of birth for the foreign-born population - St. Vincent and the Grenadines (%)
Place of birth for the foreign-born population - Trinidad and Tobago (%)
Place of birth for the foreign-born population - West Indies (%)
Place of birth for the foreign-born population - Other Caribbean (%)
Place of birth for the foreign-born population - Belize (%)
Place of birth for the foreign-born population - Costa Rica (%)
Place of birth for the foreign-born population - El Salvador (%)
Place of birth for the foreign-born population - Guatemala (%)
Place of birth for the foreign-born population - Honduras (%)
Place of birth for the foreign-born population - Mexico (%)
Place of birth for the foreign-born population - Nicaragua (%)
Place of birth for the foreign-born population - Panama (%)
Place of birth for the foreign-born population - Other Central America (%)
Place of birth for the foreign-born population - Argentina (%)
Place of birth for the foreign-born population - Bolivia (%)
Place of birth for the foreign-born population - Brazil (%)
Place of birth for the foreign-born population - Chile (%)
Place of birth for the foreign-born population - Colombia (%)
Place of birth for the foreign-born population - Ecuador (%)
Place of birth for the foreign-born population - Guyana (%)
Place of birth for the foreign-born population - Peru (%)
Place of birth for the foreign-born population - Uruguay (%)
Place of birth for the foreign-born population - Venezuela (%)
Place of birth for the foreign-born population - Other South America (%)
Place of birth for the foreign-born population - Canada (%)
Place of birth for the foreign-born population - Other Northern America (%)
Place of birth for the foreign-born population - Other (%)
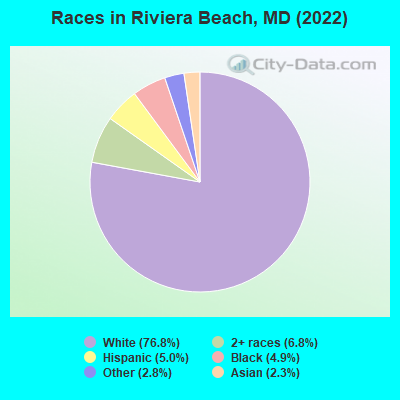
According to 2022 data, the most numerous races in Riviera Beach, MD are White alone (9,392 residents), Black alone (597 residents), and Hispanic (607 residents). 90.7% of Riviera Beach residents speak English at home. 7.1% of Riviera Beach, MD residents are foreign-born (3.1% born in Latin America, 2.0% born in Asia, 1.0% born in Europe), which is 124.4% less than the foreign-born rate of 16.0% across the entire state of Maryland.
Race distribution in Riviera Beach
2000 2022
3,286,547 62.1% White alone 1,464,735 27.7% Black alone 227,916 4.3% Hispanic 209,738 4.0% Asian alone 82,946 1.6% Two or more races 13,312 0.3% American Indian alone 9,379 0.2% Other race alone 1,913 0.04% Native Hawaiian and Other
2,906,492 47.1% White alone 1,800,914 29.2% Black alone 705,842 11.4% Hispanic 401,818 6.5% Asian alone 291,317 4.7% Two or more races 46,930 0.8% Other race alone 8,930 0.1% American Indian alone 2,417 0.04% Native Hawaiian and Other
Income and house value in Riviera Beach Median household income in 2022 $108,730 White non-Hispanic householders$101,326 Asian householders$74,319 Two or more races householders$106,775 Hispanic or Latino race householdersMedian 2022 house value $337,087 White Non-Hispanic householders$300,666 Black or African American householders$299,071 American Indian or Alaska Native householders $237,662 Asian householders$329,643 Some other race householders$348,252 Two or more races householders$354,100 Hispanic or Latino householders
Median age by race in Riviera Beach
45.1 Median age for White residents45.6 44.3 32.0 Median age for Black or African American residents35.9 31.2 -836,842,104.4 Median age for American Indian / Alaska Native residents-674,418,604.0 -1,072,276,158.6 63.9 Median age for Asian residents-664,935,064.3 40.4 -534,101,824.6 Median age for Native Hawaiian / Pacific Islander residents-720,061,021.4 -760,942,760.2 54.0 Median age for Other race residents56.6 36.2 10.8 Median age for Two or more races residents4.5 10.4 45.4 Median age for White alone residents44.8 45.5 48.6 Median age for Hispanic or Latino residents49.6 39.2
Owner/renter occupied households by race in Riviera Beach
House owners and renters - White residents 3,348 84.8% Owner occupied602 15.2% Renter occupiedHouse owners and renters - Black or African American residents 192 75.8% Owner occupied61 24.2% Renter occupiedHouse owners and renters - Asian residents 49 100.0% Owner occupiedHouse owners and renters - Other race residents 36 26.7% Owner occupied100 73.3% Renter occupiedHouse owners and renters - Two or more races residents 47 33.4% Owner occupied94 66.6% Renter occupiedHouse owners and renters - White alone residents 3,335 85.0% Owner occupied587 15.0% Renter occupiedHouse owners and renters - Hispanic or Latino residents 54 37.0% Owner occupied91 63.0% Renter occupied
Language usage in Riviera Beach
English speakers - Total 90.7% of residents of Riviera Beach speak English at home.
4.7% of residents speak Spanish at home 156 28.6% Speak English very well389 71.4% Speak English less than very well4.5% of residents speak other language at home 383 73.7% Speak English very well137 26.3% Speak English less than very well
English speakers - Born in the United States 97.8% of residents of Riviera Beach speak English at home.
1.0% of residents speak Spanish at home 22 100.0% Speak English very well1.0% of residents speak other language at home 22 100.0% Speak English very well
English speakers - Native, born elsewhere 37.3% of residents of Riviera Beach speak English at home.
36.7% of residents speak Spanish at home 63 57.3% Speak English very well47 42.7% Speak English less than very well26.0% of residents speak other language at home 78 100.0% Speak English very well
English speakers - Foreign-born 17.8% of residents of Riviera Beach speak English at home.
47.2% of residents speak Spanish at home 46 11.5% Speak English very well353 88.5% Speak English less than very well40.0% of residents speak other language at home 212 62.7% Speak English very well126 37.3% Speak English less than very well
White (Caucasian) - Speak only English Native:
98.6% (8,841)Foreign-born:
50.1% (64)
White (Caucasian) - Speak another language Native:
1.7% (148)Foreign-born:
52.3% (67)
Black or African American - Speak another language Native:
9.6% (48)Foreign-born:
100.0% (19)
Asian - Speak only English Native:
49.3% (11)Foreign-born:
19.0% (50)
Asian - Speak another language Native:
51.5% (12)Foreign-born:
80.5% (212)
Other race - Speak only English Native:
74.4% (186)Foreign-born:
2.7% (11)
Other race - Speak another language Native:
20.2% (50)Foreign-born:
100.0% (420)
Two or more races - Speak another language Native:
4.3% (40)Foreign-born:
88.6% (12)
White alone - Speak only English Native:
99.5% (8,818)Foreign-born:
52.0% (69)
White alone - Speak another language Native:
0.7% (61)Foreign-born:
48.0% (63)
Hispanic or Latino - Speak another language Native:
57.7% (144)Foreign-born:
100.0% (353)
Foreign-born residents in Riviera Beach 872 residents are foreign born (3.1% Latin America , 2.0% Asia , 1.0% Europe ).
This city:
7.1%Maryland:
15.7%
Marital status for residents in Riviera Beach Marital status - White (Caucasian) population 15 years and over
Males 29.7% Never married59.6% Now married0.9% Separated2.5% Widowed7.3% DivorcedFemales 30.8% Never married45.6% Now married2.8% Separated9.2% Widowed11.5% DivorcedWomen who gave birth in the past 12 months Now married:
81.5% (104)Unmarried:
18.5% (24)
Women who did not give birth in the past 12 months Now married:
40.6% (931)Unmarried:
59.4% (1,360)
Marital status - Black or African American population 15 years and over
Males 56.6% Never married36.4% Now married0.0% Separated0.0% Widowed7.0% DivorcedFemales 34.5% Never married59.5% Now married0.0% Separated6.1% Widowed0.0% DivorcedWomen who did not give birth in the past 12 months Now married:
58.2% (73)Unmarried:
41.8% (52)
Marital status - Asian population 15 years and over
Males 10.8% Never married89.2% Now married0.0% Separated0.0% Widowed0.0% DivorcedFemales 0.0% Never married100.0% Now married0.0% Separated0.0% Widowed0.0% DivorcedWomen who gave birth in the past 12 months Now married:
100.0% (44)Unmarried:
0.0% (0)
Women who did not give birth in the past 12 months Now married:
100.0% (43)Unmarried:
0.0% (0)
Marital status - Other race population 15 years and over
Males 15.0% Never married79.8% Now married0.0% Separated0.0% Widowed5.2% DivorcedFemales 0.0% Never married38.9% Now married0.0% Separated0.0% Widowed61.1% DivorcedWomen who did not give birth in the past 12 months Now married:
38.9% (58)Unmarried:
61.1% (92)
Marital status - Two or more races population 15 years and over
Males 4.2% Never married95.8% Now married0.0% Separated0.0% Widowed0.0% DivorcedFemales 2.5% Never married52.5% Now married0.0% Separated0.0% Widowed45.1% DivorcedWomen who gave birth in the past 12 months Now married:
100.0% (28)Unmarried:
0.0% (0)
Women who did not give birth in the past 12 months Now married:
23.7% (24)Unmarried:
76.3% (79)
Marital status - White alone, not Hispanic / Latino population 15 years and over
Males 30.3% Never married59.3% Now married0.9% Separated2.0% Widowed7.5% DivorcedFemales 30.5% Never married45.3% Now married2.9% Separated9.5% Widowed11.8% DivorcedWomen who gave birth in the past 12 months Now married:
81.5% (107)Unmarried:
18.5% (24)
Women who did not give birth in the past 12 months Now married:
39.6% (885)Unmarried:
60.4% (1,349)
Marital status - Hispanic or Latino population 15 years and over
Males 8.8% Never married84.1% Now married0.0% Separated7.1% Widowed0.0% DivorcedFemales 23.8% Never married39.5% Now married0.0% Separated0.0% Widowed36.7% DivorcedWomen who did not give birth in the past 12 months Now married:
36.5% (81)Unmarried:
63.5% (142)
Ancestries in Riviera Beach
772 18.3% German502 11.9% Irish368 8.7% American274 6.5% English274 6.5% Nigerian154 3.7% Italian139 3.3% Portuguese135 3.2% Polish122 2.9% Jamaican99 2.4% Scotch-Irish87 2.1% Czech80 1.9% Scottish43 1.0% European36 0.9% French26 0.6% Ghanaian23 0.5% Austrian22 0.5% Norwegian20 0.5% Lithuanian15 0.4% French Canadian15 0.4% Ukrainian14 0.3% Hungarian11 0.3% Eastern European7 0.2% Greek7 0.2% Guyanese6 0.1% Egyptian
Children Nativity (place of birth) in Riviera Beach
Children under 6 years - Living with two parents Both parents native 490 100.0% NativeOne native, one foreign-born parent 107 100.0% NativeChildren under 6 years - Living with one parent Native parent 123 100.0% Native
Children 6 to 17 years - Living with two parents Both parents native 790 100.0% NativeBoth parents foreign-born 40 100.0% NativeChildren 6 to 17 years - Living with one parent Native parent 964 100.0% Native
Grandparents responsible for own grandchildren in Riviera Beach
Grandparents (30 to 59 years) White / Caucasian 32 100.0% Responsible for grandchildrenWhite alone, not Hispanic / Latino 32 100.0% Responsible for grandchildrenGrandparents (60 years and over) White / Caucasian 53 36.5% Responsible for grandchildren93 63.5% Not responsible for grandchildrenWhite alone, not Hispanic / Latino 55 36.7% Responsible for grandchildren96 63.3% Not responsible for grandchildren