Redland, MD (Maryland) Houses and Residents
| Redland: | $519,017 |
| Maryland: | $398,100 |
Total population: 17,242 (Urban population: 16,793, Rural population: 458 (all nonfarm))
Houses: 5,927 (5,764 occupied: 4,632 owner occupied, 1,176 renter occupied)
| % of renters here: | 20% |
| State: | 32% |
Housing density: 863 houses/condos per square mile
Median price asked for vacant for-sale houses and condos in 2022: $992,376.
Median contract rent in 2022: $1,772 (lower quartile is $1,417, upper quartile is over $2,000)
Median rent asked for vacant for-rent units in 2022: $1,766
Median gross rent in Redland, MD in 2022: $1,997
Housing units in Redland with a mortgage: 3,142 (297 second mortgage, 21 home equity loan, 176 both second mortgage and home equity loan)
Houses without a mortgage: 38
Median household income for houses/condos with a mortgage: $142,722
Median household income for apartments without a mortgage: $120,844
Median monthly housing costs: $1,967
Compare current foreclosures near Redland, MD:
| Photo | Address | Area | Beds / Baths | Price | Details |
|---|---|---|---|---|---|

|
#1
Eastern Ave NE
Washington, DC 20011
|
1,024 sq. feet
|
1 baths 3 beds |
$395,000
|
show details |

|
#2
Hammersmith Cir
Silver Spring, MD 20906
|
1,152 sq. feet
|
1 baths 3 beds |
$353,600
|
show details |

|
#3
Interlachen Dr Apt 111
Silver Spring, MD 20906
|
965 sq. feet
|
1 baths 2 beds |
$148,000
|
show details |

|
#4
Pooks Hill Rd Apt 1612s
Bethesda, MD 20814
|
1,250 sq. feet
|
1 baths 2 beds |
$289,000
|
show details |

|
#5
Cathedral Ave NW Apt 108
Washington, DC 20016
|
765 sq. feet
|
1 baths 1 beds |
$269,900
|
show details |

|
#6
Brooke Knolls Rd
Gaithersburg, MD 20882
|
1,704 sq. feet
|
3 baths 4 beds |
$681,500
|
show details |

|
#7
17th St NW Apt 504
Washington, DC 20009
|
800 sq. feet
|
1 baths 1 beds |
$405,000
|
show details |

|
#8
Monroe St NW
Washington, DC 20010
|
- sq. feet
|
2 baths 2 beds |
$665,000
|
show details |

|
#9
19th St NW
Washington, DC 20036
|
2,515 sq. feet
|
6 baths 8 beds |
$1,684,800
|
show details |

|
#10
Wilson Ln Apt 204
Mc Lean, VA 22102
|
925 sq. feet
|
1 baths 2 beds |
$359,900
|
show details |
| Photo | Address | Area | Beds / Baths | Price | Details |
|---|---|---|---|---|---|

|
#11
9th St NW
Washington, DC 20011
|
1,604 sq. feet
|
2 baths 3 beds |
$598,000
|
show details |

|
#12
Softwater Way
Columbia, MD 21046
|
1,520 sq. feet
|
3 baths 4 beds |
show details | |

|
#13
Pearl Fog Way
Dunn Loring, VA 22027
|
3,497 sq. feet
|
4 baths 4 beds |
show details | |

|
#14
Sargent Rd NE
Washington, DC 20017
|
1,360 sq. feet
|
2 baths 3 beds |
show details | |

|
#15
Berryville Rd
Germantown, MD 20874
|
960 sq. feet
|
1 baths 3 beds |
show details | |

|
#16
16th St NW Apt 305
Washington, DC 20009
|
1,158 sq. feet
|
1 baths 2 beds |
show details | |

|
#17
Palmetto Cir
Germantown, MD 20874
|
1,135 sq. feet
|
2 baths 3 beds |
show details | |

|
#18
Connecticut Ave NW Apt 606
Washington, DC 20008
|
160 sq. feet
|
1 baths 1 beds |
show details | |

|
#19
Brooke Rd
Sandy Spring, MD 20860
|
5,046 sq. feet
|
4 baths 4 beds |
show details | |

|
#20
Avena St
Silver Spring, MD 20902
|
1,188 sq. feet
|
2 baths 3 beds |
show details |
| Photo | Address | Area | Beds / Baths | Price | Details |
|---|---|---|---|---|---|

|
#21
S Arbory Ln
Laurel, MD 20707
|
1,283 sq. feet
|
3 baths 3 beds |
show details | |

|
#22
Brassie Pl Apt 201
Montgomery Village, MD 20886
|
1,054 sq. feet
|
2 baths 2 beds |
show details | |

|
#23
13th Ave
Hyattsville, MD 20782
|
1,598 sq. feet
|
1 baths 4 beds |
show details | |

|
#24
Tremayne Pl Apt 309
Mc Lean, VA 22102
|
1,180 sq. feet
|
2 baths 2 beds |
show details | |

|
#25
Plainfield St
Falls Church, VA 22043
|
1,102 sq. feet
|
3 baths 4 beds |
show details | |

|
#26
Manor Ln
Ellicott City, MD 21042
|
864 sq. feet
|
1 baths 2 beds |
show details | |

|
#27
Mcwhorter Farm Ct
Damascus, MD 20872
|
6,621 sq. feet
|
6 baths 5 beds |
show details | |

|
#28
Carriage Hill Dr
Frederick, MD 21704
|
1,868 sq. feet
|
3 baths 3 beds |
show details | |

|
#29
Navahoe St
Hyattsville, MD 20783
|
1,068 sq. feet
|
2 baths 3 beds |
show details | |

|
#30
Jefferson St NW
Washington, DC 20011
|
1,280 sq. feet
|
5 baths 6 beds |
show details |
| Photo | Address | Area | Beds / Baths | Price | Details |
|---|---|---|---|---|---|

|
#31
Lakeland Dr
Sterling, VA 20164
|
2,143 sq. feet
|
2 baths 3 beds |
show details | |

|
#32
Crossbeam Ct
Reston, VA 20194
|
2,642 sq. feet
|
3 baths 4 beds |
show details | |

|
#33
N Capitol St NW
Washington, DC 20012
|
896 sq. feet
|
1 baths 2 beds |
show details | |

|
#34
Nedra Dr
Great Falls, VA 22066
|
4,988 sq. feet
|
5 baths 4 beds |
show details | |

|
#35
Peabody St NW
Washington, DC 20011
|
3,180 sq. feet
|
4 baths 8 beds |
show details | |

|
#36
Spring Rd NW
Washington, DC 20010
|
1,280 sq. feet
|
1 baths 3 beds |
show details | |

|
#37
Anderson Rd
Falls Church, VA 22043
|
884 sq. feet
|
2 baths 3 beds |
show details | |

|
#38
Youngs Cliff Rd
Sterling, VA 20165
|
2,422 sq. feet
|
2 baths 3 beds |
show details | |

|
#39
Snow Hill Way
Sterling, VA 20165
|
3,276 sq. feet
|
4 baths 5 beds |
show details | |

|
#40
Carroll Ave
Takoma Park, MD 20912
|
3,600 sq. feet
|
- baths - beds |
show details |
| Photo | Address | Area | Beds / Baths | Price | Details |
|---|---|---|---|---|---|

|
#41
Riptide Sq
Sterling, VA 20165
|
2,348 sq. feet
|
3 baths 3 beds |
show details | |

|
#42
Browns Mill Ct
Herndon, VA 20170
|
2,881 sq. feet
|
3 baths 5 beds |
show details | |

|
#43
14th St NW
Washington, DC 20011
|
- sq. feet
|
1 baths 1 beds |
show details | |

|
#44
Jefferson St NE
Washington, DC 20011
|
1,156 sq. feet
|
1 baths 3 beds |
show details | |

|
#45
Wood Glade Dr
Great Falls, VA 22066
|
2,696 sq. feet
|
3 baths 5 beds |
show details | |

|
#46
Goldstone Ter
Sterling, VA 20164
|
1,582 sq. feet
|
2 baths 3 beds |
show details | |

|
#47
Kennedy St NE
Washington, DC 20011
|
1,088 sq. feet
|
1 baths 3 beds |
show details | |

|
#48
Anchorage Cir
Sterling, VA 20165
|
2,402 sq. feet
|
2 baths 4 beds |
show details | |

|
#49
Primrose Rd NW
Washington, DC 20012
|
2,292 sq. feet
|
3 baths 4 beds |
show details | |

|
Check over 1 million property listings on Foreclosure.com!
|
browse all offers | |||

Latest news about housing in Redland, MD collected exclusively by city-data.com from local newspapers, TV, and radio stations

 | townhomes in derwood vs white oak (4 replies) |
| Safe area to live in preserve at rock creek area? (2 replies) |
| Fallsgrove, King Farm, or Shady Grove Crossing? (8 replies) |
| ******Gaithersburg Development Thread****** (235 replies) |
| Rockville Redevelopment facing major opposition and city may get left behind (24 replies) |
| Derwood (2 replies) |

Median year apartment built: 1989
Household type by relationship:
Households: 18,269- Male householders: 2,861 (228 living alone), Female householders: 2,834 (633 living alone)
3,740 spouses (3,696 opposite-sex spouses), 262 unmarried partners, (262 opposite-sex unmarried partners), 5,646 children (5,346 natural, 98 adopted, 201 stepchildren), 349 grandchildren, 218 brothers or sisters, 910 parents, 9 foster children, 698 other relatives, 697 non-relatives
- In group quarters: 41
Size of family households: 1,575 2-persons, 925 3-persons, 974 4-persons, 456 5-persons, 328 6-persons, 282 7-or-more-persons.
Size of nonfamily households: 983 1-person, 164 2-persons, 14 3-persons, 27 5-persons.
2,931 married couples with children.
627 single-parent households (100 men, 527 women).
45.4% of residents of Redland speak English at home.
34.2% of residents speak Spanish at home (44% speak English very well, 28% speak English well, 19% speak English not well, 9% don't speak English at all).
6.6% of residents speak other Indo-European language at home (62% speak English very well, 28% speak English well, 7% speak English not well, 3% don't speak English at all).
12.1% of residents speak Asian or Pacific Island language at home (51% speak English very well, 24% speak English well, 22% speak English not well, 2% don't speak English at all).
2.2% of residents speak other language at home (87% speak English very well, 11% speak English well, 2% don't speak English at all).
Foreign born population: 7,579 (41.5%)
(57.4% of them are naturalized citizens)
| Here: | 7.8 |
| State: | 7.3 |
| Here: | 5.6 |
| State: | 4.2 |

- Bedrooms in owner-occupied houses and condos in Redland, Maryland
- 18no bedroom
- 121 bedroom
- 2622 bedrooms
- 1,4043 bedrooms
- 1,9804 bedrooms
- 9565+ bedrooms

- Bedrooms in renter-occupied apartments in Redland, Maryland
- 35no bedroom
- 1421 bedroom
- 3252 bedrooms
- 3243 bedrooms
- 2774 bedrooms
- 735+ bedrooms

- Cars and other vehicles available in Redland in owner-occupied houses/condos
- 116no vehicle
- 8311 vehicle
- 2,3132 vehicles
- 9163 vehicles
- 3524 vehicles
- 1055+ vehicles

- Cars and other vehicles available in Redland in renter-occupied apartments
- 87no vehicle
- 3791 vehicle
- 5202 vehicles
- 1493 vehicles
- 414 vehicles
- 05+ vehicles
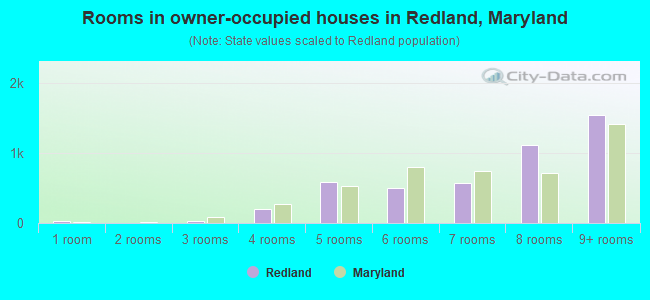
- Rooms in owner-occupied houses in Redland, Maryland
- 181 room
- 02 rooms
- 353 rooms
- 1804 rooms
- 5315 rooms
- 4396 rooms
- 6367 rooms
- 1,1448 rooms
- 1,6509+ rooms

- Rooms in renter-occupied apartments in Redland, Maryland
- 271 room
- 812 rooms
- 1033 rooms
- 1624 rooms
- 1955 rooms
- 1886 rooms
- 2097 rooms
- 168 rooms
- 1949+ rooms


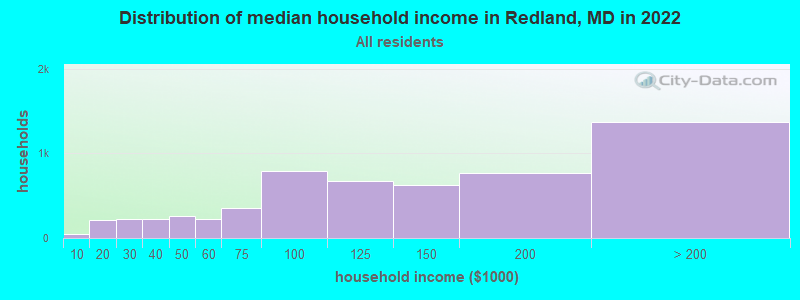
Redland, MD household income distribution

- 44Less than $10,000
- 218$10,000 to $19,999
- 221$20,000 to $29,999
- 226$30,000 to $39,999
- 255$40,000 to $49,999
- 229$50,000 to $59,999
- 358$60,000 to $74,999
- 787$75,000 to $99,999
- 677$100,000 to $124,999
- 629$125,000 to $149,999
- 769$150,000 to $199,999
- 1,372$200,000 or more
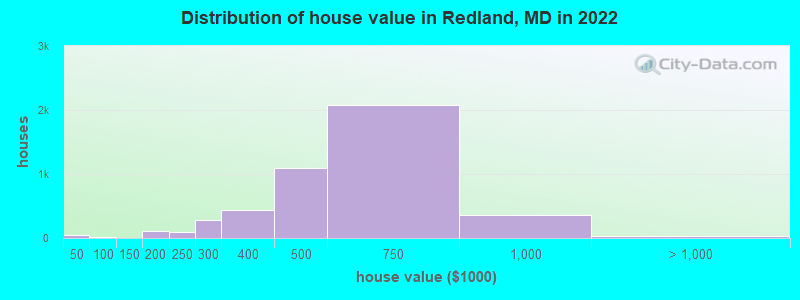
Home value of owner - occupied houses in 2022 in Redland, MD
-
- 16Less than $10,000
- 3$30,000 to $34,999
- 20$40,000 to $49,999
- 104$175,000 to $199,999
- 85$200,000 to $249,999
- 277$250,000 to $299,999
- 439$300,000 to $399,999
- 1,100$400,000 to $499,999
- 2,073$500,000 to $749,999
- 360$750,000 to $999,999
- 31$1,000,000 to $1,499,999
- 7$1,500,000 to $1,999,999
Rent paid by renters in 2022 in Redland, MD
-
- 11Less than $100
- 13$800 to $899
- 32$1,000 to $1,249
- 325$1,250 to $1,499
- 394$1,500 to $1,999
- 121$2,000 to $2,499
- 168$2,500 to $2,999
- 62$3,000 to $3,499
- 18$3,500 or more
- 37No cash rent


Percentage of workers working in this county: 81.2%
Number of people working at home: 2,203 (23.3% of all workers)
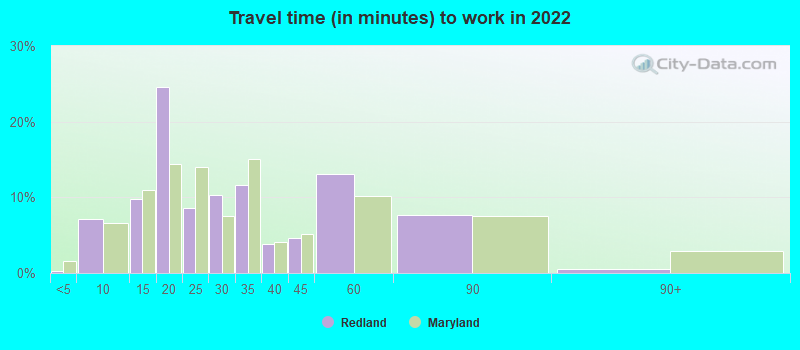
Travel time to work (commute)
- Less than 5 minutes: 24
- 5 to 9 minutes: 184
- 10 to 14 minutes: 798
- 15 to 19 minutes: 1,047
- 20 to 24 minutes: 871
- 25 to 29 minutes: 452
- 30 to 34 minutes: 1,080
- 35 to 39 minutes: 250
- 40 to 44 minutes: 472
- 45 to 59 minutes: 833
- 60 to 89 minutes: 866
- 90 or more minutes: 212
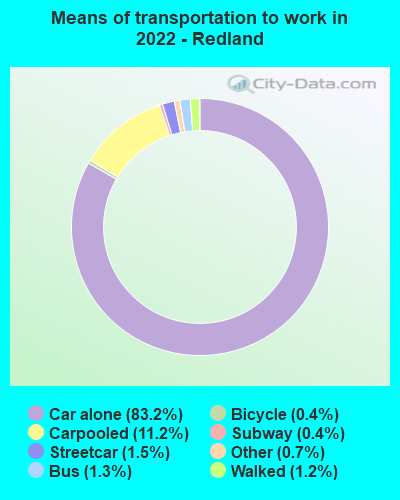
Means of transportation to work:
- Drove a car alone: 1,987 (46.0%)
- Carpooled: 285 (6.6%)
- Bus: 27 (0.6%)
- Subway or elevated rail: 30 (0.7%)
- Long-distance train or commuter rail: 9 (0.2%)
- Taxi: 18 (0.4%)
- Bicycle: 13 (0.3%)
- Walked: 24 (0.6%)
- Worked at home: 2,203 (51.0%)

- Unemployment by race in 2022
- Unemployment rate for White non-Hispanic residents
- 2.9%Males
- 0.7%Females
- Unemployment rate for Black residents
- 1.3%Males
- 0.4%Females
- Unemployment rate for Asian residents
- 3.4%Males
- 3.5%Females
- Unemployment rate for other race residents
- 1.7%Males
- 3.1%Females
- Unemployment rate for two or more race residents
- 0.9%Males
- 4.8%Females
- Unemployment rate for Hispanic or Latino residents
- 1.6%Males
- 11.2%Females

- Year of entry for the foreign-born population in Redland, Maryland
- 2,1072010 or later
- 2,1652000 to 2009
- 1,4711990 to 1999
- 1,9211980 to 1989
- 8191970 to 1979
- 434Before 1970

First ancestries reported:
- Kenyan: 469 (3.9%)
- German: 463 (3.9%)
- Arab: 266 (2.2%)
- European: 259 (2.2%)
- Iranian: 251 (2.1%)
- Irish: 209 (1.7%)
- Polish: 189 (1.6%)
- American: 186 (1.6%)
- African: 181 (1.5%)
- Italian: 168 (1.4%)
- Ethiopian: 156 (1.3%)
- English: 143 (1.2%)
- Romanian: 132 (1.1%)
- Jamaican: 71 (0.6%)
- Greek: 71 (0.6%)
- Eastern European: 70 (0.6%)
- Nigerian: 62 (0.5%)
- Scottish: 58 (0.5%)
- Russian: 54 (0.5%)
- Ukrainian: 51 (0.4%)
- Trinidadian and Tobagonian: 42 (0.4%)
- Egyptian: 39 (0.3%)
- Danish: 39 (0.3%)
- British: 32 (0.3%)
- Czechoslovakian: 27 (0.2%)
- Welsh: 27 (0.2%)
- Ghanaian: 24 (0.2%)
- Croatian: 23 (0.2%)
- Armenian: 20 (0.2%)
- British West Indian: 15 (0.1%)
- Barbadian: 13 (0.1%)
- French Canadian: 11 (0.09%)
- Scotch-Irish: 11 (0.09%)
- Dutch: 10 (0.08%)
- Austrian: 10 (0.08%)
- Palestinian: 9 (0.08%)
- Guyanese: 7 (0.06%)
- Swedish: 6 (0.05%)
- Celtic: 5 (0.04%)
- Jordanian: 5 (0.04%)
- Norwegian: 4 (0.03%)
- French: 2 (0.02%)
Most common places of birth for foreign-born residents (%):
| Redland: | 21.0% (1,594) |
| Maryland: | 12.0% (115,412) |
| Redland: | 7.3% (552) |
| Maryland: | 4.6% (44,742) |
| Redland: | 6.6% (498) |
| Maryland: | 3.8% (36,698) |
| Redland: | 5.1% (384) |
| Maryland: | 0.7% (7,000) |
| Redland: | 4.2% (318) |
| Maryland: | 1.1% (10,205) |
| Redland: | 4.2% (318) |
| Maryland: | 4.4% (42,350) |
| Redland: | 3.9% (294) |
| Maryland: | 3.4% (32,635) |
| Redland: | 3.5% (267) |
| Maryland: | 1.3% (12,898) |
| Redland: | 3.4% (254) |
| Maryland: | 1.9% (18,716) |
| Redland: | 3.2% (243) |
| Maryland: | 0.8% (7,497) |
| Redland: | 3.2% (242) |
| Maryland: | 6.4% (61,725) |
| Redland: | 3.1% (236) |
| Maryland: | 2.5% (24,026) |
| Redland: | 3.0% (225) |
| Maryland: | 1.4% (13,947) |
| Redland: | 2.7% (202) |
| Maryland: | 1.8% (17,161) |
| Redland: | 2.1% (156) |
| Maryland: | 0.6% (5,899) |
| Redland: | 1.6% (119) |
| Maryland: | 0.3% (2,631) |
| Redland: | 1.5% (116) |
| Maryland: | 0.1% (767) |
| Redland: | 1.5% (114) |
| Maryland: | 0.7% (6,326) |
Place of birth for U.S.-born residents:
- This state: 5,066
- Other state: 5,295
- Northeast: 2,065
- Midwest: 713
- South: 1,914
- West: 527
94.5% of Redland residents lived in the same house 1 years ago.
Out of people who lived in different houses, 45.0% lived in this county.
Out of people who lived in different counties, 70.9% lived in Maryland.
| Redland: | 94.5% |
| State average: | 88.5% |
Education attainment for males 25 years and older:
- No schooling: 309
- Nursery to 4th grade: 81
- 5th and 6th grade: 222
- 7th and 8th grade: 39
- 9th grade: 43
- 10th grade: 60
- 11th grade: 44
- 12th grade, no diploma: 38
- High school graduate (or equivalency): 1,072
- Less than 1 year of college: 162
- Some college more than 1 year, no degree: 555
- Associate degree: 593
- Bachelor's degree: 1,719
- Master's degree: 780
- Professional school degree: 130
- Doctorate degree: 276

Education attainment for females 25 years and older:
- No schooling: 319
- Nursery to 4th grade: 235
- 5th and 6th grade: 244
- 7th and 8th grade: 22
- 9th grade: 45
- 10th grade: 0
- 11th grade: 9
- 12th grade, no diploma: 34
- High school graduate (or equivalency): 1,038
- Less than 1 year of college: 222
- Some college more than 1 year, no degree: 711
- Associate degree: 369
- Bachelor's degree: 1,822
- Master's degree: 1,143
- Professional school degree: 338
- Doctorate degree: 282


Housing units in structures:
- One, detached: 3,657
- One, attached: 1,314
- 3 or 4: 115
- 5 to 9: 163
- 10 to 19: 453
- 20 to 49: 40
- 50 or more: 182
Housing units lacking complete kitchen facilities in 2022: 0.7%
House/condo owner moved in on average 15 years ago
Renter moved in on average 4 years ago

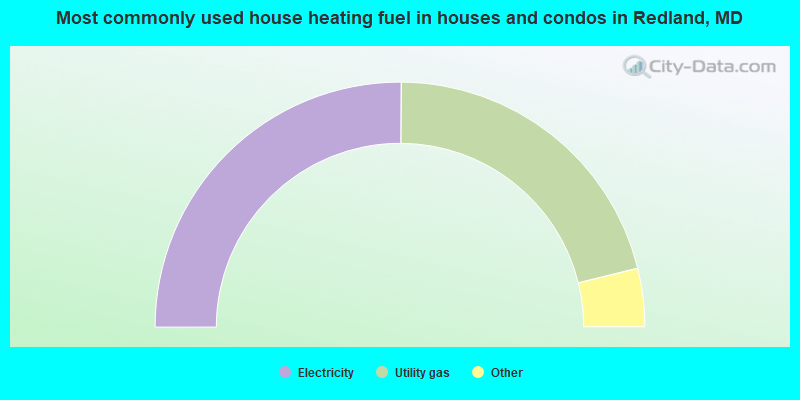
- 50.2%Electricity
- 42.1%Utility gas
- 3.9%Bottled, tank, or LP gas
- 2.3%Fuel oil, kerosene, etc.
- 0.8%Solar energy
- 0.4%Coal or coke
- 0.1%Wood
- 0.1%Other fuel
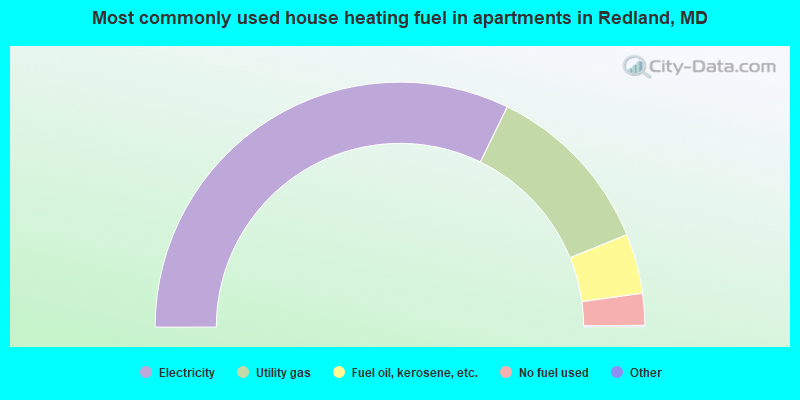
- 64.5%Electricity
- 23.3%Utility gas
- 7.9%Fuel oil, kerosene, etc.
- 4.2%No fuel used
Private vs. public school enrollment:
| Here: | 2.9% |
| Maryland: | 15.2% |
| Here: | 4.5% |
| Maryland: | 14.4% |
| Here: | 23.0% |
| Maryland: | 20.2% |


