Races in Redland, Maryland (MD) Detailed Stats
Data:
Races - White alone (%)
Races - White alone (% change since 2000)
Races - Black alone (%)
Races - Black alone (% change since 2000)
Races - American Indian alone (%)
Races - American Indian alone (% change since 2000)
Races - Asian alone (%)
Races - Asian alone (% change since 2000)
Races - Hispanic (%)
Races - Hispanic (% change since 2000)
Races - Native Hawaiian and Other Pacific Islander alone (%)
Races - Native Hawaiian and Other Pacific Islander alone (% change since 2000)
Races - Two or more races(%)
Races - Two or more races(% change since 2000)
Races - Other race alone (%)
Races - Other race alone (% change since 2000)
Racial diversity
Place of birth - Born in state of residence (%)
Place of birth - Born in state of residence (%) - White
Place of birth - Born in state of residence (%) - Black or African American
Place of birth - Born in state of residence (%) - Asian
Place of birth - Born in state of residence (%) - Hispanic or Latino
Place of birth - Born in state of residence (%) - American Indian and Alaska Native
Place of birth - Born in state of residence (%) - Multirace
Place of birth - Born in state of residence (%) - Other Race
Place of birth - Born in other state (%)
Place of birth - Born in other state (%) - White
Place of birth - Born in other state (%) - Black or African American
Place of birth - Born in other state (%) - Asian
Place of birth - Born in other state (%) - Hispanic or Latino
Place of birth - Born in other state (%) - American Indian and Alaska Native
Place of birth - Born in other state (%) - Multirace
Place of birth - Born in other state (%) - Other Race
Place of birth - Native, outside of US (%)
Place of birth - Native, outside of US (%) - White
Place of birth - Native, outside of US (%) - Black or African American
Place of birth - Native, outside of US (%) - Asian
Place of birth - Native, outside of US (%) - Hispanic or Latino
Place of birth - Native, outside of US (%) - American Indian and Alaska Native
Place of birth - Native, outside of US (%) - Multirace
Place of birth - Native, outside of US (%) - Other Race
Place of birth - Foreign born (%)
Place of birth - Foreign born (%) - White
Place of birth - Foreign born (%) - Black or African American
Place of birth - Foreign born (%) - Asian
Place of birth - Foreign born (%) - Hispanic or Latino
Place of birth - Foreign born (%) - American Indian and Alaska Native
Place of birth - Foreign born (%) - Multirace
Place of birth - Foreign born (%) - Other Race
Residents speaking English at home (%)
Residents speaking English at home - Born in the United States (%)
Residents speaking English at home - Native, born elsewhere (%)
Residents speaking English at home - Foreign born (%)
Residents speaking Spanish at home (%)
Residents speaking Spanish at home - Born in the United States (%)
Residents speaking Spanish at home - Native, born elsewhere (%)
Residents speaking Spanish at home - Foreign born (%)
Residents speaking other language at home (%)
Residents speaking other language at home - Born in the United States (%)
Residents speaking other language at home - Native, born elsewhere (%)
Residents speaking other language at home - Foreign born (%)
Marital status - Never married (%)
Marital status - Now married (%)
Marital status - Separated (%)
Marital status - Widowed (%)
Marital status - Divorced (%)
Ancestries Reported - Arab (%)
Ancestries Reported - Czech (%)
Ancestries Reported - Danish (%)
Ancestries Reported - Dutch (%)
Ancestries Reported - English (%)
Ancestries Reported - French (%)
Ancestries Reported - French Canadian (%)
Ancestries Reported - German (%)
Ancestries Reported - Greek (%)
Ancestries Reported - Hungarian (%)
Ancestries Reported - Irish (%)
Ancestries Reported - Italian (%)
Ancestries Reported - Lithuanian (%)
Ancestries Reported - Norwegian (%)
Ancestries Reported - Polish (%)
Ancestries Reported - Portuguese (%)
Ancestries Reported - Russian (%)
Ancestries Reported - Scotch-Irish (%)
Ancestries Reported - Scottish (%)
Ancestries Reported - Slovak (%)
Ancestries Reported - Subsaharan African (%)
Ancestries Reported - Swedish (%)
Ancestries Reported - Swiss (%)
Ancestries Reported - Ukrainian (%)
Ancestries Reported - United States (%)
Ancestries Reported - Welsh (%)
Ancestries Reported - West Indian (%)
Ancestries Reported - Other (%)
Geographical mobility - Same house 1 year ago (%)
Geographical mobility - Same house 1 year ago (%) - White
Geographical mobility - Same house 1 year ago (%) - Black or African American
Geographical mobility - Same house 1 year ago (%) - Asian
Geographical mobility - Same house 1 year ago (%) - Hispanic or Latino
Geographical mobility - Same house 1 year ago (%) - American Indian and Alaska Native
Geographical mobility - Same house 1 year ago (%) - Multirace
Geographical mobility - Same house 1 year ago (%) - Other Race
Geographical mobility - Moved within same county (%)
Geographical mobility - Moved within same county (%) - White
Geographical mobility - Moved within same county (%) - Black or African American
Geographical mobility - Moved within same county (%) - Asian
Geographical mobility - Moved within same county (%) - Hispanic or Latino
Geographical mobility - Moved within same county (%) - American Indian and Alaska Native
Geographical mobility - Moved within same county (%) - Multirace
Geographical mobility - Moved within same county (%) - Other Race
Geographical mobility - Moved from different county within same state (%)
Geographical mobility - Moved from different county within same state (%) - White
Geographical mobility - Moved from different county within same state (%) - Black or African American
Geographical mobility - Moved from different county within same state (%) - Asian
Geographical mobility - Moved from different county within same state (%) - Hispanic or Latino
Geographical mobility - Moved from different county within same state (%) - American Indian and Alaska Native
Geographical mobility - Moved from different county within same state (%) - Multirace
Geographical mobility - Moved from different county within same state (%) - Other Race
Geographical mobility - Moved from different state (%)
Geographical mobility - Moved from different state (%) - White
Geographical mobility - Moved from different state (%) - Black or African American
Geographical mobility - Moved from different state (%) - Asian
Geographical mobility - Moved from different state (%) - Hispanic or Latino
Geographical mobility - Moved from different state (%) - American Indian and Alaska Native
Geographical mobility - Moved from different state (%) - Multirace
Geographical mobility - Moved from different state (%) - Other Race
Geographical mobility - Moved from abroad (%)
Geographical mobility - Moved from abroad (%) - White
Geographical mobility - Moved from abroad (%) - Black or African American
Geographical mobility - Moved from abroad (%) - Asian
Geographical mobility - Moved from abroad (%) - Hispanic or Latino
Geographical mobility - Moved from abroad (%) - American Indian and Alaska Native
Geographical mobility - Moved from abroad (%) - Multirace
Geographical mobility - Moved from abroad (%) - Other Race
Place of birth for the foreign-born population - Ireland (%)
Place of birth for the foreign-born population - Denmark (%)
Place of birth for the foreign-born population - Norway (%)
Place of birth for the foreign-born population - Sweden (%)
Place of birth for the foreign-born population - United Kingdom (%)
Place of birth for the foreign-born population - England (%)
Place of birth for the foreign-born population - Scotland (%)
Place of birth for the foreign-born population - Other Northern Europe (%)
Place of birth for the foreign-born population - Austria (%)
Place of birth for the foreign-born population - Belgium (%)
Place of birth for the foreign-born population - France (%)
Place of birth for the foreign-born population - Germany (%)
Place of birth for the foreign-born population - Netherlands (%)
Place of birth for the foreign-born population - Switzerland (%)
Place of birth for the foreign-born population - Other Western Europe (%)
Place of birth for the foreign-born population - Greece (%)
Place of birth for the foreign-born population - Italy (%)
Place of birth for the foreign-born population - Portugal (%)
Place of birth for the foreign-born population - Spain (%)
Place of birth for the foreign-born population - Other Southern Europe (%)
Place of birth for the foreign-born population - Albania (%)
Place of birth for the foreign-born population - Belarus (%)
Place of birth for the foreign-born population - Bosnia and Herzegovina (%)
Place of birth for the foreign-born population - Bulgaria (%)
Place of birth for the foreign-born population - Croatia (%)
Place of birth for the foreign-born population - Czechoslovakia (%)
Place of birth for the foreign-born population - Hungary (%)
Place of birth for the foreign-born population - Latvia (%)
Place of birth for the foreign-born population - Lithuania (%)
Place of birth for the foreign-born population - North Macedonia (Macedonia) (%)
Place of birth for the foreign-born population - Moldova (%)
Place of birth for the foreign-born population - Poland (%)
Place of birth for the foreign-born population - Romania (%)
Place of birth for the foreign-born population - Russia (%)
Place of birth for the foreign-born population - Serbia (%)
Place of birth for the foreign-born population - Ukraine (%)
Place of birth for the foreign-born population - Other Eastern Europe (%)
Place of birth for the foreign-born population - China (%)
Place of birth for the foreign-born population - Hong Kong (%)
Place of birth for the foreign-born population - Taiwan (%)
Place of birth for the foreign-born population - Japan (%)
Place of birth for the foreign-born population - Korea (%)
Place of birth for the foreign-born population - Other Eastern Asia (%)
Place of birth for the foreign-born population - Afghanistan (%)
Place of birth for the foreign-born population - Bangladesh (%)
Place of birth for the foreign-born population - India (%)
Place of birth for the foreign-born population - Iran (%)
Place of birth for the foreign-born population - Kazakhstan (%)
Place of birth for the foreign-born population - Nepal (%)
Place of birth for the foreign-born population - Pakistan (%)
Place of birth for the foreign-born population - Sri Lanka (%)
Place of birth for the foreign-born population - Uzbekistan (%)
Place of birth for the foreign-born population - Other South Central Asia (%)
Place of birth for the foreign-born population - Burma (%)
Place of birth for the foreign-born population - Cambodia (%)
Place of birth for the foreign-born population - Indonesia (%)
Place of birth for the foreign-born population - Laos (%)
Place of birth for the foreign-born population - Malaysia (%)
Place of birth for the foreign-born population - Philippines (%)
Place of birth for the foreign-born population - Singapore (%)
Place of birth for the foreign-born population - Thailand (%)
Place of birth for the foreign-born population - Vietnam (%)
Place of birth for the foreign-born population - Other South Eastern Asia (%)
Place of birth for the foreign-born population - Armenia (%)
Place of birth for the foreign-born population - Iraq (%)
Place of birth for the foreign-born population - Israel (%)
Place of birth for the foreign-born population - Jordan (%)
Place of birth for the foreign-born population - Kuwait (%)
Place of birth for the foreign-born population - Lebanon (%)
Place of birth for the foreign-born population - Saudi Arabia (%)
Place of birth for the foreign-born population - Syria (%)
Place of birth for the foreign-born population - Turkey (%)
Place of birth for the foreign-born population - Yemen (%)
Place of birth for the foreign-born population - Other Western Asia (%)
Place of birth for the foreign-born population - Eritrea (%)
Place of birth for the foreign-born population - Ethiopia (%)
Place of birth for the foreign-born population - Kenya (%)
Place of birth for the foreign-born population - Somalia (%)
Place of birth for the foreign-born population - Uganda (%)
Place of birth for the foreign-born population - Zimbabwe (%)
Place of birth for the foreign-born population - Other Eastern Africa (%)
Place of birth for the foreign-born population - Cameroon (%)
Place of birth for the foreign-born population - Congo (%)
Place of birth for the foreign-born population - Democratic Republic of Congo (Zaire) (%)
Place of birth for the foreign-born population - Other Middle Africa (%)
Place of birth for the foreign-born population - Egypt (%)
Place of birth for the foreign-born population - Morocco (%)
Place of birth for the foreign-born population - Sudan (%)
Place of birth for the foreign-born population - Other Northern Africa (%)
Place of birth for the foreign-born population - South Africa (%)
Place of birth for the foreign-born population - Other Southern Africa (%)
Place of birth for the foreign-born population - Cabo Verde (%)
Place of birth for the foreign-born population - Ghana (%)
Place of birth for the foreign-born population - Liberia (%)
Place of birth for the foreign-born population - Nigeria (%)
Place of birth for the foreign-born population - Senegal (%)
Place of birth for the foreign-born population - Sierra Leone (%)
Place of birth for the foreign-born population - Other Western Africa (%)
Place of birth for the foreign-born population - Australia (%)
Place of birth for the foreign-born population - New Zealand (%)
Place of birth for the foreign-born population - Fiji (%)
Place of birth for the foreign-born population - Micronesia (%)
Place of birth for the foreign-born population - Bahamas (%)
Place of birth for the foreign-born population - Barbados (%)
Place of birth for the foreign-born population - Cuba (%)
Place of birth for the foreign-born population - Dominica (%)
Place of birth for the foreign-born population - Dominican Republic (%)
Place of birth for the foreign-born population - Grenada (%)
Place of birth for the foreign-born population - Haiti (%)
Place of birth for the foreign-born population - Jamaica (%)
Place of birth for the foreign-born population - St. Vincent and the Grenadines (%)
Place of birth for the foreign-born population - Trinidad and Tobago (%)
Place of birth for the foreign-born population - West Indies (%)
Place of birth for the foreign-born population - Other Caribbean (%)
Place of birth for the foreign-born population - Belize (%)
Place of birth for the foreign-born population - Costa Rica (%)
Place of birth for the foreign-born population - El Salvador (%)
Place of birth for the foreign-born population - Guatemala (%)
Place of birth for the foreign-born population - Honduras (%)
Place of birth for the foreign-born population - Mexico (%)
Place of birth for the foreign-born population - Nicaragua (%)
Place of birth for the foreign-born population - Panama (%)
Place of birth for the foreign-born population - Other Central America (%)
Place of birth for the foreign-born population - Argentina (%)
Place of birth for the foreign-born population - Bolivia (%)
Place of birth for the foreign-born population - Brazil (%)
Place of birth for the foreign-born population - Chile (%)
Place of birth for the foreign-born population - Colombia (%)
Place of birth for the foreign-born population - Ecuador (%)
Place of birth for the foreign-born population - Guyana (%)
Place of birth for the foreign-born population - Peru (%)
Place of birth for the foreign-born population - Uruguay (%)
Place of birth for the foreign-born population - Venezuela (%)
Place of birth for the foreign-born population - Other South America (%)
Place of birth for the foreign-born population - Canada (%)
Place of birth for the foreign-born population - Other Northern America (%)
Place of birth for the foreign-born population - Other (%)
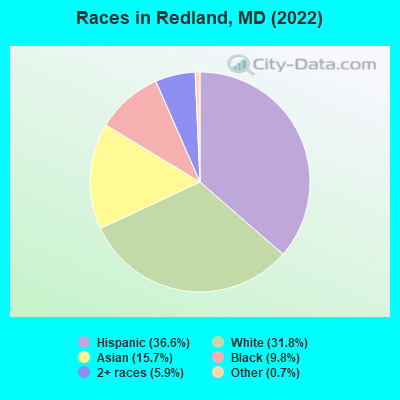
According to 2022 data, the most numerous races in Redland, MD are White alone (5,818 residents), Black alone (1,793 residents), and Hispanic (6,690 residents). 45.2% of Redland residents speak English at home. 41.5% of Redland, MD residents are foreign-born (20.6% born in Latin America, 14.0% born in Asia), which is 61.4% greater than the foreign-born rate of 16.0% across the entire state of Maryland.
Race distribution in Redland
2000 2022
3,286,547 62.1% White alone 1,464,735 27.7% Black alone 227,916 4.3% Hispanic 209,738 4.0% Asian alone 82,946 1.6% Two or more races 13,312 0.3% American Indian alone 9,379 0.2% Other race alone 1,913 0.04% Native Hawaiian and Other
2,906,492 47.1% White alone 1,800,914 29.2% Black alone 705,842 11.4% Hispanic 401,818 6.5% Asian alone 291,317 4.7% Two or more races 46,930 0.8% Other race alone 8,930 0.1% American Indian alone 2,417 0.04% Native Hawaiian and Other
Income and house value in Redland Median household income in 2022 $136,221 White non-Hispanic householders$105,753 Black householders$117,791 American Indian and Alaska Native householders$132,317 Asian householders$76,441 Some other race householders$128,999 Two or more races householders$81,975 Hispanic or Latino race householdersMedian 2022 house value $552,027 White Non-Hispanic householders$349,143 Black or African American householders$242,495 American Indian or Alaska Native householders $467,978 Asian householders$290,233 Some other race householders$360,061 Two or more races householders$346,096 Hispanic or Latino householders
Median age by race in Redland
42.7 Median age for White residents39.7 45.7 40.8 Median age for Black or African American residents39.1 43.4 31.9 Median age for American Indian / Alaska Native residents18.2 57.1 56.1 Median age for Asian residents50.8 59.3 -763,333,332.6 Median age for Native Hawaiian / Pacific Islander residents-720,061,021.4 -760,942,760.2 33.6 Median age for Other race residents40.7 29.9 33.8 Median age for Two or more races residents30.7 48.3 45.0 Median age for White alone residents41.9 49.4 32.2 Median age for Hispanic or Latino residents34.6 31.8
Owner/renter occupied households by race in Redland
House owners and renters - White residents 2,365 87.5% Owner occupied337 12.5% Renter occupiedHouse owners and renters - Black or African American residents 276 52.5% Owner occupied250 47.5% Renter occupiedHouse owners and renters - American Indian / Alaska Native residents 66 100.0% Owner occupiedHouse owners and renters - Asian residents 871 88.3% Owner occupied116 11.7% Renter occupiedHouse owners and renters - Other race residents 683 65.9% Owner occupied354 34.1% Renter occupiedHouse owners and renters - Two or more races residents 474 74.4% Owner occupied163 25.6% Renter occupiedHouse owners and renters - White alone residents 2,257 88.9% Owner occupied281 11.1% Renter occupiedHouse owners and renters - Hispanic or Latino residents 901 63.7% Owner occupied513 36.3% Renter occupied
Language usage in Redland
English speakers - Total 45.2% of residents of Redland speak English at home.
34.4% of residents speak Spanish at home 2,583 44.1% Speak English very well3,276 55.9% Speak English less than very well20.8% of residents speak other language at home 2,106 59.4% Speak English very well1,442 40.6% Speak English less than very well
English speakers - Born in the United States 81.8% of residents of Redland speak English at home.
11.6% of residents speak Spanish at home 316 52.5% Speak English very well286 47.5% Speak English less than very well4.0% of residents speak other language at home 172 83.1% Speak English very well35 16.9% Speak English less than very well
English speakers - Native, born elsewhere 21.9% of residents of Redland speak English at home.
46.6% of residents speak Spanish at home 140 65.1% Speak English very well75 34.9% Speak English less than very well33.4% of residents speak other language at home 154 100.0% Speak English very well
English speakers - Foreign-born 13.4% of residents of Redland speak English at home.
47.5% of residents speak Spanish at home 798 22.3% Speak English very well2,786 77.7% Speak English less than very well39.9% of residents speak other language at home 1,639 54.4% Speak English very well1,375 45.6% Speak English less than very well
White (Caucasian) - Speak only English Native:
93.2% (4,630)Foreign-born:
8.2% (101)
White (Caucasian) - Speak another language Native:
6.9% (343)Foreign-born:
88.8% (1,098)
Black or African American - Speak only English Native:
89.1% (935)Foreign-born:
35.7% (211)
Black or African American - Speak another language Native:
10.6% (111)Foreign-born:
61.0% (361)
American Indian / Alaska Native - Speak another language Native:
100.0% (98)Foreign-born:
100.0% (233)
Asian - Speak only English Native:
51.8% (252)Foreign-born:
17.1% (401)
Asian - Speak another language Native:
47.3% (230)Foreign-born:
83.1% (1,948)
Other race - Speak only English Native:
12.4% (222)Foreign-born:
10.3% (251)
Other race - Speak another language Native:
84.5% (1,510)Foreign-born:
88.7% (2,173)
Two or more races - Speak only English Native:
50.3% (698)Foreign-born:
8.6% (83)
Two or more races - Speak another language Native:
53.1% (736)Foreign-born:
91.1% (878)
White alone - Speak only English Native:
97.1% (4,555)Foreign-born:
15.5% (102)
White alone - Speak another language Native:
3.2% (149)Foreign-born:
85.2% (560)
Hispanic or Latino - Speak only English Native:
11.0% (277)Foreign-born:
5.4% (200)
Hispanic or Latino - Speak another language Native:
87.1% (2,205)Foreign-born:
94.5% (3,476)
Foreign-born residents in Redland 7,581 residents are foreign born (20.6% Latin America , 14.0% Asia ).
This city:
41.5%Maryland:
15.7%
Marital status for residents in Redland Marital status - White (Caucasian) population 15 years and over
Males 26.4% Never married67.2% Now married0.0% Separated3.2% Widowed3.2% DivorcedFemales 22.8% Never married57.0% Now married0.6% Separated9.3% Widowed10.3% DivorcedWomen who gave birth in the past 12 months Now married:
96.4% (92)Unmarried:
3.6% (3)
Women who did not give birth in the past 12 months Now married:
52.9% (714)Unmarried:
47.1% (637)
Marital status - Black or African American population 15 years and over
Males 38.5% Never married56.0% Now married1.2% Separated2.5% Widowed1.8% DivorcedFemales 35.7% Never married49.8% Now married3.3% Separated2.9% Widowed8.3% DivorcedWomen who gave birth in the past 12 months Now married:
100.0% (30)Unmarried:
0.0% (0)
Women who did not give birth in the past 12 months Now married:
41.5% (199)Unmarried:
58.5% (281)
Marital status - American Indian / Alaska Native population 15 years and over
Males 59.0% Never married32.9% Now married8.1% Separated0.0% Widowed0.0% DivorcedFemales 0.0% Never married67.6% Now married0.0% Separated32.4% Widowed0.0% DivorcedWomen who did not give birth in the past 12 months Now married:
100.0% (40)Unmarried:
0.0% (0)
Marital status - Asian population 15 years and over
Males 26.2% Never married67.9% Now married3.3% Separated0.0% Widowed2.6% DivorcedFemales 21.7% Never married64.7% Now married0.3% Separated6.7% Widowed6.7% DivorcedWomen who gave birth in the past 12 months Now married:
100.0% (24)Unmarried:
0.0% (0)
Women who did not give birth in the past 12 months Now married:
54.2% (323)Unmarried:
45.8% (273)
Marital status - Other race population 15 years and over
Males 35.6% Never married59.5% Now married0.0% Separated4.1% Widowed0.8% DivorcedFemales 36.8% Never married57.4% Now married0.9% Separated1.2% Widowed3.8% DivorcedWomen who gave birth in the past 12 months Now married:
34.7% (74)Unmarried:
65.3% (138)
Women who did not give birth in the past 12 months Now married:
49.8% (480)Unmarried:
50.2% (484)
Marital status - Two or more races population 15 years and over
Males 56.8% Never married43.2% Now married0.0% Separated0.0% Widowed0.0% DivorcedFemales 30.9% Never married46.2% Now married0.9% Separated8.2% Widowed13.7% DivorcedWomen who gave birth in the past 12 months Now married:
100.0% (116)Unmarried:
0.0% (0)
Women who did not give birth in the past 12 months Now married:
40.7% (257)Unmarried:
59.3% (375)
Marital status - White alone, not Hispanic / Latino population 15 years and over
Males 24.7% Never married68.2% Now married0.0% Separated3.9% Widowed3.2% DivorcedFemales 20.2% Never married57.5% Now married0.7% Separated11.2% Widowed10.4% DivorcedWomen who gave birth in the past 12 months Now married:
96.4% (100)Unmarried:
3.6% (4)
Women who did not give birth in the past 12 months Now married:
55.3% (592)Unmarried:
44.7% (478)
Marital status - Hispanic or Latino population 15 years and over
Males 38.4% Never married57.4% Now married0.6% Separated2.4% Widowed1.2% DivorcedFemales 37.8% Never married49.1% Now married0.8% Separated3.6% Widowed8.7% DivorcedWomen who gave birth in the past 12 months Now married:
36.9% (66)Unmarried:
63.1% (113)
Women who did not give birth in the past 12 months Now married:
42.7% (663)Unmarried:
57.3% (889)
Ancestries in Redland
469 3.9% Kenyan463 3.9% German266 2.2% Arab259 2.2% European251 2.1% Iranian209 1.7% Irish189 1.6% Polish186 1.6% American181 1.5% African168 1.4% Italian156 1.3% Ethiopian143 1.2% English132 1.1% Romanian71 0.6% Jamaican71 0.6% Greek70 0.6% Eastern European62 0.5% Nigerian58 0.5% Scottish54 0.5% Russian51 0.4% Ukrainian42 0.4% Trinidadian and Tobagonian39 0.3% Egyptian39 0.3% Danish32 0.3% British27 0.2% Czechoslovakian27 0.2% Welsh24 0.2% Ghanaian23 0.2% Croatian20 0.2% Armenian15 0.1% British West Indian13 0.1% Barbadian11 0.09% French Canadian11 0.09% Scotch-Irish10 0.08% Dutch10 0.08% Austrian9 0.08% Palestinian7 0.06% Guyanese6 0.05% Swedish5 0.04% Celtic5 0.04% Jordanian4 0.03% Norwegian2 0.02% French
Geographical mobility in Redland Same house 1 year ago 6,376 95.8% White (Caucasian)1,761 98.0% Black or African American416 98.9% American Indian / Alaska Native2,658 92.5% Asian3,943 88.0% Other race2,439 100.0% Two or more races5,408 94.7% White alone, not Hispanic / Latino6,119 94.1% Hispanic or LatinoMoved within same county 209 3.1% White / Caucasian40 2.2% Black or African American73 2.5% Asian566 12.6% Other race32 1.3% Two or more races213 3.7% White alone, not Hispanic / Latino426 6.5% Hispanic or LatinoMoved within same state 36 0.5% White / Caucasian2 0.1% Asian22 0.5% Other race12 0.5% Two or more races39 0.7% White alone, not Hispanic / Latino20 0.3% Hispanic or LatinoMoved from different state 30 0.5% White / Caucasian1 0.1% Black or African American32 0.6% White alone, not Hispanic / LatinoMoved from abroad 53 0.8% White207 7.2% Asian54 1.0% White alone, not Hispanic / Latino9 0.1% Hispanic or Latino
Children Nativity (place of birth) in Redland
Children under 6 years - Living with two parents Both parents native 618 100.0% NativeBoth parents foreign-born 183 83.1% Native37 16.9% Foreign-bornOne native, one foreign-born parent 126 100.0% NativeChildren under 6 years - Living with one parent Native parent 49 100.0% NativeForeign-born parent 253 88.4% Native33 11.6% Foreign-bornChildren 6 to 17 years - Living with two parents Both parents native 608 97.0% Native19 3.0% Foreign-bornBoth parents foreign-born 680 62.6% Native406 37.4% Foreign-bornOne native, one foreign-born parent 258 97.3% Native7 2.7% Foreign-bornChildren 6 to 17 years - Living with one parent Native parent 47 100.0% NativeForeign-born parent 509 58.5% Native361 41.5% Foreign-born
Grandparents responsible for own grandchildren in Redland
Grandparents (30 to 59 years) White / Caucasian 3 6.7% Responsible for grandchildren40 93.3% Not responsible for grandchildrenBlack or African American 2 100.0% Not responsible for grandchildrenAmerican Indian / Alaska Native 14 51.9% Responsible for grandchildren13 48.1% Not responsible for grandchildrenAsian 4 100.0% Responsible for grandchildrenOther race 92 63.5% Responsible for grandchildren53 36.5% Not responsible for grandchildrenWhite alone, not Hispanic / Latino 3 100.0% Responsible for grandchildrenHispanic or Latino 188 66.3% Responsible for grandchildren96 33.7% Not responsible for grandchildrenGrandparents (60 years and over) White / Caucasian 5 4.8% Responsible for grandchildren102 95.2% Not responsible for grandchildrenBlack or African American 11 14.1% Responsible for grandchildren67 85.9% Not responsible for grandchildrenAmerican Indian / Alaska Native 40 100.0% Not responsible for grandchildrenAsian 210 100.0% Not responsible for grandchildrenOther race 111 100.0% Not responsible for grandchildrenWhite alone, not Hispanic / Latino 4 5.6% Responsible for grandchildren71 94.4% Not responsible for grandchildrenHispanic or Latino 154 100.0% Not responsible for grandchildren