Pawtucket, RI (Rhode Island) Houses and Residents
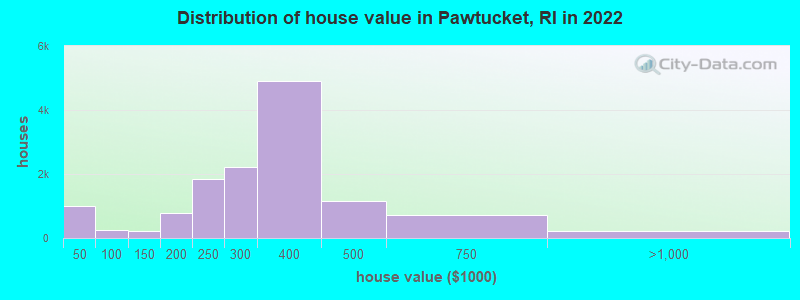
Estimated median house or condo value in 2022: $326,300 (it was $101,800 in 2000 )
Pawtucket:
$326,300Rhode Island:
$383,900
Lower value quartile - upper value quartile: $259,000 - $387,000Mean price in 2022: Detached houses: $310,765 Here:
$310,765State:
$445,354
Townhouses or other attached units: $282,101 Here:
$282,101State:
$371,092
In 2-unit structures: $277,813 Here:
$277,813State:
$317,098
In 3-to-4-unit structures: $318,176 Here:
$318,176State:
$315,052
In 5-or-more-unit structures: $175,179 Here:
$175,179State:
$291,252
Mobile homes: $61,238 Here:
$61,238State:
$105,454
Total population: 71,499 (All urban)
Houses: 33,635 (32,229 occupied: 15,501 owner occupied, 16,728 renter occupied )
% of renters here:
52%State:
37%
Housing density: 3,850 houses/condos per square mile
Median price asked for vacant for-sale houses and condos in 2022: $192,304.
Median contract rent in 2022: $922 (lower quartile is $649, upper quartile is $1,192)
Median rent asked for vacant for-rent units in 2022: $611
Median gross rent in Pawtucket, RI in 2022: $1,070
Housing units in Pawtucket with a mortgage: 11,379 (681 second mortgage, 0 home equity loan, 530 both second mortgage and home equity loan )Houses without a mortgage: 326
Median household income for houses/condos with a mortgage: $97,410
Median household income for apartments without a mortgage: $67,544
Median monthly housing costs: $1,222
Data:
Median house or condo value ($)
Median house or condo value ($ change since 2000)
Median house or condo value ($) - White
Median house or condo value ($) - Black or African American
Median house or condo value ($) - Asian
Median house or condo value ($) - Hispanic or Latino
Median house or condo value ($) - American Indian and Alaska Native
Median house or condo value ($) - Multirace
Median house or condo value ($) - Other Race
Median price asked for mobile homes ($)
Household density (households per square mile)
Mean house or condo value by units in structure - 1, detached ($)
Mean house or condo value by units in structure - 1, attached ($)
Mean house or condo value by units in structure - 2 ($)
Mean house or condo value by units in structure by units in structure - 3 or 4 ($)
Mean house or condo value by units in structure - 5 or more ($)
Mean house or condo value by units in structure - Boat, RV, van, etc. ($)
Mean house or condo value by units in structure - Mobile home ($)
Median contract rent ($)
Median contract rent - Lower quartile ($)
Median contract rent - Upper quartile ($)
Median gross rent ($)
Urban houses (%)
Rural houses (%)
Houses occupied (%)
Houses occupied (% change since 2000)
Houses owner occupied (%)
Houses owner occupied (% change since 2000)
Houses renter occupied (%)
Houses renter occupied (% change since 2000)
Vacant housing units - For rent (%)
Vacant housing units - For rent (% change since 2000)
Vacant housing units - For sale only (%)
Vacant housing units - For sale only (% change since 2000)
Vacant housing units - Rented or sold, not occupied (%)
Vacant housing units - Rented or sold, not occupied (% change since 2000)
Vacant housing units - For seasonal, recreational, or occasional use (%)
Vacant housing units - For seasonal, recreational, or occasional use (% change since 2000)
Vacant housing units - For migrant workers (%)
Vacant housing units - For migrant workers (% change since 2000)
Vacant housing units - Other vacant (%)
Vacant housing units - Other vacant (% change since 2000)
Median monthly housing costs ($)
Median household income for houses/condos with a mortgage ($)
Median household income for houses/condos without a mortgage ($)
Median household income ($)
Median household income ($) - White
Median household income ($) - Black or African American
Median household income ($) - Asian
Median household income ($) - Hispanic or Latino
Median household income ($) - American Indian and Alaska Native
Median household income ($) - Multirace
Median household income ($) - Other Race
Mortgage status - with mortgage (%)
Mortgage status - with second mortgage (%)
Mortgage status - with home equity loan (%)
Mortgage status - with both second mortgage and home equity loan (%)
Mortgage status - without a mortgage (%)
Median year house/condo built
Median year apartment built
Household type by relationship - Male householder living alone (%)
Household type by relationship - Male householder not living alone (%)
Household type by relationship - Female householder living alone (%)
Household type by relationship - Female householder not living alone (%)
Household type by relationship - Opposite-Sex spouse (%)
Household type by relationship - Same-Sex spouse (%)
Household type by relationship - Opposite-Sex unmarried partner (%)
Household type by relationship - Same-Sex unmarried partner (%)
Household type by relationship - In group quarters (%)
Size of family households - 2-person household (%)
Size of family households - 3-person household (%)
Size of family households - 4-person household (%)
Size of family households - 5-person household (%)
Size of family households - 6-person household (%)
Size of family households - 7-or-more-person household (%)
Size of nonfamily households - 1-person household (%)
Size of nonfamily households - 2-person household (%)
Size of nonfamily households - 3-person household (%)
Size of nonfamily households - 4-person household (%)
Size of nonfamily households - 5-person household (%)
Size of nonfamily households - 6-person household (%)
Size of nonfamily households - 7-or-moreperson household (%)
Year house built - Built 2010 or later (%)
Year house built - Built 2000 to 2009 (%)
Year house built - Built 1990 to 1999 (%)
Year house built - Built 1980 to 1989 (%)
Year house built - Built 1970 to 1979 (%)
Year house built - Built 1960 to 1969 (%)
Year house built - Built 1950 to 1959 (%)
Year house built - Built 1940 to 1949 (%)
Year house built - Built 1939 or earlier (%)
Median number of rooms in houses and condos
Median number of rooms in apartments
Median number of bedrooms in owner occupied houses
Mean number of bedrooms in owner occupied houses
Median number of bedrooms in renter occupied houses
Mean number of bedrooms in renter occupied houses
Median number of vehichles in owner occupied houses
Mean number of vehichles in owner occupied houses
Median number of vehichles in renter occupied houses
Mean number of vehichles in renter occupied houses
Rooms in owner-occupied houses - 1 room (%)
Rooms in owner-occupied houses - 2 rooms (%)
Rooms in owner-occupied houses - 3 rooms (%)
Rooms in owner-occupied houses - 4 rooms (%)
Rooms in owner-occupied houses - 5 rooms (%)
Rooms in owner-occupied houses - 6 rooms (%)
Rooms in owner-occupied houses - 7 rooms (%)
Rooms in owner-occupied houses - 8 rooms (%)
Rooms in owner-occupied houses - 9+ rooms (%)
Rooms in renter-occupied houses - 1 room (%)
Rooms in renter-occupied houses - 2 rooms (%)
Rooms in renter-occupied houses - 3 rooms (%)
Rooms in renter-occupied houses - 4 rooms (%)
Rooms in renter-occupied houses - 5 rooms (%)
Rooms in renter-occupied houses - 6 rooms (%)
Rooms in renter-occupied houses - 7 rooms (%)
Rooms in renter-occupied houses - 8 rooms (%)
Rooms in renter-occupied houses - 9+ rooms (%)
Bedrooms in owner-occupied houses - no bedrooms (%)
Bedrooms in owner-occupied houses - 1 bedroom (%)
Bedrooms in owner-occupied houses - 2 bedrooms (%)
Bedrooms in owner-occupied houses - 3 bedrooms (%)
Bedrooms in owner-occupied houses - 4 bedrooms (%)
Bedrooms in owner-occupied houses - 5+ bedrooms (%)
Bedrooms in renter-occupied houses - no bedrooms (%)
Bedrooms in renter-occupied houses - 1 bedroom (%)
Bedrooms in renter-occupied houses - 2 bedrooms (%)
Bedrooms in renter-occupied houses - 3 bedrooms (%)
Bedrooms in renter-occupied houses - 4 bedrooms (%)
Bedrooms in renter-occupied houses - 5+ bedrooms (%)
Vehicles available in owner-occupied houses - no vehicle available (%)
Vehicles available in owner-occupied houses - 1 vehicle available(%)
Vehicles available in owner-occupied houses - 2 Vehicles available (%)
Vehicles available in owner-occupied houses - 3 Vehicles available (%)
Vehicles available in owner-occupied houses - 4 Vehicles available (%)
Vehicles available in owner-occupied houses - 5+ Vehicles available (%)
Vehicles available in renter-occupied houses - no vehicle available (%)
Vehicles available in renter-occupied houses - 1 vehicle available (%)
Vehicles available in renter-occupied houses - 2 Vehicles available (%)
Vehicles available in renter-occupied houses - 3 Vehicles available (%)
Vehicles available in renter-occupied houses - 4 Vehicles available (%)
Vehicles available in renter-occupied houses - 5+ Vehicles available (%)
Housing units in structures - 1, detached (%)
Housing units in structures - 1, attached (%)
Housing units in structures - 2 (%)
Housing units in structures - 3 or 4 (%)
Housing units in structures - 5 to 9 (%)
Housing units in structures - 10 to 19 (%)
Housing units in structures - 20 to 49 (%)
Housing units in structures - 50 or more (%)
Housing units in structures - Mobile home (%)
Housing units in structures - Boat, RV, van, etc. (%)
Housing units in structures - Owners - 1, detached (%)
Housing units in structures - Owners - 1, attached (%)
Housing units in structures - Owners - 2 (%)
Housing units in structures - Owners - 3 or 4 (%)
Housing units in structures - Owners - 5 to 9 (%)
Housing units in structures - Owners - 10 to 19 (%)
Housing units in structures - Owners - 20 to 49 (%)
Housing units in structures - Owners - 50 or more (%)
Housing units in structures - Owners - Mobile home (%)
Housing units in structures - Owners - Boat, RV, van, etc. (%)
Housing units in structures - Renters - 1, detached (%)
Housing units in structures - Renters - 1, attached (%)
Housing units in structures - Renters - 2 (%)
Housing units in structures - Renters - 3 or 4 (%)
Housing units in structures - Renters - 5 to 9 (%)
Housing units in structures - Renters - 10 to 19 (%)
Housing units in structures - Renters - 20 to 49 (%)
Housing units in structures - Renters - 50 or more (%)
Housing units in structures - Renters - Mobile home (%)
Housing units in structures - Renters - Boat, RV, van, etc. (%)
House/condo owner moved in on average (years ago)
Renter moved in on average (years ago)
Year householder moved into unit - Moved in 1999 to March 2000 (%)
Year householder moved into unit - Moved in 1999 to March 2000 (%) - White
Year householder moved into unit - Moved in 1999 to March 2000 (%) - Black or African American
Year householder moved into unit - Moved in 1999 to March 2000 (%) - Asian
Year householder moved into unit - Moved in 1999 to March 2000 (%) - Hispanic or Latino
Year householder moved into unit - Moved in 1999 to March 2000 (%) - American Indian and Alaska Native
Year householder moved into unit - Moved in 1999 to March 2000 (%) - Multirace
Year householder moved into unit - Moved in 1999 to March 2000 (%) - Other Race
Year householder moved into unit - Moved in 1995 to 1998 (%)
Year householder moved into unit - Moved in 1995 to 1998 (%) - White
Year householder moved into unit - Moved in 1995 to 1998 (%) - Black or African American
Year householder moved into unit - Moved in 1995 to 1998 (%) - Asian
Year householder moved into unit - Moved in 1995 to 1998 (%) - Hispanic or Latino
Year householder moved into unit - Moved in 1995 to 1998 (%) - American Indian and Alaska Native
Year householder moved into unit - Moved in 1995 to 1998 (%) - Multirace
Year householder moved into unit - Moved in 1995 to 1998 (%) - Other Race
Year householder moved into unit - Moved in 1990 to 1994 (%)
Year householder moved into unit - Moved in 1990 to 1994 (%) - White
Year householder moved into unit - Moved in 1990 to 1994 (%) - Black or African American
Year householder moved into unit - Moved in 1990 to 1994 (%) - Asian
Year householder moved into unit - Moved in 1990 to 1994 (%) - Hispanic or Latino
Year householder moved into unit - Moved in 1990 to 1994 (%) - American Indian and Alaska Native
Year householder moved into unit - Moved in 1990 to 1994 (%) - Multirace
Year householder moved into unit - Moved in 1990 to 1994 (%) - Other Race
Year householder moved into unit - Moved in 1980 to 1989 (%)
Year householder moved into unit - Moved in 1980 to 1989 (%) - White
Year householder moved into unit - Moved in 1980 to 1989 (%) - Black or African American
Year householder moved into unit - Moved in 1980 to 1989 (%) - Asian
Year householder moved into unit - Moved in 1980 to 1989 (%) - Hispanic or Latino
Year householder moved into unit - Moved in 1980 to 1989 (%) - American Indian and Alaska Native
Year householder moved into unit - Moved in 1980 to 1989 (%) - Multirace
Year householder moved into unit - Moved in 1980 to 1989 (%) - Other Race
Year householder moved into unit - Moved in 1970 to 1979 (%)
Year householder moved into unit - Moved in 1970 to 1979 (%) - White
Year householder moved into unit - Moved in 1970 to 1979 (%) - Black or African American
Year householder moved into unit - Moved in 1970 to 1979 (%) - Asian
Year householder moved into unit - Moved in 1970 to 1979 (%) - Hispanic or Latino
Year householder moved into unit - Moved in 1970 to 1979 (%) - American Indian and Alaska Native
Year householder moved into unit - Moved in 1970 to 1979 (%) - Multirace
Year householder moved into unit - Moved in 1970 to 1979 (%) - Other Race
Year householder moved into unit - Moved in 1969 or earlier (%)
Year householder moved into unit - Moved in 1969 or earlier (%) - White
Year householder moved into unit - Moved in 1969 or earlier (%) - Black or African American
Year householder moved into unit - Moved in 1969 or earlier (%) - Asian
Year householder moved into unit - Moved in 1969 or earlier (%) - Hispanic or Latino
Year householder moved into unit - Moved in 1969 or earlier (%) - American Indian and Alaska Native
Year householder moved into unit - Moved in 1969 or earlier (%) - Multirace
Year householder moved into unit - Moved in 1969 or earlier (%) - Other Race
Housing units lacking complete plumbing facilities (%)
Housing units lacking complete kitchen facilities (%)
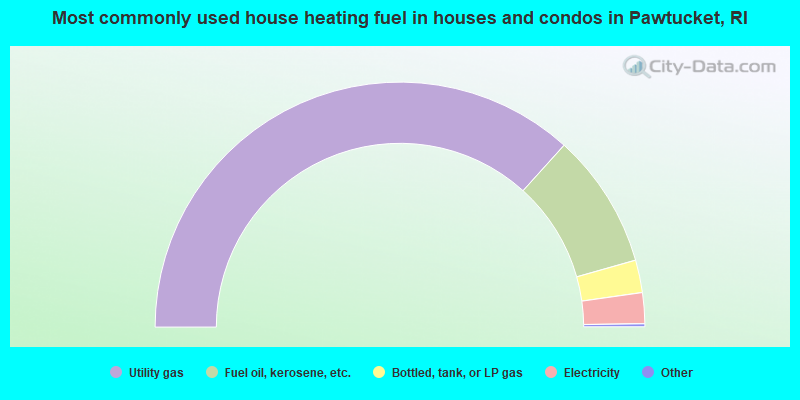
House heating fuel used in houses and condos - Utility gas (%)
House heating fuel used in houses and condos - Bottled, tank, or LP gas (%)
House heating fuel used in houses and condos - Electricity (%)
House heating fuel used in houses and condos - Fuel oil, kerosene, etc. (%)
House heating fuel used in houses and condos - Coal or coke (%)
House heating fuel used in houses and condos - Wood (%)
House heating fuel used in houses and condos - Solar energy (%)
House heating fuel used in houses and condos - Other fuel (%)
House heating fuel used in houses and condos - No fuel used (%)
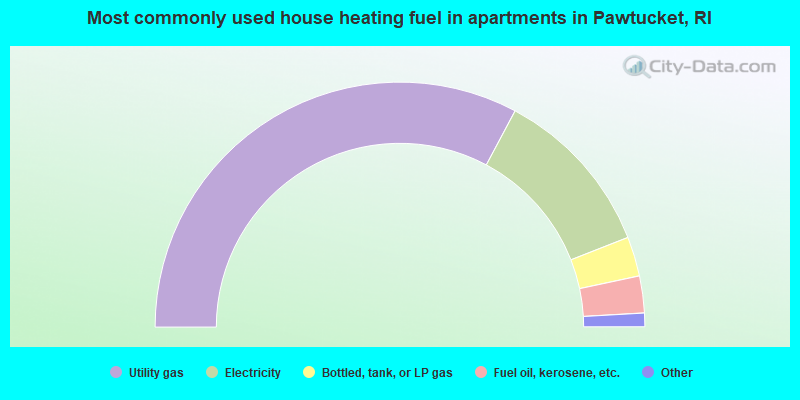
House heating fuel used in apartments - Utility gas (%)
House heating fuel used in apartments - Bottled, tank, or LP gas (%)
House heating fuel used in apartments - Electricity (%)
House heating fuel used in apartments - Fuel oil, kerosene, etc. (%)
House heating fuel used in apartments - Coal or coke (%)
House heating fuel used in apartments - Wood (%)
House heating fuel used in apartments - Solar energy (%)
House heating fuel used in apartments - Other fuel (%)
House heating fuel used in apartments - No fuel used (%)
Latest news about housing in Pawtucket, RI collected exclusively by city-data.com from local newspapers, TV, and radio stations
Median year house/condo built: 1944Median year apartment built: 1953Household type by relationship:
Households: 75,057
Male householders: 15,083 (4,987 living alone ), Female householders: 17,146 (5,514 living alone )11,490 spouses (11,168 opposite-sex spouses ), 3,130 unmarried partners , (2,745 opposite-sex unmarried partners ), 19,758 children (18,896 natural , 169 adopted , 693 stepchildren ), 1,252 grandchildren , 1,175 brothers or sisters , 889 parents , 107 foster children , 2,118 other relatives , 2,155 non-relatives In group quarters: 754
Size of family households: 8,514 2-persons , 5,109 3-persons , 2,352 4-persons , 1,684 5-persons , 379 6-persons , 431 7-or-more-persons .
Size of nonfamily households: 10,501 1-person , 3,003 2-persons , 256 3-persons .
7,246 married couples with children. single-parent households (745 men , 5,178 women ).
61.6% of residents of Pawtucket speak English at home. of residents speak Spanish at home (60% speak English very well , 17% speak English well , 16% speak English not well , 8% don't speak English at all ).of residents speak other Indo-European language at home (54% speak English very well , 33% speak English well , 8% speak English not well , 5% don't speak English at all ).of residents speak Asian or Pacific Island language at home (57% speak English very well , 27% speak English well , 15% speak English not well ).of residents speak other language at home (85% speak English very well , 13% speak English well , 2% speak English not well , 1% don't speak English at all ).
Foreign born population: 17,325 (23.1%)of them are naturalized citizens )
Median number of rooms in houses and condos:
Median number of rooms in apartments
Owner-occupied Renter-occupied
Rooms in owner-occupied houses in Pawtucket, Rhode Island
119 1 room 0 2 rooms 271 3 rooms 1,654 4 rooms 4,959 5 rooms 3,324 6 rooms 2,250 7 rooms 688 8 rooms 2,236 9+ rooms
Rooms in renter-occupied apartments in Pawtucket, Rhode Island
1,621 1 room 1,788 2 rooms 3,181 3 rooms 3,746 4 rooms 2,657 5 rooms 1,705 6 rooms 1,817 7 rooms 183 8 rooms 30 9+ rooms
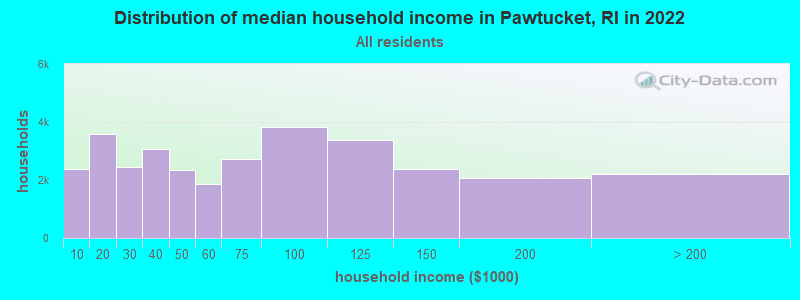
Pawtucket, RI household income distribution 2,366 Less than $10,0003,593 $10,000 to $19,9992,456 $20,000 to $29,9993,073 $30,000 to $39,9992,339 $40,000 to $49,9991,855 $50,000 to $59,9992,720 $60,000 to $74,9993,828 $75,000 to $99,9993,363 $100,000 to $124,9992,366 $125,000 to $149,9992,080 $150,000 to $199,9992,190 $200,000 or more
Home value of owner - occupied houses in 2022 in Pawtucket, RI 573 Less than $10,00036 $10,000 to $14,99946 $15,000 to $19,99939 $20,000 to $24,99981 $25,000 to $29,999200 $30,000 to $34,99936 $40,000 to $49,99945 $50,000 to $59,99925 $60,000 to $69,99930 $70,000 to $79,99933 $80,000 to $89,99973 $90,000 to $99,99990 $100,000 to $124,999127 $125,000 to $149,999321 $150,000 to $174,999468 $175,000 to $199,9991,838 $200,000 to $249,9992,224 $250,000 to $299,9994,914 $300,000 to $399,9991,153 $400,000 to $499,999732 $500,000 to $749,999149 $750,000 to $999,99952 $1,000,000 to $1,499,99910 $2,000,000 or moreRent paid by renters in 2022 in Pawtucket, RI 261 $100 to $149609 $200 to $249506 $250 to $299431 $300 to $349537 $350 to $39957 $400 to $449375 $450 to $499382 $500 to $549414 $550 to $599543 $600 to $649717 $650 to $699897 $700 to $749724 $750 to $7991,434 $800 to $8991,452 $900 to $9993,865 $1,000 to $1,2491,691 $1,250 to $1,499806 $1,500 to $1,999551 $2,000 to $2,499148 $3,500 or more328 No cash rent
Percentage of workers working in this county: 63.7%Number of people working at home: 3,570 (9.0% of all workers )
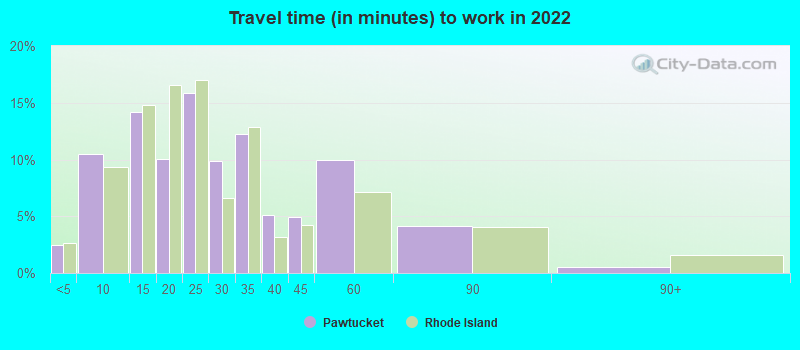
Travel time to work (commute)
Less than 5 minutes: 4855 to 9 minutes: 3,02110 to 14 minutes: 6,08015 to 19 minutes: 5,00720 to 24 minutes: 4,03125 to 29 minutes: 1,84830 to 34 minutes: 5,22435 to 39 minutes: 63840 to 44 minutes: 1,24745 to 59 minutes: 4,06360 to 89 minutes: 1,05490 or more minutes: 975
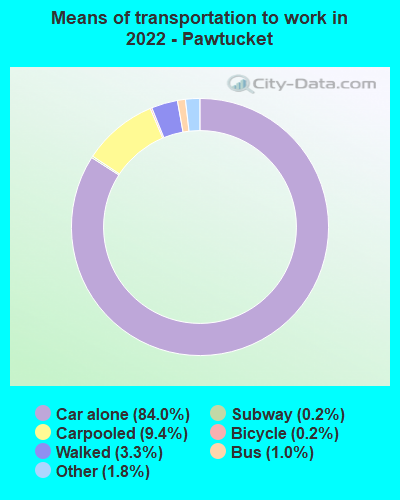
Means of transportation to work:
Drove a car alone: 18,008 (71.0%)Carpooled: 2,232 (8.8%)Bus : 177 (0.7%)Long-distance train or commuter rail : 38 (0.1%)Taxi: 648 (2.6%)Bicycle: 65 (0.3%)Walked: 808 (3.2%)Worked at home: 3,570 (14.1%)
Unemployment by race in 2022
Unemployment rate for White non-Hispanic residents 6.2% Males2.5% FemalesUnemployment rate for Black residents 6.7% Males6.8% FemalesUnemployment rate for Asian residents 2.1% Males5.7% FemalesUnemployment rate for other race residents 5.8% Males2.6% FemalesUnemployment rate for two or more race residents 5.2% Males9.8% FemalesUnemployment rate for Hispanic or Latino residents 4.6% Males8.8% Females
Year of entry for the foreign-born population in Pawtucket, Rhode Island
4,021 2010 or later 4,676 2000 to 2009 3,902 1990 to 1999 4,940 1980 to 1989 3,284 1970 to 1979 2,718 Before 1970
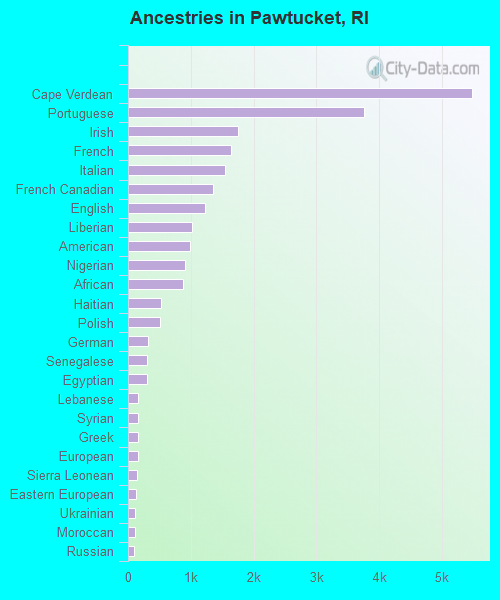
First ancestries reported:
Cape Verdean: 5,478 (14.0%)
Portuguese: 3,761 (9.6%)
Irish: 1,753 (4.5%)
French: 1,646 (4.2%)
Italian: 1,545 (4.0%)
French Canadian: 1,361 (3.5%)
English: 1,228 (3.1%)
Liberian: 1,017 (2.6%)
American: 982 (2.5%)
Nigerian: 904 (2.3%)
African: 873 (2.2%)
Haitian: 522 (1.3%)
Polish: 511 (1.3%)
German: 320 (0.8%)
Senegalese: 308 (0.8%)
Egyptian: 296 (0.8%)
Lebanese: 163 (0.4%)
Syrian: 159 (0.4%)
Greek: 159 (0.4%)
European: 153 (0.4%)
Sierra Leonean: 147 (0.4%)
Eastern European: 129 (0.3%)
Ukrainian: 115 (0.3%)
Moroccan: 108 (0.3%)
Russian: 102 (0.3%)
Jamaican: 78 (0.2%)
Austrian: 77 (0.2%)
Scottish: 73 (0.2%)
Canadian: 72 (0.2%)
West Indian: 70 (0.2%)
Cajun: 60 (0.2%)
Scandinavian: 55 (0.1%)
Armenian: 52 (0.1%)
Trinidadian and Tobagonian: 50 (0.1%)
Brazilian: 43 (0.1%)
British: 39 (0.10%)
Ghanaian: 36 (0.09%)
Hungarian: 30 (0.08%)
Dutch: 29 (0.07%)
Iraqi: 29 (0.07%)
Swedish: 27 (0.07%)
Norwegian: 23 (0.06%)
Belgian: 23 (0.06%)
Belizean: 21 (0.05%)
Maltese: 18 (0.05%)
Israeli: 17 (0.04%)
Lithuanian: 16 (0.04%)
Scotch-Irish: 13 (0.03%)
British West Indian: 13 (0.03%)
Romanian: 10 (0.03%)
Slavic: 8 (0.02%)
Welsh: 8 (0.02%)
Finnish: 7 (0.02%)
Danish: 5 (0.01%)
Basque: 5 (0.01%)
Barbadian: 5 (0.01%)
Arab: 4 (0.01%)
Most common places of birth for foreign-born residents (%): Cabo Verde Pawtucket:
25.3% (4,752)Rhode Island:
5.1% (8,042)
Colombia Pawtucket:
13.6% (2,550)Rhode Island:
4.1% (6,520)
Portugal Pawtucket:
9.5% (1,781)Rhode Island:
10.0% (15,766)
Dominican Republic Pawtucket:
6.8% (1,284)Rhode Island:
21.0% (33,163)
Liberia Pawtucket:
6.2% (1,162)Rhode Island:
2.5% (3,901)
Guatemala Pawtucket:
5.7% (1,076)Rhode Island:
10.4% (16,385)
Nigeria Pawtucket:
3.9% (730)Rhode Island:
1.9% (2,997)
Mexico Pawtucket:
3.3% (620)Rhode Island:
2.4% (3,836)
El Salvador Pawtucket:
2.8% (527)Rhode Island:
1.7% (2,654)
Haiti Pawtucket:
2.4% (448)Rhode Island:
1.9% (3,057)
Azores Islands Pawtucket:
1.6% (308)Rhode Island:
2.4% (3,822)
Place of birth for U.S.-born residents:
This state: 34,433Other state: 19,827Northeast: 14,318Midwest: 1,106South: 3,058West: 1,345 90.1% of Pawtucket residents lived in the same house 1 years ago.
Out of people who lived in different houses, 31.8% lived in this county.
Out of people who lived in different counties, 22.7% lived in Rhode Island.
Pawtucket:
90.1%State average:
89.3%
Education attainment for males 25 years and older:
No schooling: 2,030Nursery to 4th grade: 2735th and 6th grade: 5817th and 8th grade: 1549th grade: 46310th grade: 8211th grade: 38512th grade, no diploma: 439High school graduate (or equivalency): 9,073Less than 1 year of college: 2,141Some college more than 1 year, no degree: 2,691Associate degree: 2,434Bachelor's degree: 4,202Master's degree: 1,648Professional school degree: 350Doctorate degree: 578
Education attainment for females 25 years and older:
No schooling: 1,659Nursery to 4th grade: 6905th and 6th grade: 127th and 8th grade: 3299th grade: 1,13010th grade: 28811th grade: 95812th grade, no diploma: 593High school graduate (or equivalency): 7,069Less than 1 year of college: 2,994Some college more than 1 year, no degree: 2,199Associate degree: 2,224Bachelor's degree: 4,488Master's degree: 1,914Professional school degree: 200Doctorate degree: 210
Housing units in structures:
One, detached: 12,403One, attached: 726Two: 6,3933 or 4: 6,1455 to 9: 2,41110 to 19: 1,47920 to 49: 69650 or more: 3,106Mobile homes: 276Median worth of mobile homes: $85,532
Housing units lacking complete plumbing facilities in 2022: 1.3%Housing units lacking complete kitchen facilities in 2022: 1.7%House/condo owner moved in on average 14 years ago
Renter moved in on average 3 years ago
Private vs. public school enrollment:
Students in private schools in grades 1 to 8 (elementary and middle school): 1,446 Here:
22.8%Rhode Island:
12.2%
Students in private schools in grades 9 to 12 (high school): 358 Here:
12.7%Rhode Island:
11.6%
Students in private undergraduate colleges: 365 Here:
14.6%Rhode Island:
41.1%