Races in Pawtucket, Rhode Island (RI) Detailed Stats
Data:
Races - White alone (%)
Races - White alone (% change since 2000)
Races - Black alone (%)
Races - Black alone (% change since 2000)
Races - American Indian alone (%)
Races - American Indian alone (% change since 2000)
Races - Asian alone (%)
Races - Asian alone (% change since 2000)
Races - Hispanic (%)
Races - Hispanic (% change since 2000)
Races - Native Hawaiian and Other Pacific Islander alone (%)
Races - Native Hawaiian and Other Pacific Islander alone (% change since 2000)
Races - Two or more races(%)
Races - Two or more races(% change since 2000)
Races - Other race alone (%)
Races - Other race alone (% change since 2000)
Racial diversity
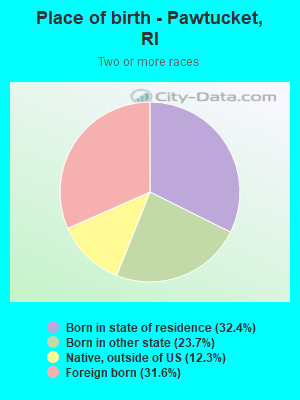
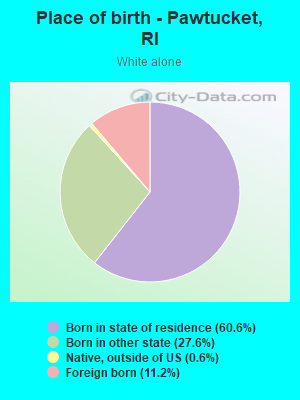
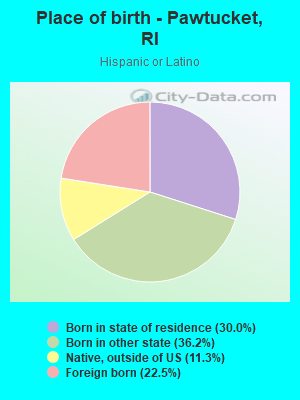
Place of birth - Born in state of residence (%)
Place of birth - Born in state of residence (%) - White
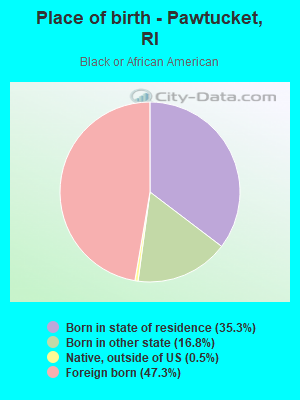
Place of birth - Born in state of residence (%) - Black or African American
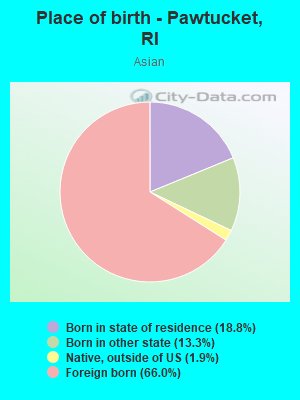
Place of birth - Born in state of residence (%) - Asian
Place of birth - Born in state of residence (%) - Hispanic or Latino
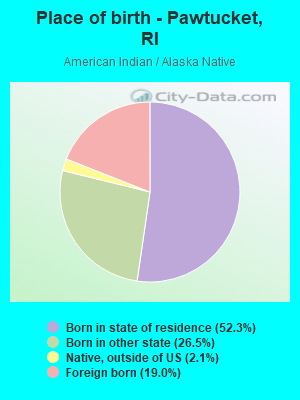
Place of birth - Born in state of residence (%) - American Indian and Alaska Native
Place of birth - Born in state of residence (%) - Multirace
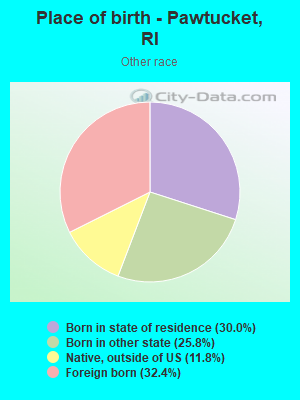
Place of birth - Born in state of residence (%) - Other Race
Place of birth - Born in other state (%)
Place of birth - Born in other state (%) - White
Place of birth - Born in other state (%) - Black or African American
Place of birth - Born in other state (%) - Asian
Place of birth - Born in other state (%) - Hispanic or Latino
Place of birth - Born in other state (%) - American Indian and Alaska Native
Place of birth - Born in other state (%) - Multirace
Place of birth - Born in other state (%) - Other Race
Place of birth - Native, outside of US (%)
Place of birth - Native, outside of US (%) - White
Place of birth - Native, outside of US (%) - Black or African American
Place of birth - Native, outside of US (%) - Asian
Place of birth - Native, outside of US (%) - Hispanic or Latino
Place of birth - Native, outside of US (%) - American Indian and Alaska Native
Place of birth - Native, outside of US (%) - Multirace
Place of birth - Native, outside of US (%) - Other Race
Place of birth - Foreign born (%)
Place of birth - Foreign born (%) - White
Place of birth - Foreign born (%) - Black or African American
Place of birth - Foreign born (%) - Asian
Place of birth - Foreign born (%) - Hispanic or Latino
Place of birth - Foreign born (%) - American Indian and Alaska Native
Place of birth - Foreign born (%) - Multirace
Place of birth - Foreign born (%) - Other Race
Residents speaking English at home (%)
Residents speaking English at home - Born in the United States (%)
Residents speaking English at home - Native, born elsewhere (%)
Residents speaking English at home - Foreign born (%)
Residents speaking Spanish at home (%)
Residents speaking Spanish at home - Born in the United States (%)
Residents speaking Spanish at home - Native, born elsewhere (%)
Residents speaking Spanish at home - Foreign born (%)
Residents speaking other language at home (%)
Residents speaking other language at home - Born in the United States (%)
Residents speaking other language at home - Native, born elsewhere (%)
Residents speaking other language at home - Foreign born (%)
Marital status - Never married (%)
Marital status - Now married (%)
Marital status - Separated (%)
Marital status - Widowed (%)
Marital status - Divorced (%)
Ancestries Reported - Arab (%)
Ancestries Reported - Czech (%)
Ancestries Reported - Danish (%)
Ancestries Reported - Dutch (%)
Ancestries Reported - English (%)
Ancestries Reported - French (%)
Ancestries Reported - French Canadian (%)
Ancestries Reported - German (%)
Ancestries Reported - Greek (%)
Ancestries Reported - Hungarian (%)
Ancestries Reported - Irish (%)
Ancestries Reported - Italian (%)
Ancestries Reported - Lithuanian (%)
Ancestries Reported - Norwegian (%)
Ancestries Reported - Polish (%)
Ancestries Reported - Portuguese (%)
Ancestries Reported - Russian (%)
Ancestries Reported - Scotch-Irish (%)
Ancestries Reported - Scottish (%)
Ancestries Reported - Slovak (%)
Ancestries Reported - Subsaharan African (%)
Ancestries Reported - Swedish (%)
Ancestries Reported - Swiss (%)
Ancestries Reported - Ukrainian (%)
Ancestries Reported - United States (%)
Ancestries Reported - Welsh (%)
Ancestries Reported - West Indian (%)
Ancestries Reported - Other (%)
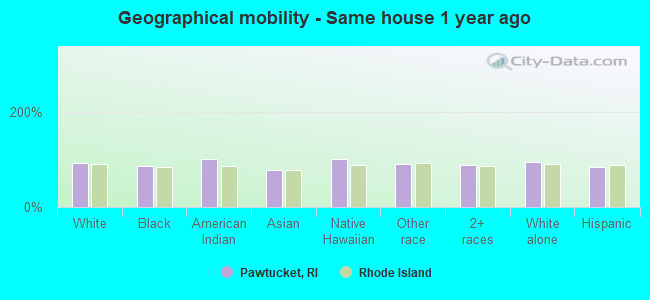
Geographical mobility - Same house 1 year ago (%)
Geographical mobility - Same house 1 year ago (%) - White
Geographical mobility - Same house 1 year ago (%) - Black or African American
Geographical mobility - Same house 1 year ago (%) - Asian
Geographical mobility - Same house 1 year ago (%) - Hispanic or Latino
Geographical mobility - Same house 1 year ago (%) - American Indian and Alaska Native
Geographical mobility - Same house 1 year ago (%) - Multirace
Geographical mobility - Same house 1 year ago (%) - Other Race
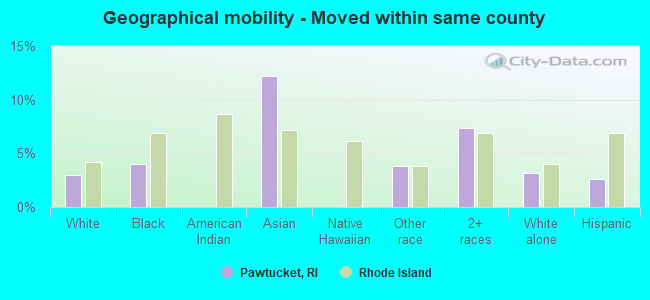
Geographical mobility - Moved within same county (%)
Geographical mobility - Moved within same county (%) - White
Geographical mobility - Moved within same county (%) - Black or African American
Geographical mobility - Moved within same county (%) - Asian
Geographical mobility - Moved within same county (%) - Hispanic or Latino
Geographical mobility - Moved within same county (%) - American Indian and Alaska Native
Geographical mobility - Moved within same county (%) - Multirace
Geographical mobility - Moved within same county (%) - Other Race
Geographical mobility - Moved from different county within same state (%)
Geographical mobility - Moved from different county within same state (%) - White
Geographical mobility - Moved from different county within same state (%) - Black or African American
Geographical mobility - Moved from different county within same state (%) - Asian
Geographical mobility - Moved from different county within same state (%) - Hispanic or Latino
Geographical mobility - Moved from different county within same state (%) - American Indian and Alaska Native
Geographical mobility - Moved from different county within same state (%) - Multirace
Geographical mobility - Moved from different county within same state (%) - Other Race
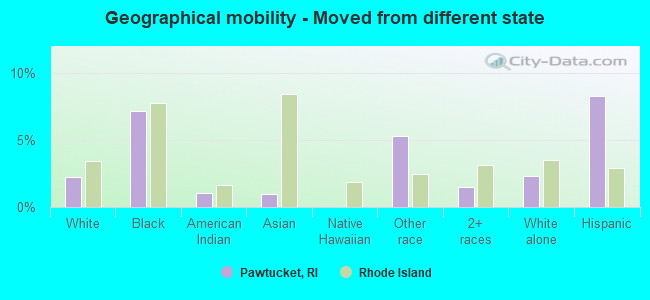
Geographical mobility - Moved from different state (%)
Geographical mobility - Moved from different state (%) - White
Geographical mobility - Moved from different state (%) - Black or African American
Geographical mobility - Moved from different state (%) - Asian
Geographical mobility - Moved from different state (%) - Hispanic or Latino
Geographical mobility - Moved from different state (%) - American Indian and Alaska Native
Geographical mobility - Moved from different state (%) - Multirace
Geographical mobility - Moved from different state (%) - Other Race
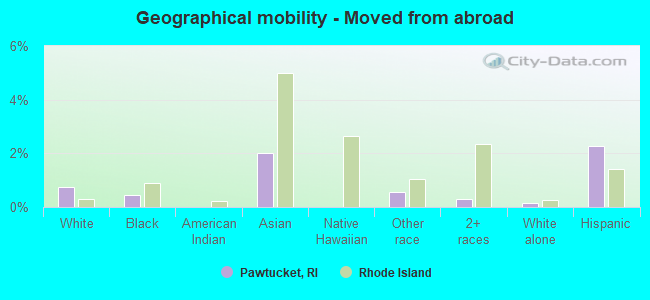
Geographical mobility - Moved from abroad (%)
Geographical mobility - Moved from abroad (%) - White
Geographical mobility - Moved from abroad (%) - Black or African American
Geographical mobility - Moved from abroad (%) - Asian
Geographical mobility - Moved from abroad (%) - Hispanic or Latino
Geographical mobility - Moved from abroad (%) - American Indian and Alaska Native
Geographical mobility - Moved from abroad (%) - Multirace
Geographical mobility - Moved from abroad (%) - Other Race
Place of birth for the foreign-born population - Ireland (%)
Place of birth for the foreign-born population - Denmark (%)
Place of birth for the foreign-born population - Norway (%)
Place of birth for the foreign-born population - Sweden (%)
Place of birth for the foreign-born population - United Kingdom (%)
Place of birth for the foreign-born population - England (%)
Place of birth for the foreign-born population - Scotland (%)
Place of birth for the foreign-born population - Other Northern Europe (%)
Place of birth for the foreign-born population - Austria (%)
Place of birth for the foreign-born population - Belgium (%)
Place of birth for the foreign-born population - France (%)
Place of birth for the foreign-born population - Germany (%)
Place of birth for the foreign-born population - Netherlands (%)
Place of birth for the foreign-born population - Switzerland (%)
Place of birth for the foreign-born population - Other Western Europe (%)
Place of birth for the foreign-born population - Greece (%)
Place of birth for the foreign-born population - Italy (%)
Place of birth for the foreign-born population - Portugal (%)
Place of birth for the foreign-born population - Spain (%)
Place of birth for the foreign-born population - Other Southern Europe (%)
Place of birth for the foreign-born population - Albania (%)
Place of birth for the foreign-born population - Belarus (%)
Place of birth for the foreign-born population - Bosnia and Herzegovina (%)
Place of birth for the foreign-born population - Bulgaria (%)
Place of birth for the foreign-born population - Croatia (%)
Place of birth for the foreign-born population - Czechoslovakia (%)
Place of birth for the foreign-born population - Hungary (%)
Place of birth for the foreign-born population - Latvia (%)
Place of birth for the foreign-born population - Lithuania (%)
Place of birth for the foreign-born population - North Macedonia (Macedonia) (%)
Place of birth for the foreign-born population - Moldova (%)
Place of birth for the foreign-born population - Poland (%)
Place of birth for the foreign-born population - Romania (%)
Place of birth for the foreign-born population - Russia (%)
Place of birth for the foreign-born population - Serbia (%)
Place of birth for the foreign-born population - Ukraine (%)
Place of birth for the foreign-born population - Other Eastern Europe (%)
Place of birth for the foreign-born population - China (%)
Place of birth for the foreign-born population - Hong Kong (%)
Place of birth for the foreign-born population - Taiwan (%)
Place of birth for the foreign-born population - Japan (%)
Place of birth for the foreign-born population - Korea (%)
Place of birth for the foreign-born population - Other Eastern Asia (%)
Place of birth for the foreign-born population - Afghanistan (%)
Place of birth for the foreign-born population - Bangladesh (%)
Place of birth for the foreign-born population - India (%)
Place of birth for the foreign-born population - Iran (%)
Place of birth for the foreign-born population - Kazakhstan (%)
Place of birth for the foreign-born population - Nepal (%)
Place of birth for the foreign-born population - Pakistan (%)
Place of birth for the foreign-born population - Sri Lanka (%)
Place of birth for the foreign-born population - Uzbekistan (%)
Place of birth for the foreign-born population - Other South Central Asia (%)
Place of birth for the foreign-born population - Burma (%)
Place of birth for the foreign-born population - Cambodia (%)
Place of birth for the foreign-born population - Indonesia (%)
Place of birth for the foreign-born population - Laos (%)
Place of birth for the foreign-born population - Malaysia (%)
Place of birth for the foreign-born population - Philippines (%)
Place of birth for the foreign-born population - Singapore (%)
Place of birth for the foreign-born population - Thailand (%)
Place of birth for the foreign-born population - Vietnam (%)
Place of birth for the foreign-born population - Other South Eastern Asia (%)
Place of birth for the foreign-born population - Armenia (%)
Place of birth for the foreign-born population - Iraq (%)
Place of birth for the foreign-born population - Israel (%)
Place of birth for the foreign-born population - Jordan (%)
Place of birth for the foreign-born population - Kuwait (%)
Place of birth for the foreign-born population - Lebanon (%)
Place of birth for the foreign-born population - Saudi Arabia (%)
Place of birth for the foreign-born population - Syria (%)
Place of birth for the foreign-born population - Turkey (%)
Place of birth for the foreign-born population - Yemen (%)
Place of birth for the foreign-born population - Other Western Asia (%)
Place of birth for the foreign-born population - Eritrea (%)
Place of birth for the foreign-born population - Ethiopia (%)
Place of birth for the foreign-born population - Kenya (%)
Place of birth for the foreign-born population - Somalia (%)
Place of birth for the foreign-born population - Uganda (%)
Place of birth for the foreign-born population - Zimbabwe (%)
Place of birth for the foreign-born population - Other Eastern Africa (%)
Place of birth for the foreign-born population - Cameroon (%)
Place of birth for the foreign-born population - Congo (%)
Place of birth for the foreign-born population - Democratic Republic of Congo (Zaire) (%)
Place of birth for the foreign-born population - Other Middle Africa (%)
Place of birth for the foreign-born population - Egypt (%)
Place of birth for the foreign-born population - Morocco (%)
Place of birth for the foreign-born population - Sudan (%)
Place of birth for the foreign-born population - Other Northern Africa (%)
Place of birth for the foreign-born population - South Africa (%)
Place of birth for the foreign-born population - Other Southern Africa (%)
Place of birth for the foreign-born population - Cabo Verde (%)
Place of birth for the foreign-born population - Ghana (%)
Place of birth for the foreign-born population - Liberia (%)
Place of birth for the foreign-born population - Nigeria (%)
Place of birth for the foreign-born population - Senegal (%)
Place of birth for the foreign-born population - Sierra Leone (%)
Place of birth for the foreign-born population - Other Western Africa (%)
Place of birth for the foreign-born population - Australia (%)
Place of birth for the foreign-born population - New Zealand (%)
Place of birth for the foreign-born population - Fiji (%)
Place of birth for the foreign-born population - Micronesia (%)
Place of birth for the foreign-born population - Bahamas (%)
Place of birth for the foreign-born population - Barbados (%)
Place of birth for the foreign-born population - Cuba (%)
Place of birth for the foreign-born population - Dominica (%)
Place of birth for the foreign-born population - Dominican Republic (%)
Place of birth for the foreign-born population - Grenada (%)
Place of birth for the foreign-born population - Haiti (%)
Place of birth for the foreign-born population - Jamaica (%)
Place of birth for the foreign-born population - St. Vincent and the Grenadines (%)
Place of birth for the foreign-born population - Trinidad and Tobago (%)
Place of birth for the foreign-born population - West Indies (%)
Place of birth for the foreign-born population - Other Caribbean (%)
Place of birth for the foreign-born population - Belize (%)
Place of birth for the foreign-born population - Costa Rica (%)
Place of birth for the foreign-born population - El Salvador (%)
Place of birth for the foreign-born population - Guatemala (%)
Place of birth for the foreign-born population - Honduras (%)
Place of birth for the foreign-born population - Mexico (%)
Place of birth for the foreign-born population - Nicaragua (%)
Place of birth for the foreign-born population - Panama (%)
Place of birth for the foreign-born population - Other Central America (%)
Place of birth for the foreign-born population - Argentina (%)
Place of birth for the foreign-born population - Bolivia (%)
Place of birth for the foreign-born population - Brazil (%)
Place of birth for the foreign-born population - Chile (%)
Place of birth for the foreign-born population - Colombia (%)
Place of birth for the foreign-born population - Ecuador (%)
Place of birth for the foreign-born population - Guyana (%)
Place of birth for the foreign-born population - Peru (%)
Place of birth for the foreign-born population - Uruguay (%)
Place of birth for the foreign-born population - Venezuela (%)
Place of birth for the foreign-born population - Other South America (%)
Place of birth for the foreign-born population - Canada (%)
Place of birth for the foreign-born population - Other Northern America (%)
Place of birth for the foreign-born population - Other (%)
Latest news about races in Pawtucket, RI collected exclusively by city-data.com from local newspapers, TV, and radio stations
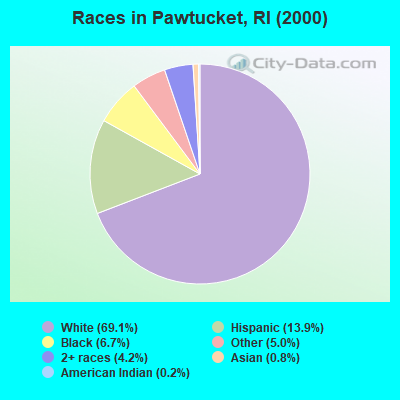
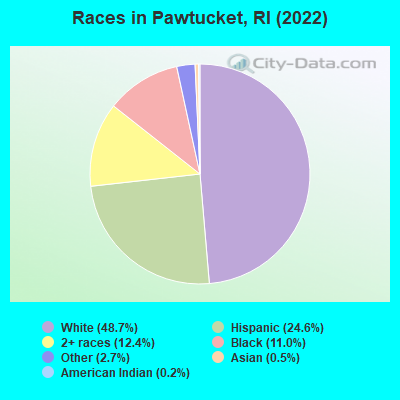
According to 2022 data, the most numerous races in Pawtucket, RI are White alone (36,530 residents), Hispanic (18,450 residents), and Two or more races (9,311 residents). 64.4% of Pawtucket residents speak English at home. 25.0% of Pawtucket, RI residents are foreign-born (10.2% born in Africa, 9.3% born in Latin America, 3.6% born in Europe), which is 43.9% greater than the foreign-born rate of 14.0% across the entire state of Rhode Island.
Race distribution in Pawtucket
2000 2022
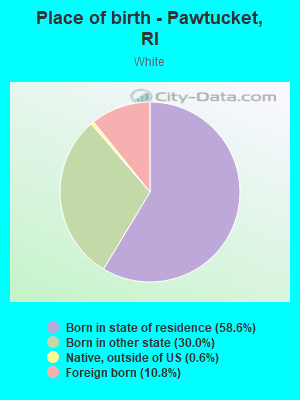
50,436 69.1% White alone 10,141 13.9% Hispanic 4,876 6.7% Black alone 3,675 5.0% Other race alone 3,045 4.2% Two or more races 603 0.8% Asian alone 151 0.2% American Indian alone 31 0.04% Native Hawaiian and Other
36,530 48.7% White alone 18,450 24.6% Hispanic 9,311 12.4% Two or more races 8,249 11.0% Black alone 2,023 2.7% Other race alone 369 0.5% Asian alone 125 0.2% American Indian alone
2000 2022
858,433 81.9% White alone 90,820 8.7% Hispanic 41,922 4.0% Black alone 23,416 2.2% Asian alone 20,816 2.0% Two or more races 8,411 0.8% Other race alone 4,181 0.4% American Indian alone 320 0.03% Native Hawaiian and Other
745,825 68.2% White alone 191,979 17.6% Hispanic 56,738 5.2% Two or more races 51,326 4.7% Black alone 37,234 3.4% Asian alone 9,514 0.9% Other race alone 978 0.09% American Indian alone 140 0.01% Native Hawaiian and Other
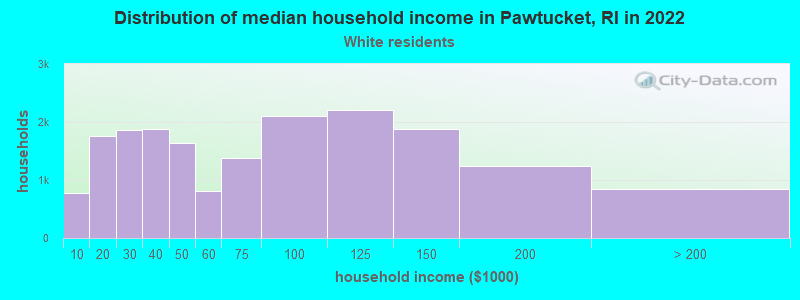
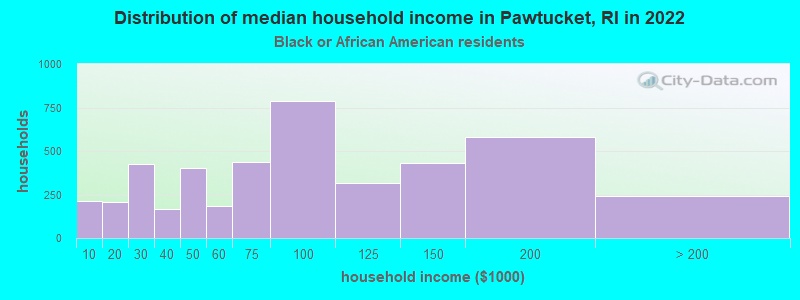
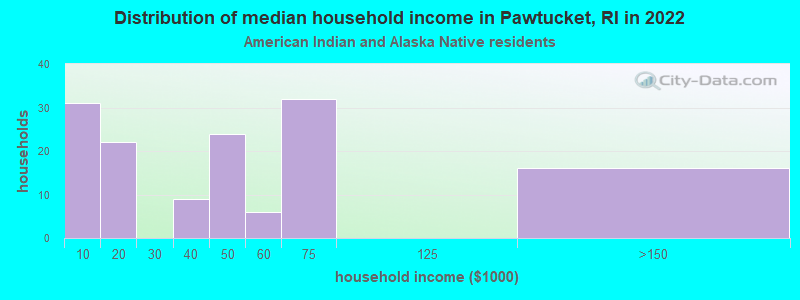
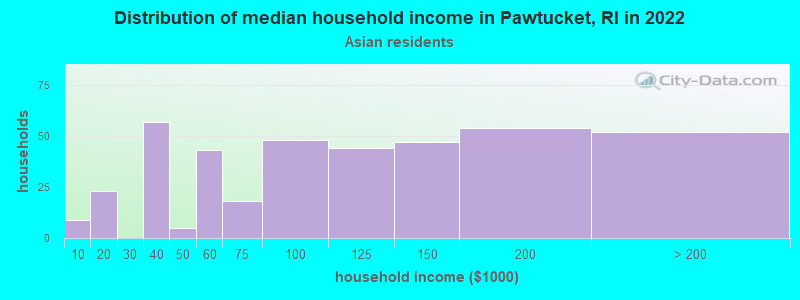
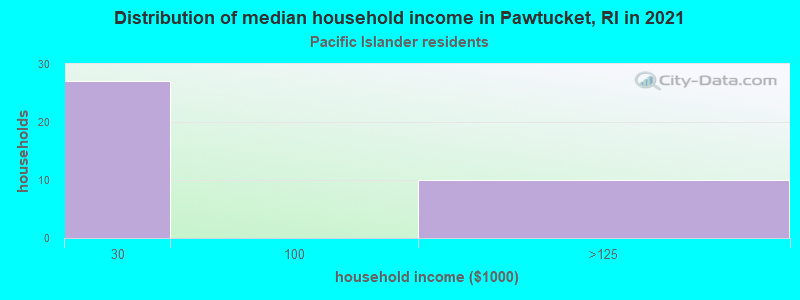
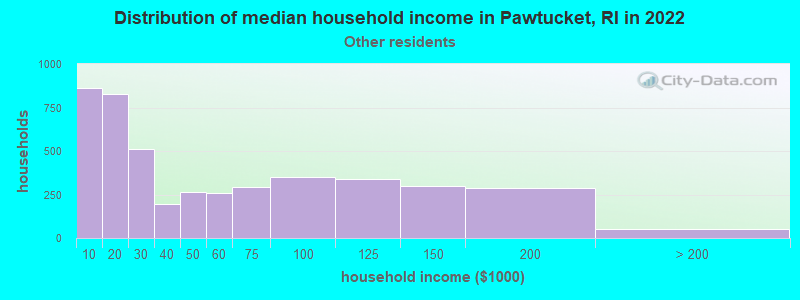
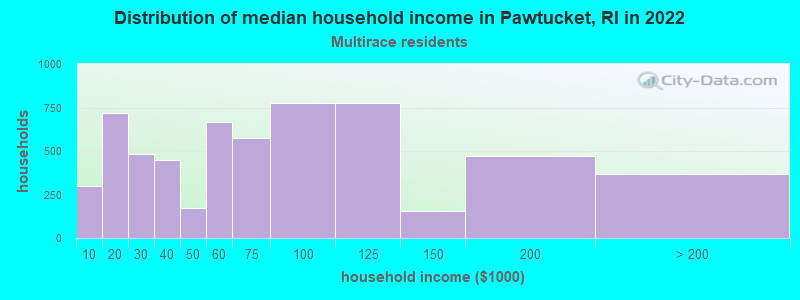
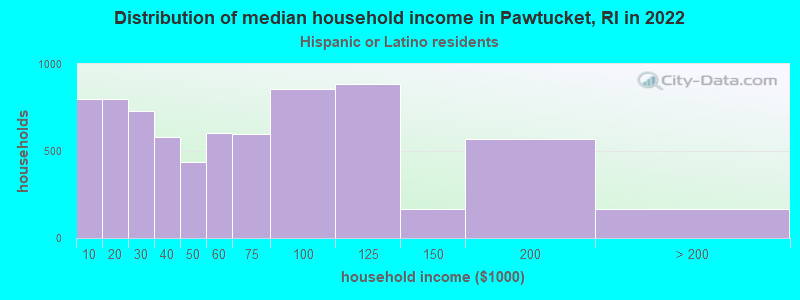
Income and house value in Pawtucket Median household income in 2022 $64,648 White non-Hispanic householders$80,837 Black householders$83,885 Asian householders$41,008 Some other race householders$52,671 Two or more races householders$31,992 Hispanic or Latino race householdersMedian 2022 house value $317,325 White Non-Hispanic householders$315,722 Black or African American householders$342,005 American Indian or Alaska Native householders $265,719 Asian householders$302,901 Some other race householders$330,146 Two or more races householders$310,914 Hispanic or Latino householders
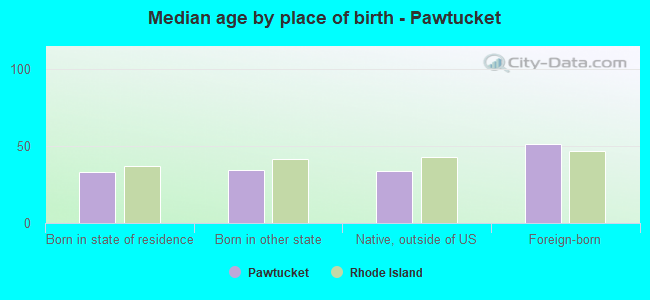
Median age by race in Pawtucket
45.6 Median age for White residents44.2 47.7 35.4 Median age for Black or African American residents35.8 34.5 2.8 Median age for American Indian / Alaska Native residents-666,666,666.0 -666,666,666.0 34.8 Median age for Asian residents42.0 -666,666,666.0 -666,666,666.0 Median age for Native Hawaiian / Pacific Islander residents-666,666,666.0 -666,666,666.0 37.8 Median age for Other race residents37.5 38.4 32.5 Median age for Two or more races residents32.5 32.7 48.1 Median age for White alone residents47.0 48.6 30.5 Median age for Hispanic or Latino residents32.1 30.0
Owner/renter occupied households by race in Pawtucket
House owners and renters - White residents 10,978 59.8% Owner occupied7,391 40.2% Renter occupiedHouse owners and renters - Black or African American residents 860 26.5% Owner occupied2,381 73.5% Renter occupiedHouse owners and renters - American Indian / Alaska Native residents 59 49.4% Owner occupied61 50.6% Renter occupiedHouse owners and renters - Asian residents 223 52.3% Owner occupied204 47.7% Renter occupiedHouse owners and renters - Native Hawaiian / Pacific Islander residents 15 73.1% Owner occupied6 26.9% Renter occupiedHouse owners and renters - Other race residents 594 14.6% Owner occupied3,478 85.4% Renter occupiedHouse owners and renters - Two or more races residents 2,808 46.0% Owner occupied3,290 54.0% Renter occupiedHouse owners and renters - White alone residents 10,978 60.1% Owner occupied7,278 39.9% Renter occupiedHouse owners and renters - Hispanic or Latino residents 1,388 19.8% Owner occupied5,608 80.2% Renter occupied
Language usage in Pawtucket
English speakers - Total 64.4% of residents of Pawtucket speak English at home.
15.3% of residents speak Spanish at home 7,436 69.0% Speak English very well3,348 31.0% Speak English less than very well20.3% of residents speak other language at home 7,348 51.5% Speak English very well6,911 48.5% Speak English less than very well
English speakers - Born in the United States 78.4% of residents of Pawtucket speak English at home.
17.4% of residents speak Spanish at home 3,246 98.3% Speak English very well55 1.7% Speak English less than very well4.1% of residents speak other language at home 540 69.1% Speak English very well241 30.9% Speak English less than very well
English speakers - Native, born elsewhere 29.5% of residents of Pawtucket speak English at home.
49.2% of residents speak Spanish at home 1,232 72.2% Speak English very well475 27.8% Speak English less than very well21.3% of residents speak other language at home 639 86.2% Speak English very well102 13.8% Speak English less than very well
English speakers - Foreign-born 17.9% of residents of Pawtucket speak English at home.
23.4% of residents speak Spanish at home 1,407 34.9% Speak English very well2,628 65.1% Speak English less than very well58.7% of residents speak other language at home 4,190 41.3% Speak English very well5,949 58.7% Speak English less than very well
White (Caucasian) - Speak only English Native:
93.3% (30,404)Foreign-born:
12.0% (499)
White (Caucasian) - Speak another language Native:
6.7% (2,178)Foreign-born:
88.0% (3,660)
Black or African American - Speak only English Native:
85.4% (3,697)Foreign-born:
38.4% (1,699)
Black or African American - Speak another language Native:
14.6% (631)Foreign-born:
61.6% (2,729)
American Indian / Alaska Native - Speak another language Native:
55.2% (194)Foreign-born:
100.0% (115)
Asian - Speak only English Native:
52.8% (175)Foreign-born:
21.8% (137)
Asian - Speak another language Native:
46.7% (154)Foreign-born:
74.1% (464)
Other race - Speak only English Native:
43.9% (3,055)Foreign-born:
4.7% (154)
Other race - Speak another language Native:
56.1% (3,903)Foreign-born:
95.3% (3,113)
Two or more races - Speak only English Native:
54.7% (4,937)Foreign-born:
11.7% (597)
Two or more races - Speak another language Native:
45.3% (4,094)Foreign-born:
88.3% (4,502)
White alone - Speak only English Native:
95.2% (29,242)Foreign-born:
12.2% (499)
White alone - Speak another language Native:
4.8% (1,483)Foreign-born:
87.8% (3,592)
Hispanic or Latino - Speak only English Native:
46.5% (5,881)Foreign-born:
1.3% (55)
Hispanic or Latino - Speak another language Native:
53.5% (6,758)Foreign-born:
98.7% (4,035)
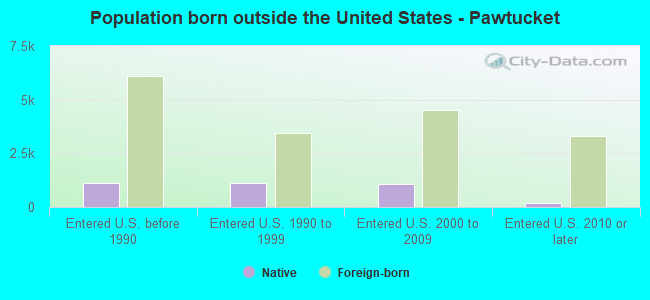
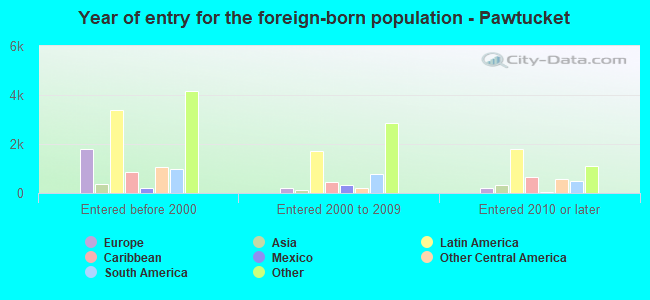
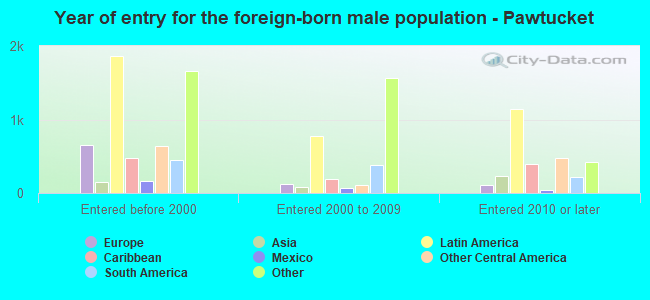
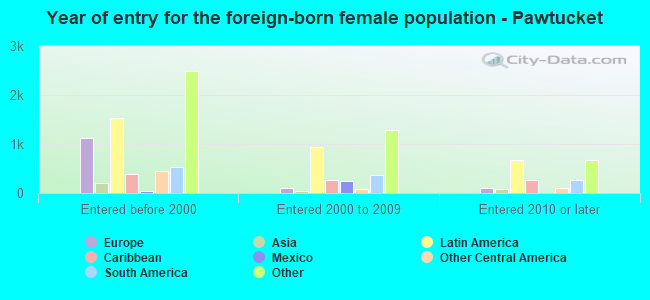
Foreign-born residents in Pawtucket 18,750 residents are foreign born (10.2% Africa , 9.3% Latin America , 3.6% Europe ).
This city:
25.0%Rhode Island:
14.4%
Marital status for residents in Pawtucket Marital status - White (Caucasian) population 15 years and over
Males 35.8% Never married46.3% Now married0.0% Separated1.9% Widowed16.0% DivorcedFemales 33.7% Never married42.4% Now married0.0% Separated9.8% Widowed14.0% DivorcedWomen who gave birth in the past 12 months Now married:
45.2% (169)Unmarried:
54.8% (205)
Women who did not give birth in the past 12 months Now married:
44.4% (3,247)Unmarried:
55.6% (4,072)
Marital status - Black or African American population 15 years and over
Males 52.3% Never married37.4% Now married2.2% Separated0.2% Widowed7.9% DivorcedFemales 50.2% Never married28.6% Now married2.5% Separated1.6% Widowed17.1% DivorcedWomen who gave birth in the past 12 months Now married:
35.9% (28)Unmarried:
64.1% (50)
Women who did not give birth in the past 12 months Now married:
29.0% (1,006)Unmarried:
71.0% (2,466)
Marital status - American Indian / Alaska Native population 15 years and over
Males 40.3% Never married56.9% Now married0.0% Separated0.0% Widowed2.8% DivorcedFemales 50.6% Never married23.5% Now married7.8% Separated13.3% Widowed4.8% DivorcedWomen who did not give birth in the past 12 months Now married:
41.9% (61)Unmarried:
58.1% (85)
Marital status - Asian population 15 years and over
Males 27.5% Never married41.2% Now married10.2% Separated1.2% Widowed19.9% DivorcedFemales 52.2% Never married33.3% Now married0.0% Separated7.0% Widowed7.4% DivorcedWomen who gave birth in the past 12 months Now married:
100.0% (4)Unmarried:
0.0% (0)
Women who did not give birth in the past 12 months Now married:
26.6% (87)Unmarried:
73.4% (240)
Marital status - Native Hawaiian / Pacific Islander population 15 years and over
Males 0.0% Never married100.0% Now married0.0% Separated0.0% Widowed0.0% DivorcedFemales 0.0% Never married90.9% Now married0.0% Separated9.1% Widowed0.0% DivorcedWomen who gave birth in the past 12 months Now married:
100.0% (31)Unmarried:
0.0% (0)
Marital status - Other race population 15 years and over
Males 38.6% Never married46.6% Now married3.0% Separated0.0% Widowed11.7% DivorcedFemales 51.4% Never married27.5% Now married0.9% Separated1.5% Widowed18.7% DivorcedWomen who gave birth in the past 12 months Now married:
50.5% (62)Unmarried:
49.5% (61)
Women who did not give birth in the past 12 months Now married:
35.5% (945)Unmarried:
64.5% (1,718)
Marital status - Two or more races population 15 years and over
Males 51.9% Never married31.2% Now married3.6% Separated0.0% Widowed13.3% DivorcedFemales 41.1% Never married37.4% Now married3.5% Separated6.2% Widowed11.9% DivorcedWomen who gave birth in the past 12 months Now married:
47.5% (106)Unmarried:
52.5% (117)
Women who did not give birth in the past 12 months Now married:
26.1% (1,000)Unmarried:
73.9% (2,828)
Marital status - White alone, not Hispanic / Latino population 15 years and over
Males 35.1% Never married46.8% Now married0.0% Separated1.9% Widowed16.2% DivorcedFemales 33.4% Never married42.7% Now married0.0% Separated9.9% Widowed14.1% DivorcedWomen who gave birth in the past 12 months Now married:
45.2% (169)Unmarried:
54.8% (205)
Women who did not give birth in the past 12 months Now married:
44.9% (3,247)Unmarried:
55.1% (3,984)
Marital status - Hispanic or Latino population 15 years and over
Males 37.6% Never married42.0% Now married5.3% Separated0.0% Widowed15.0% DivorcedFemales 53.9% Never married31.1% Now married2.1% Separated0.0% Widowed12.8% DivorcedWomen who gave birth in the past 12 months Now married:
12.5% (16)Unmarried:
87.5% (115)
Women who did not give birth in the past 12 months Now married:
35.3% (1,759)Unmarried:
64.7% (3,222)
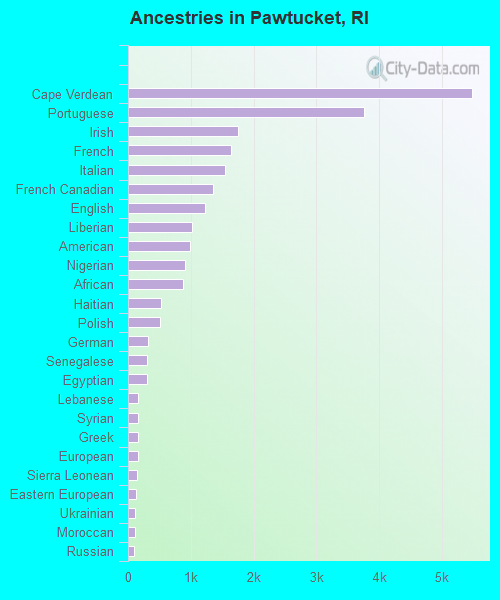
Ancestries in Pawtucket
5,478 14.0% Cape Verdean3,761 9.6% Portuguese1,753 4.5% Irish1,646 4.2% French1,545 4.0% Italian1,361 3.5% French Canadian1,228 3.1% English1,017 2.6% Liberian982 2.5% American904 2.3% Nigerian873 2.2% African522 1.3% Haitian511 1.3% Polish320 0.8% German308 0.8% Senegalese296 0.8% Egyptian163 0.4% Lebanese159 0.4% Syrian159 0.4% Greek153 0.4% European147 0.4% Sierra Leonean129 0.3% Eastern European115 0.3% Ukrainian108 0.3% Moroccan102 0.3% Russian78 0.2% Jamaican77 0.2% Austrian73 0.2% Scottish72 0.2% Canadian70 0.2% West Indian60 0.2% Cajun55 0.1% Scandinavian52 0.1% Armenian50 0.1% Trinidadian and Tobagonian43 0.1% Brazilian39 0.10% British36 0.09% Ghanaian30 0.08% Hungarian29 0.07% Dutch29 0.07% Iraqi27 0.07% Swedish23 0.06% Norwegian23 0.06% Belgian21 0.05% Belizean18 0.05% Maltese17 0.04% Israeli16 0.04% Lithuanian13 0.03% Scotch-Irish13 0.03% British West Indian10 0.03% Romanian8 0.02% Slavic8 0.02% Welsh7 0.02% Finnish5 0.01% Danish5 0.01% Basque5 0.01% Barbadian4 0.01% Arab
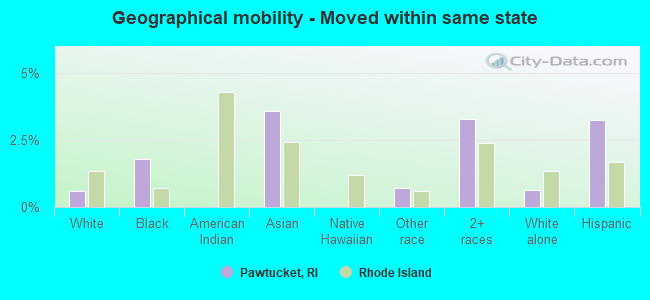
Geographical mobility in Pawtucket Same house 1 year ago 35,782 93.4% White (Caucasian)9,677 86.1% Black or African American500 100.0% American Indian / Alaska Native725 77.1% Asian73 100.0% Native Hawaiian / Pacific Islander9,409 90.6% Other race14,272 86.6% Two or more races33,945 93.7% White alone, not Hispanic / Latino15,427 83.6% Hispanic or LatinoMoved within same county 1,145 3.0% White / Caucasian447 4.0% Black or African American115 12.2% Asian394 3.8% Other race1,213 7.4% Two or more races1,145 3.2% White alone, not Hispanic / Latino482 2.6% Hispanic or LatinoMoved within same state 235 0.6% White / Caucasian199 1.8% Black or African American33 3.6% Asian72 0.7% Other race543 3.3% Two or more races235 0.6% White alone, not Hispanic / Latino596 3.2% Hispanic or LatinoMoved from different state 850 2.2% White / Caucasian805 7.2% Black or African American5 1.0% American Indian / Alaska Native9 1.0% Asian549 5.3% Other race251 1.5% Two or more races850 2.3% White alone, not Hispanic / Latino1,524 8.3% Hispanic or LatinoMoved from abroad 289 0.8% White51 0.5% Black or African American19 2.0% Asian57 0.6% Other race51 0.3% Two or more races53 0.1% White alone, not Hispanic / Latino421 2.3% Hispanic or Latino
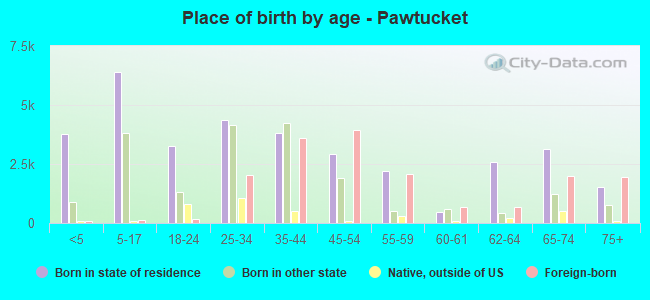
Children Nativity (place of birth) in Pawtucket
Children under 6 years - Living with two parents Both parents native 1,078 99.3% Native8 0.7% Foreign-bornBoth parents foreign-born 627 81.1% Native146 18.9% Foreign-bornOne native, one foreign-born parent 575 100.0% NativeChildren under 6 years - Living with one parent Native parent 1,531 100.0% NativeForeign-born parent 741 99.2% Native6 0.8% Foreign-bornChildren 6 to 17 years - Living with two parents Both parents native 1,860 100.0% NativeBoth parents foreign-born 1,376 84.9% Native245 15.1% Foreign-bornOne native, one foreign-born parent 1,775 96.0% Native73 4.0% Foreign-bornChildren 6 to 17 years - Living with one parent Native parent 2,513 100.0% NativeForeign-born parent 2,112 53.7% Native1,820 46.3% Foreign-born
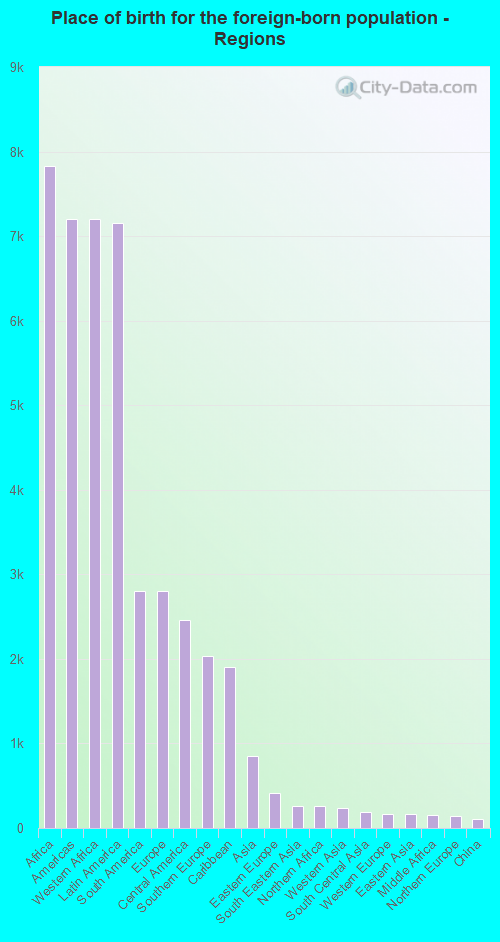
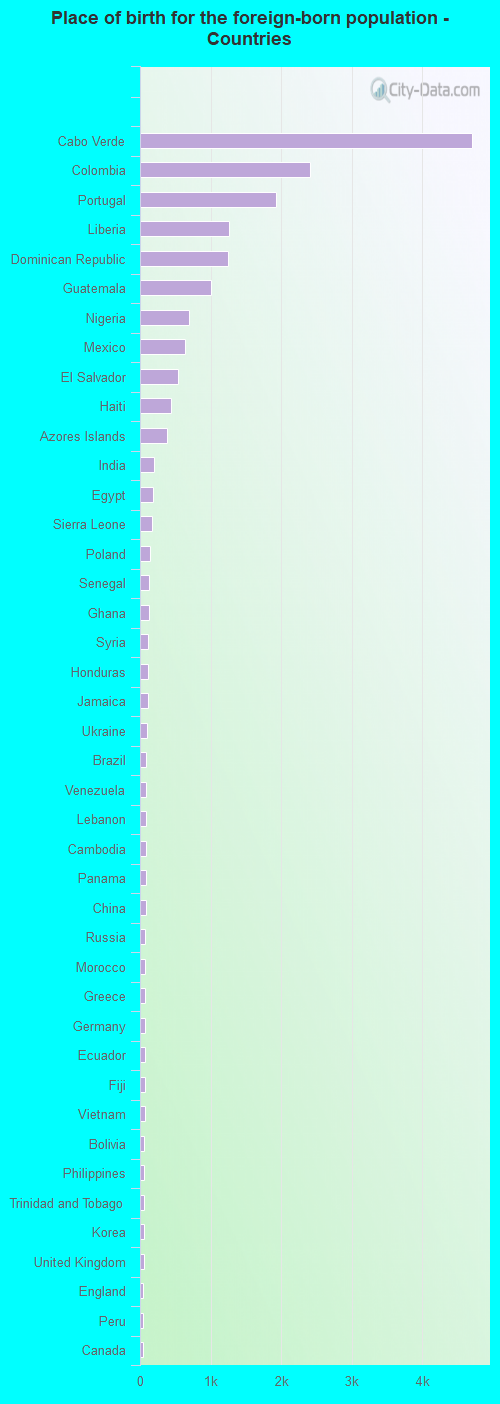
Place of birth for residents in Pawtucket 7,831 Africa7,204 Americas7,199 Western Africa7,160 Latin America2,801 South America2,797 Europe2,458 Central America2,031 Southern Europe1,900 Caribbean852 Asia419 Eastern Europe263 South Eastern Asia263 Northern Africa234 Western Asia194 South Central Asia169 Western Europe160 Eastern Asia154 Middle Africa138 Northern Europe103 China64 Oceania43 Northern America15 Eastern Africa4,708 Cabo Verde2,413 Colombia1,925 Portugal1,256 Liberia1,252 Dominican Republic1,005 Guatemala691 Nigeria638 Mexico538 El Salvador434 Haiti388 Azores Islands194 India191 Egypt163 Sierra Leone142 Poland134 Senegal130 Ghana116 Syria115 Honduras109 Jamaica98 Ukraine91 Brazil86 Venezuela86 Lebanon83 Cambodia83 Panama79 China77 Russia71 Morocco67 Greece67 Germany66 Ecuador64 Fiji64 Vietnam63 Bolivia60 Philippines58 Trinidad and Tobago57 Korea55 United Kingdom45 England45 Peru43 Canada40 Austria40 Nicaragua39 Netherlands38 Italy37 Thailand36 Latvia30 Belarus23 Taiwan21 Belize20 Israel18 Togo17 Ireland15 Tanzania15 Argentina15 Costa Rica11 Jordan11 Chile10 Scotland10 Norway9 Malaysia8 Laos8 Guyana6 Barbados6 Cuba5 France
Grandparents responsible for own grandchildren in Pawtucket
Grandparents (30 to 59 years) White / Caucasian 53 42.3% Responsible for grandchildren72 57.7% Not responsible for grandchildrenBlack or African American 99 78.3% Responsible for grandchildren27 21.7% Not responsible for grandchildrenAsian 24 100.0% Not responsible for grandchildrenNative Hawaiian / Pacific Islander 19 100.0% Not responsible for grandchildrenOther race 64 52.7% Responsible for grandchildren58 47.3% Not responsible for grandchildrenTwo or more races 12 89.3% Responsible for grandchildren1 10.7% Not responsible for grandchildrenWhite alone, not Hispanic / Latino 83 63.5% Responsible for grandchildren48 36.5% Not responsible for grandchildrenHispanic or Latino 53 33.8% Responsible for grandchildren104 66.2% Not responsible for grandchildrenGrandparents (60 years and over) White / Caucasian 42 17.6% Responsible for grandchildren197 82.4% Not responsible for grandchildrenBlack or African American 40 25.2% Responsible for grandchildren120 74.8% Not responsible for grandchildrenAsian 5 100.0% Not responsible for grandchildrenNative Hawaiian / Pacific Islander 12 100.0% Not responsible for grandchildrenOther race 140 100.0% Not responsible for grandchildrenTwo or more races 8 6.4% Responsible for grandchildren113 93.6% Not responsible for grandchildrenWhite alone, not Hispanic / Latino 25 10.7% Responsible for grandchildren208 89.3% Not responsible for grandchildrenHispanic or Latino 54 32.7% Responsible for grandchildren110 67.3% Not responsible for grandchildren