Park Ridge, IL (Illinois) Houses and Residents
| Park Ridge: | $532,094 |
| Illinois: | $251,600 |
Mean price in 2022:
Detached houses: $627,497
Here: $627,497 State: $310,164 Townhouses or other attached units: $471,787
Here: $471,787 State: $286,230 In 2-unit structures: $452,338
Here: $452,338 State: $299,638 In 3-to-4-unit structures: $191,599
Here: $191,599 State: $330,907 In 5-or-more-unit structures: $275,974
Here: $275,974 State: $318,887
Total population: 37,856 (Urban population: 37,735, Rural population: 0)
Houses: 16,268 (15,298 occupied: 13,238 owner occupied, 2,321 renter occupied)
| % of renters here: | 15% |
| State: | 33% |
Housing density: 2,315 houses/condos per square mile
Median price asked for vacant for-sale houses and condos in 2022: $389,868.
Median contract rent in 2022: $1,376 (lower quartile is $1,066, upper quartile is over $2,000)
Median rent asked for vacant for-rent units in 2022: $3,021
Median gross rent in Park Ridge, IL in 2022: $1,480
Housing units in Park Ridge with a mortgage: 7,587 (1,006 second mortgage, 165 home equity loan, 783 both second mortgage and home equity loan)
Houses without a mortgage: 262
Median household income for houses/condos with a mortgage: $187,872
Median household income for apartments without a mortgage: $105,006
Median monthly housing costs: $1,962
Compare current foreclosures in Park Ridge, IL:
| Photo | Address | Area | Beds / Baths | Price | Details |
|---|---|---|---|---|---|

|
#1
S Prospect Ave
Park Ridge, IL 60068
|
2,433 sq. feet
|
1 baths - beds |
show details | |

|
#2
N Greenwood Ave
Park Ridge, IL 60068
|
1,148 sq. feet
|
1 baths - beds |
show details | |

|
#3
Potter Rd
Park Ridge, IL 60068
|
940 sq. feet
|
2 baths - beds |
show details | |

|
#4
Devon Ave
Park Ridge, IL 60068
|
974 sq. feet
|
1 baths - beds |
show details | |

|
#5
W Sibley St
Park Ridge, IL 60068
|
1,101 sq. feet
|
1 baths - beds |
show details | |

|
#6
Seeley Ave
Park Ridge, IL 60068
|
884 sq. feet
|
1 baths - beds |
show details | |

|
#7
S Western Ave
Park Ridge, IL 60068
|
2,178 sq. feet
|
2 baths - beds |
show details | |

|
#8
Milton Ave
Park Ridge, IL 60068
|
1,080 sq. feet
|
1 baths - beds |
show details | |

|
#9
N Dee Rd
Park Ridge, IL 60068
|
1,275 sq. feet
|
2 baths - beds |
show details | |

|
#10
Parkwood Ave
Park Ridge, IL 60068
|
1,829 sq. feet
|
2 baths - beds |
show details |
| Photo | Address | Area | Beds / Baths | Price | Details |
|---|---|---|---|---|---|

|
#11
Rene Ct
Park Ridge, IL 60068
|
1,660 sq. feet
|
1 baths - beds |
show details | |

|
#12
Beau Dr
Park Ridge, IL 60068
|
2,004 sq. feet
|
2 baths - beds |
show details | |

|
#13
Granville Ave
Park Ridge, IL 60068
|
2,166 sq. feet
|
2 baths - beds |
show details | |

|
#14
W Touhy Ave
Park Ridge, IL 60068
|
1,560 sq. feet
|
2 baths - beds |
show details | |

|
#15
Birch St
Park Ridge, IL 60068
|
1,901 sq. feet
|
2 baths - beds |
show details | |

|
#16
S Prospect Ave
Park Ridge, IL 60068
|
1,156 sq. feet
|
1 baths - beds |
show details | |

|
#17
Park Plaine Ave
Park Ridge, IL 60068
|
1,138 sq. feet
|
1 baths - beds |
show details | |

|
#18
Oriole Ave
Park Ridge, IL 60068
|
1,068 sq. feet
|
1 baths - beds |
show details | |

|
#19
W Touhy Ave # 2s
Park Ridge, IL 60068
|
6,649 sq. feet
|
6 baths - beds |
show details | |

|
#20
S Western Ave
Park Ridge, IL 60068
|
1,370 sq. feet
|
1 baths - beds |
show details |
| Photo | Address | Area | Beds / Baths | Price | Details |
|---|---|---|---|---|---|

|
#21
S Chester Ave
Park Ridge, IL 60068
|
1,121 sq. feet
|
1 baths - beds |
show details | |

|
#22
N Northwest Hwy Apt 1
Park Ridge, IL 60068
|
- sq. feet
|
- baths - beds |
show details | |

|
#23
Courtland Ave # 202
Park Ridge, IL 60068
|
- sq. feet
|
- baths - beds |
show details | |

|
#24
N Dee Rd
Park Ridge, IL 60068
|
- sq. feet
|
- baths - beds |
show details | |

|
#25
N Delphia Ave
Park Ridge, IL 60068
|
- sq. feet
|
- baths - beds |
show details | |

|
#26
S Fairview Ave
Park Ridge, IL 60068
|
- sq. feet
|
- baths - beds |
show details | |

|
#27
Higgins Rd # R2
Park Ridge, IL 60068
|
- sq. feet
|
- baths - beds |
show details | |

|
#28
Shibley Ave
Park Ridge, IL 60068
|
- sq. feet
|
- baths - beds |
show details | |

|
#29
S Vine Ave
Park Ridge, IL 60068
|
- sq. feet
|
- baths - beds |
show details | |

|
#30
W Touhy Ave Apt 1e
Park Ridge, IL 60068
|
- sq. feet
|
- baths - beds |
show details |
| Photo | Address | Area | Beds / Baths | Price | Details |
|---|---|---|---|---|---|

|
#31
Virginia St
Park Ridge, IL 60068
|
- sq. feet
|
- baths - beds |
show details | |

|
#32
W Touhy Ave Apt 2d
Park Ridge, IL 60068
|
- sq. feet
|
- baths - beds |
show details | |

|
#33
N Dee Rd
Park Ridge, IL 60068
|
- sq. feet
|
- baths - beds |
show details | |

|
#34
Windsor Mall Apt 2g
Park Ridge, IL 60068
|
- sq. feet
|
- baths - beds |
show details | |

|
#35
W Touhy Ave Apt 3e
Park Ridge, IL 60068
|
- sq. feet
|
- baths - beds |
show details | |

|
#36
Peterson Ave Unit A
Park Ridge, IL 60068
|
- sq. feet
|
- baths - beds |
show details | |

|
#37
N Seminary Ave
Park Ridge, IL 60068
|
- sq. feet
|
- baths - beds |
show details | |

|
Check over 1 million property listings on Foreclosure.com!
|
browse all offers | |||


 | Why are homes so overpriced in the Chicago suburbs? (41 replies) |
| Rental recommendations in Park Ridge? (0 replies) |
| Chicago Suburbs With The Most Beautiful Houses (26 replies) |
| Park Ridge Real Estate Market (4 replies) |
| La Grange or Park Ridge (or Wilmette)? (25 replies) |
| Is it unethical or illegal to buy a rental/condo in a great school district if you don't live there? (21 replies) |

Median year apartment built: 1969
Household type by relationship:
Households: 38,493- Male householders: 7,622 (1,518 living alone), Female householders: 7,272 (2,210 living alone)
8,945 spouses (8,911 opposite-sex spouses), 450 unmarried partners, (434 opposite-sex unmarried partners), 12,650 children (12,174 natural, 110 adopted, 365 stepchildren), 132 grandchildren, 202 brothers or sisters, 387 parents, 0 foster children, 66 other relatives, 231 non-relatives
- In group quarters: 530
Size of family households: 4,789 2-persons, 2,473 3-persons, 2,968 4-persons, 659 5-persons, 141 6-persons, 96 7-or-more-persons.
Size of nonfamily households: 4,006 1-person, 307 2-persons, 11 3-persons, 18 4-persons.
7,102 married couples with children.
1,328 single-parent households (314 men, 1,014 women).
77.3% of residents of Park Ridge speak English at home.
4.1% of residents speak Spanish at home (86% speak English very well, 9% speak English well, 4% speak English not well, 2% don't speak English at all).
14.8% of residents speak other Indo-European language at home (75% speak English very well, 19% speak English well, 6% speak English not well).
3.0% of residents speak Asian or Pacific Island language at home (70% speak English very well, 15% speak English well, 11% speak English not well, 4% don't speak English at all).
0.9% of residents speak other language at home (56% speak English very well, 31% speak English well, 3% speak English not well, 10% don't speak English at all).
Foreign born population: 5,560 (14.4%)
(80.3% of them are naturalized citizens)
| Here: | 7.2 |
| State: | 6.4 |
| Here: | 4.0 |
| State: | 4.1 |

- Bedrooms in owner-occupied houses and condos in Park Ridge, Illinois
- 19no bedroom
- 2991 bedroom
- 2,1922 bedrooms
- 5,7013 bedrooms
- 3,8054 bedrooms
- 1,2235+ bedrooms

- Bedrooms in renter-occupied apartments in Park Ridge, Illinois
- 38no bedroom
- 7551 bedroom
- 8692 bedrooms
- 4483 bedrooms
- 1724 bedrooms
- 405+ bedrooms

- Cars and other vehicles available in Park Ridge in owner-occupied houses/condos
- 439no vehicle
- 3,9021 vehicle
- 6,4092 vehicles
- 1,7583 vehicles
- 5564 vehicles
- 1755+ vehicles

- Cars and other vehicles available in Park Ridge in renter-occupied apartments
- 388no vehicle
- 1,3401 vehicle
- 4672 vehicles
- 633 vehicles
- 634 vehicles
- 05+ vehicles

- Rooms in owner-occupied houses in Park Ridge, Illinois
- 111 room
- 262 rooms
- 3273 rooms
- 7594 rooms
- 1,9305 rooms
- 1,9356 rooms
- 2,2927 rooms
- 2,3728 rooms
- 3,5879+ rooms

- Rooms in renter-occupied apartments in Park Ridge, Illinois
- 301 room
- 3212 rooms
- 5413 rooms
- 4834 rooms
- 3555 rooms
- 2056 rooms
- 517 rooms
- 1438 rooms
- 1929+ rooms


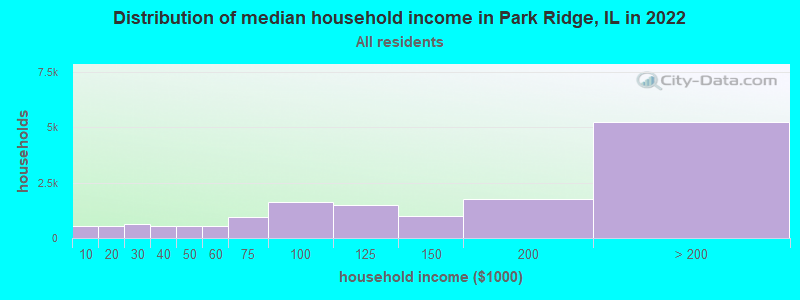
Park Ridge, IL household income distribution

- 550Less than $10,000
- 546$10,000 to $19,999
- 614$20,000 to $29,999
- 558$30,000 to $39,999
- 556$40,000 to $49,999
- 536$50,000 to $59,999
- 947$60,000 to $74,999
- 1,627$75,000 to $99,999
- 1,468$100,000 to $124,999
- 992$125,000 to $149,999
- 1,754$150,000 to $199,999
- 5,232$200,000 or more
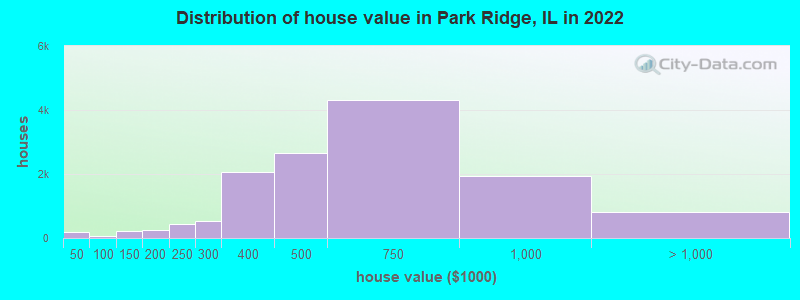
Home value of owner - occupied houses in 2022 in Park Ridge, IL
-
- 93Less than $10,000
- 12$10,000 to $14,999
- 11$15,000 to $19,999
- 51$30,000 to $34,999
- 9$40,000 to $49,999
- 33$50,000 to $59,999
- 13$90,000 to $99,999
- 85$100,000 to $124,999
- 125$125,000 to $149,999
- 125$150,000 to $174,999
- 131$175,000 to $199,999
- 435$200,000 to $249,999
- 532$250,000 to $299,999
- 2,056$300,000 to $399,999
- 2,661$400,000 to $499,999
- 4,306$500,000 to $749,999
- 1,938$750,000 to $999,999
- 688$1,000,000 to $1,499,999
- 61$1,500,000 to $1,999,999
- 62$2,000,000 or more
Rent paid by renters in 2022 in Park Ridge, IL
-
- 53$250 to $299
- 55$500 to $549
- 16$600 to $649
- 156$800 to $899
- 92$900 to $999
- 515$1,000 to $1,249
- 209$1,250 to $1,499
- 382$1,500 to $1,999
- 205$2,000 to $2,499
- 160$2,500 to $2,999
- 35$3,000 to $3,499
- 79$3,500 or more
- 391No cash rent

Percentage of workers working in this county: 89.1%
Number of people working at home: 5,183 (26.5% of all workers)
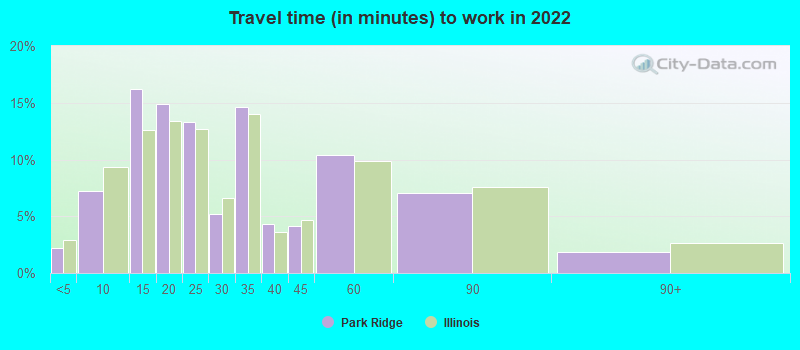
Travel time to work (commute)
- Less than 5 minutes: 436
- 5 to 9 minutes: 1,150
- 10 to 14 minutes: 1,822
- 15 to 19 minutes: 1,536
- 20 to 24 minutes: 1,753
- 25 to 29 minutes: 1,416
- 30 to 34 minutes: 2,484
- 35 to 39 minutes: 528
- 40 to 44 minutes: 624
- 45 to 59 minutes: 1,692
- 60 to 89 minutes: 1,374
- 90 or more minutes: 96
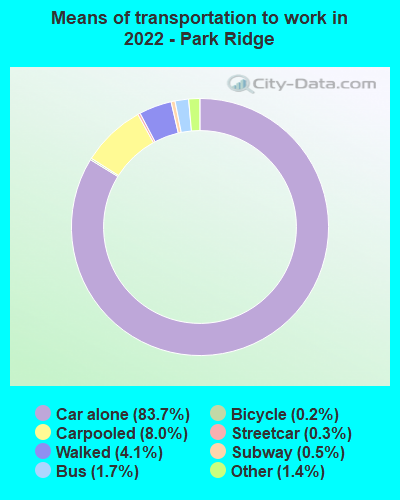
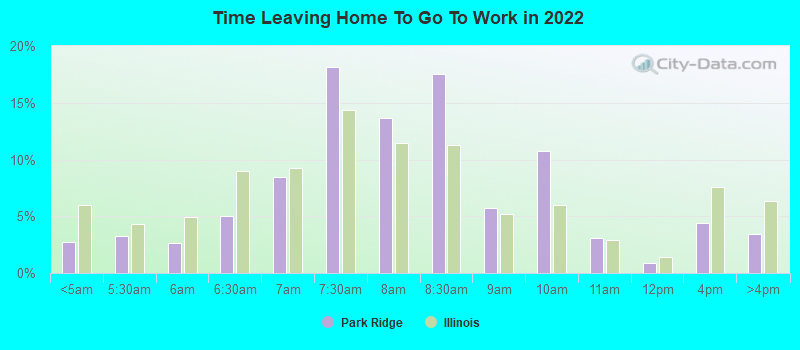
Means of transportation to work:
- Drove a car alone: 13,852 (66.3%)
- Carpooled: 1,425 (6.8%)
- Bus: 266 (1.3%)
- Subway or elevated rail: 38 (0.2%)
- Long-distance train or commuter rail: 58 (0.3%)
- Taxi: 225 (1.1%)
- Bicycle: 36 (0.2%)
- Walked: 699 (3.3%)
- Worked at home: 5,183 (24.8%)
- Unemployment by race in 2022
- Unemployment rate for White non-Hispanic residents
- 3.3%Males
- 1.9%Females
- Unemployment rate for Black residents
- 1.5%Males
- 8.1%Females
- Unemployment rate for Asian residents
- 2.4%Males
- 1.2%Females
- Unemployment rate for other race residents
- 14.9%Males
- Unemployment rate for two or more race residents
- 2.5%Males
- Unemployment rate for Hispanic or Latino residents
- 5.1%Males

- Year of entry for the foreign-born population in Park Ridge, Illinois
- 1,1022010 or later
- 9822000 to 2009
- 1,2071990 to 1999
- 1,0111980 to 1989
- 7871970 to 1979
- 1,929Before 1970

First ancestries reported:
- Polish: 3,662 (21.6%)
- Irish: 1,949 (11.5%)
- German: 1,883 (11.1%)
- Italian: 1,296 (7.7%)
- American: 971 (5.7%)
- Greek: 511 (3.0%)
- Ukrainian: 468 (2.8%)
- English: 430 (2.5%)
- Serbian: 401 (2.4%)
- European: 363 (2.1%)
- Scandinavian: 219 (1.3%)
- Romanian: 155 (0.9%)
- Norwegian: 150 (0.9%)
- Assyrian: 128 (0.8%)
- Croatian: 122 (0.7%)
- Albanian: 112 (0.7%)
- Iranian: 111 (0.7%)
- Macedonian: 83 (0.5%)
- Bulgarian: 83 (0.5%)
- Eastern European: 79 (0.5%)
- Czech: 74 (0.4%)
- Belgian: 70 (0.4%)
- Lithuanian: 64 (0.4%)
- Scottish: 62 (0.4%)
- Swedish: 59 (0.3%)
- African: 52 (0.3%)
- Austrian: 51 (0.3%)
- Russian: 46 (0.3%)
- Iraqi: 42 (0.2%)
- Lebanese: 37 (0.2%)
- Dutch: 36 (0.2%)
- Yugoslavian: 34 (0.2%)
- Egyptian: 33 (0.2%)
- Luxembourger: 32 (0.2%)
- French: 32 (0.2%)
- Slovene: 26 (0.2%)
- Armenian: 22 (0.1%)
- Slovak: 22 (0.1%)
- Syrian: 19 (0.1%)
- Czechoslovakian: 17 (0.1%)
- British: 16 (0.09%)
- Scotch-Irish: 16 (0.09%)
- Finnish: 15 (0.09%)
- Palestinian: 13 (0.08%)
- Brazilian: 10 (0.06%)
- Danish: 9 (0.05%)
- Arab: 8 (0.05%)
- Swiss: 7 (0.04%)
- French Canadian: 4 (0.02%)
- Israeli: 1 (0.01%)
Most common places of birth for foreign-born residents (%):
| Park Ridge: | 27.6% (1,533) |
| Illinois: | 6.9% (124,474) |
| Park Ridge: | 10.1% (560) |
| Illinois: | 5.2% (93,003) |
| Park Ridge: | 8.0% (444) |
| Illinois: | 1.6% (29,316) |
| Park Ridge: | 6.8% (379) |
| Illinois: | 9.2% (166,409) |
| Park Ridge: | 4.6% (258) |
| Illinois: | 34.7% (626,958) |
| Park Ridge: | 2.7% (149) |
| Illinois: | 0.7% (13,214) |
| Park Ridge: | 2.6% (145) |
| Illinois: | 0.5% (8,574) |
| Park Ridge: | 2.4% (132) |
| Illinois: | 1.0% (18,753) |
| Park Ridge: | 2.1% (117) |
| Illinois: | 0.9% (15,679) |
| Park Ridge: | 2.0% (109) |
| Illinois: | 0.4% (6,611) |
| Park Ridge: | 1.9% (106) |
| Illinois: | 0.6% (10,776) |
| Park Ridge: | 1.7% (92) |
| Illinois: | 0.8% (14,736) |
| Park Ridge: | 1.6% (89) |
| Illinois: | 0.6% (10,720) |
| Park Ridge: | 1.5% (86) |
| Illinois: | 0.9% (16,553) |
Place of birth for U.S.-born residents:
- This state: 27,227
- Other state: 5,099
- Northeast: 1,023
- Midwest: 2,625
- South: 826
- West: 687
91.8% of Park Ridge residents lived in the same house 1 years ago.
Out of people who lived in different houses, 42.4% lived in this county.
Out of people who lived in different counties, 37.6% lived in Illinois.
| Park Ridge: | 91.8% |
| State average: | 88.3% |
Education attainment for males 25 years and older:
- No schooling: 103
- Nursery to 4th grade: 34
- 5th and 6th grade: 30
- 7th and 8th grade: 24
- 9th grade: 27
- 10th grade: 55
- 11th grade: 27
- 12th grade, no diploma: 101
- High school graduate (or equivalency): 1,644
- Less than 1 year of college: 503
- Some college more than 1 year, no degree: 1,313
- Associate degree: 545
- Bachelor's degree: 5,232
- Master's degree: 2,472
- Professional school degree: 756
- Doctorate degree: 280

Education attainment for females 25 years and older:
- No schooling: 343
- Nursery to 4th grade: 0
- 5th and 6th grade: 56
- 7th and 8th grade: 27
- 9th grade: 27
- 10th grade: 22
- 11th grade: 40
- 12th grade, no diploma: 158
- High school graduate (or equivalency): 1,876
- Less than 1 year of college: 659
- Some college more than 1 year, no degree: 1,206
- Associate degree: 859
- Bachelor's degree: 5,243
- Master's degree: 3,059
- Professional school degree: 606
- Doctorate degree: 326


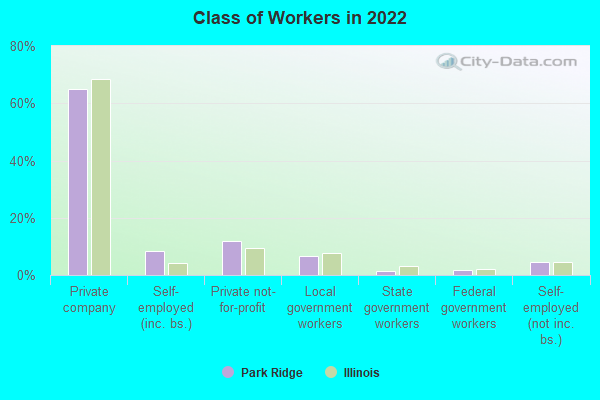
Housing units in structures:
- One, detached: 11,525
- One, attached: 719
- Two: 464
- 3 or 4: 237
- 5 to 9: 632
- 10 to 19: 763
- 20 to 49: 1,072
- 50 or more: 638
- Mobile homes: 50
- Boats, RVs, vans, etc.: 163
Housing units lacking complete kitchen facilities in 2022: 2.0%
House/condo owner moved in on average 15 years ago
Renter moved in on average 3 years ago

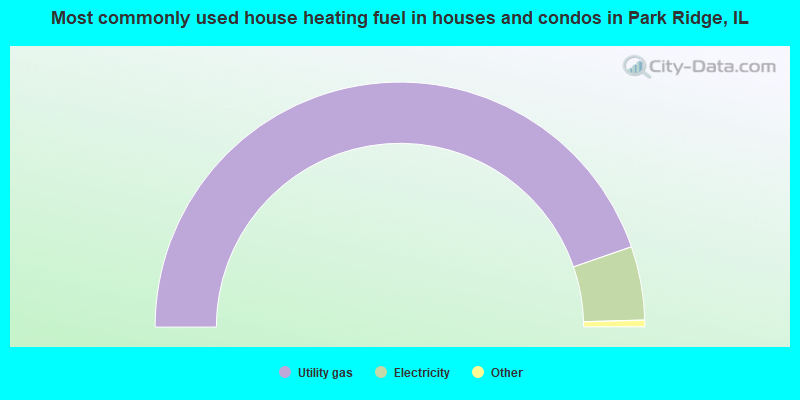
- 89.4%Utility gas
- 9.7%Electricity
- 0.5%Bottled, tank, or LP gas
- 0.3%No fuel used
- 0.1%Other fuel
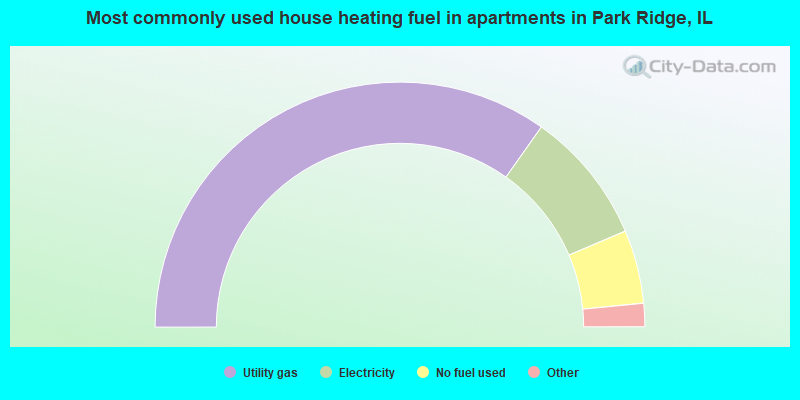
- 69.6%Utility gas
- 17.6%Electricity
- 9.7%No fuel used
- 2.7%Bottled, tank, or LP gas
- 0.4%Other fuel
Private vs. public school enrollment:
| Here: | 18.6% |
| Illinois: | 13.3% |
| Here: | 10.4% |
| Illinois: | 9.9% |
| Here: | 24.0% |
| Illinois: | 27.4% |


