Races in Park Ridge, Illinois (IL) Detailed Stats
Data:
Races - White alone (%)
Races - White alone (% change since 2000)
Races - Black alone (%)
Races - Black alone (% change since 2000)
Races - American Indian alone (%)
Races - American Indian alone (% change since 2000)
Races - Asian alone (%)
Races - Asian alone (% change since 2000)
Races - Hispanic (%)
Races - Hispanic (% change since 2000)
Races - Native Hawaiian and Other Pacific Islander alone (%)
Races - Native Hawaiian and Other Pacific Islander alone (% change since 2000)
Races - Two or more races(%)
Races - Two or more races(% change since 2000)
Races - Other race alone (%)
Races - Other race alone (% change since 2000)
Racial diversity
Place of birth - Born in state of residence (%)
Place of birth - Born in state of residence (%) - White
Place of birth - Born in state of residence (%) - Black or African American
Place of birth - Born in state of residence (%) - Asian
Place of birth - Born in state of residence (%) - Hispanic or Latino
Place of birth - Born in state of residence (%) - American Indian and Alaska Native
Place of birth - Born in state of residence (%) - Multirace
Place of birth - Born in state of residence (%) - Other Race
Place of birth - Born in other state (%)
Place of birth - Born in other state (%) - White
Place of birth - Born in other state (%) - Black or African American
Place of birth - Born in other state (%) - Asian
Place of birth - Born in other state (%) - Hispanic or Latino
Place of birth - Born in other state (%) - American Indian and Alaska Native
Place of birth - Born in other state (%) - Multirace
Place of birth - Born in other state (%) - Other Race
Place of birth - Native, outside of US (%)
Place of birth - Native, outside of US (%) - White
Place of birth - Native, outside of US (%) - Black or African American
Place of birth - Native, outside of US (%) - Asian
Place of birth - Native, outside of US (%) - Hispanic or Latino
Place of birth - Native, outside of US (%) - American Indian and Alaska Native
Place of birth - Native, outside of US (%) - Multirace
Place of birth - Native, outside of US (%) - Other Race
Place of birth - Foreign born (%)
Place of birth - Foreign born (%) - White
Place of birth - Foreign born (%) - Black or African American
Place of birth - Foreign born (%) - Asian
Place of birth - Foreign born (%) - Hispanic or Latino
Place of birth - Foreign born (%) - American Indian and Alaska Native
Place of birth - Foreign born (%) - Multirace
Place of birth - Foreign born (%) - Other Race
Residents speaking English at home (%)
Residents speaking English at home - Born in the United States (%)
Residents speaking English at home - Native, born elsewhere (%)
Residents speaking English at home - Foreign born (%)
Residents speaking Spanish at home (%)
Residents speaking Spanish at home - Born in the United States (%)
Residents speaking Spanish at home - Native, born elsewhere (%)
Residents speaking Spanish at home - Foreign born (%)
Residents speaking other language at home (%)
Residents speaking other language at home - Born in the United States (%)
Residents speaking other language at home - Native, born elsewhere (%)
Residents speaking other language at home - Foreign born (%)
Marital status - Never married (%)
Marital status - Now married (%)
Marital status - Separated (%)
Marital status - Widowed (%)
Marital status - Divorced (%)
Ancestries Reported - Arab (%)
Ancestries Reported - Czech (%)
Ancestries Reported - Danish (%)
Ancestries Reported - Dutch (%)
Ancestries Reported - English (%)
Ancestries Reported - French (%)
Ancestries Reported - French Canadian (%)
Ancestries Reported - German (%)
Ancestries Reported - Greek (%)
Ancestries Reported - Hungarian (%)
Ancestries Reported - Irish (%)
Ancestries Reported - Italian (%)
Ancestries Reported - Lithuanian (%)
Ancestries Reported - Norwegian (%)
Ancestries Reported - Polish (%)
Ancestries Reported - Portuguese (%)
Ancestries Reported - Russian (%)
Ancestries Reported - Scotch-Irish (%)
Ancestries Reported - Scottish (%)
Ancestries Reported - Slovak (%)
Ancestries Reported - Subsaharan African (%)
Ancestries Reported - Swedish (%)
Ancestries Reported - Swiss (%)
Ancestries Reported - Ukrainian (%)
Ancestries Reported - United States (%)
Ancestries Reported - Welsh (%)
Ancestries Reported - West Indian (%)
Ancestries Reported - Other (%)
Geographical mobility - Same house 1 year ago (%)
Geographical mobility - Same house 1 year ago (%) - White
Geographical mobility - Same house 1 year ago (%) - Black or African American
Geographical mobility - Same house 1 year ago (%) - Asian
Geographical mobility - Same house 1 year ago (%) - Hispanic or Latino
Geographical mobility - Same house 1 year ago (%) - American Indian and Alaska Native
Geographical mobility - Same house 1 year ago (%) - Multirace
Geographical mobility - Same house 1 year ago (%) - Other Race
Geographical mobility - Moved within same county (%)
Geographical mobility - Moved within same county (%) - White
Geographical mobility - Moved within same county (%) - Black or African American
Geographical mobility - Moved within same county (%) - Asian
Geographical mobility - Moved within same county (%) - Hispanic or Latino
Geographical mobility - Moved within same county (%) - American Indian and Alaska Native
Geographical mobility - Moved within same county (%) - Multirace
Geographical mobility - Moved within same county (%) - Other Race
Geographical mobility - Moved from different county within same state (%)
Geographical mobility - Moved from different county within same state (%) - White
Geographical mobility - Moved from different county within same state (%) - Black or African American
Geographical mobility - Moved from different county within same state (%) - Asian
Geographical mobility - Moved from different county within same state (%) - Hispanic or Latino
Geographical mobility - Moved from different county within same state (%) - American Indian and Alaska Native
Geographical mobility - Moved from different county within same state (%) - Multirace
Geographical mobility - Moved from different county within same state (%) - Other Race
Geographical mobility - Moved from different state (%)
Geographical mobility - Moved from different state (%) - White
Geographical mobility - Moved from different state (%) - Black or African American
Geographical mobility - Moved from different state (%) - Asian
Geographical mobility - Moved from different state (%) - Hispanic or Latino
Geographical mobility - Moved from different state (%) - American Indian and Alaska Native
Geographical mobility - Moved from different state (%) - Multirace
Geographical mobility - Moved from different state (%) - Other Race
Geographical mobility - Moved from abroad (%)
Geographical mobility - Moved from abroad (%) - White
Geographical mobility - Moved from abroad (%) - Black or African American
Geographical mobility - Moved from abroad (%) - Asian
Geographical mobility - Moved from abroad (%) - Hispanic or Latino
Geographical mobility - Moved from abroad (%) - American Indian and Alaska Native
Geographical mobility - Moved from abroad (%) - Multirace
Geographical mobility - Moved from abroad (%) - Other Race
Place of birth for the foreign-born population - Ireland (%)
Place of birth for the foreign-born population - Denmark (%)
Place of birth for the foreign-born population - Norway (%)
Place of birth for the foreign-born population - Sweden (%)
Place of birth for the foreign-born population - United Kingdom (%)
Place of birth for the foreign-born population - England (%)
Place of birth for the foreign-born population - Scotland (%)
Place of birth for the foreign-born population - Other Northern Europe (%)
Place of birth for the foreign-born population - Austria (%)
Place of birth for the foreign-born population - Belgium (%)
Place of birth for the foreign-born population - France (%)
Place of birth for the foreign-born population - Germany (%)
Place of birth for the foreign-born population - Netherlands (%)
Place of birth for the foreign-born population - Switzerland (%)
Place of birth for the foreign-born population - Other Western Europe (%)
Place of birth for the foreign-born population - Greece (%)
Place of birth for the foreign-born population - Italy (%)
Place of birth for the foreign-born population - Portugal (%)
Place of birth for the foreign-born population - Spain (%)
Place of birth for the foreign-born population - Other Southern Europe (%)
Place of birth for the foreign-born population - Albania (%)
Place of birth for the foreign-born population - Belarus (%)
Place of birth for the foreign-born population - Bosnia and Herzegovina (%)
Place of birth for the foreign-born population - Bulgaria (%)
Place of birth for the foreign-born population - Croatia (%)
Place of birth for the foreign-born population - Czechoslovakia (%)
Place of birth for the foreign-born population - Hungary (%)
Place of birth for the foreign-born population - Latvia (%)
Place of birth for the foreign-born population - Lithuania (%)
Place of birth for the foreign-born population - North Macedonia (Macedonia) (%)
Place of birth for the foreign-born population - Moldova (%)
Place of birth for the foreign-born population - Poland (%)
Place of birth for the foreign-born population - Romania (%)
Place of birth for the foreign-born population - Russia (%)
Place of birth for the foreign-born population - Serbia (%)
Place of birth for the foreign-born population - Ukraine (%)
Place of birth for the foreign-born population - Other Eastern Europe (%)
Place of birth for the foreign-born population - China (%)
Place of birth for the foreign-born population - Hong Kong (%)
Place of birth for the foreign-born population - Taiwan (%)
Place of birth for the foreign-born population - Japan (%)
Place of birth for the foreign-born population - Korea (%)
Place of birth for the foreign-born population - Other Eastern Asia (%)
Place of birth for the foreign-born population - Afghanistan (%)
Place of birth for the foreign-born population - Bangladesh (%)
Place of birth for the foreign-born population - India (%)
Place of birth for the foreign-born population - Iran (%)
Place of birth for the foreign-born population - Kazakhstan (%)
Place of birth for the foreign-born population - Nepal (%)
Place of birth for the foreign-born population - Pakistan (%)
Place of birth for the foreign-born population - Sri Lanka (%)
Place of birth for the foreign-born population - Uzbekistan (%)
Place of birth for the foreign-born population - Other South Central Asia (%)
Place of birth for the foreign-born population - Burma (%)
Place of birth for the foreign-born population - Cambodia (%)
Place of birth for the foreign-born population - Indonesia (%)
Place of birth for the foreign-born population - Laos (%)
Place of birth for the foreign-born population - Malaysia (%)
Place of birth for the foreign-born population - Philippines (%)
Place of birth for the foreign-born population - Singapore (%)
Place of birth for the foreign-born population - Thailand (%)
Place of birth for the foreign-born population - Vietnam (%)
Place of birth for the foreign-born population - Other South Eastern Asia (%)
Place of birth for the foreign-born population - Armenia (%)
Place of birth for the foreign-born population - Iraq (%)
Place of birth for the foreign-born population - Israel (%)
Place of birth for the foreign-born population - Jordan (%)
Place of birth for the foreign-born population - Kuwait (%)
Place of birth for the foreign-born population - Lebanon (%)
Place of birth for the foreign-born population - Saudi Arabia (%)
Place of birth for the foreign-born population - Syria (%)
Place of birth for the foreign-born population - Turkey (%)
Place of birth for the foreign-born population - Yemen (%)
Place of birth for the foreign-born population - Other Western Asia (%)
Place of birth for the foreign-born population - Eritrea (%)
Place of birth for the foreign-born population - Ethiopia (%)
Place of birth for the foreign-born population - Kenya (%)
Place of birth for the foreign-born population - Somalia (%)
Place of birth for the foreign-born population - Uganda (%)
Place of birth for the foreign-born population - Zimbabwe (%)
Place of birth for the foreign-born population - Other Eastern Africa (%)
Place of birth for the foreign-born population - Cameroon (%)
Place of birth for the foreign-born population - Congo (%)
Place of birth for the foreign-born population - Democratic Republic of Congo (Zaire) (%)
Place of birth for the foreign-born population - Other Middle Africa (%)
Place of birth for the foreign-born population - Egypt (%)
Place of birth for the foreign-born population - Morocco (%)
Place of birth for the foreign-born population - Sudan (%)
Place of birth for the foreign-born population - Other Northern Africa (%)
Place of birth for the foreign-born population - South Africa (%)
Place of birth for the foreign-born population - Other Southern Africa (%)
Place of birth for the foreign-born population - Cabo Verde (%)
Place of birth for the foreign-born population - Ghana (%)
Place of birth for the foreign-born population - Liberia (%)
Place of birth for the foreign-born population - Nigeria (%)
Place of birth for the foreign-born population - Senegal (%)
Place of birth for the foreign-born population - Sierra Leone (%)
Place of birth for the foreign-born population - Other Western Africa (%)
Place of birth for the foreign-born population - Australia (%)
Place of birth for the foreign-born population - New Zealand (%)
Place of birth for the foreign-born population - Fiji (%)
Place of birth for the foreign-born population - Micronesia (%)
Place of birth for the foreign-born population - Bahamas (%)
Place of birth for the foreign-born population - Barbados (%)
Place of birth for the foreign-born population - Cuba (%)
Place of birth for the foreign-born population - Dominica (%)
Place of birth for the foreign-born population - Dominican Republic (%)
Place of birth for the foreign-born population - Grenada (%)
Place of birth for the foreign-born population - Haiti (%)
Place of birth for the foreign-born population - Jamaica (%)
Place of birth for the foreign-born population - St. Vincent and the Grenadines (%)
Place of birth for the foreign-born population - Trinidad and Tobago (%)
Place of birth for the foreign-born population - West Indies (%)
Place of birth for the foreign-born population - Other Caribbean (%)
Place of birth for the foreign-born population - Belize (%)
Place of birth for the foreign-born population - Costa Rica (%)
Place of birth for the foreign-born population - El Salvador (%)
Place of birth for the foreign-born population - Guatemala (%)
Place of birth for the foreign-born population - Honduras (%)
Place of birth for the foreign-born population - Mexico (%)
Place of birth for the foreign-born population - Nicaragua (%)
Place of birth for the foreign-born population - Panama (%)
Place of birth for the foreign-born population - Other Central America (%)
Place of birth for the foreign-born population - Argentina (%)
Place of birth for the foreign-born population - Bolivia (%)
Place of birth for the foreign-born population - Brazil (%)
Place of birth for the foreign-born population - Chile (%)
Place of birth for the foreign-born population - Colombia (%)
Place of birth for the foreign-born population - Ecuador (%)
Place of birth for the foreign-born population - Guyana (%)
Place of birth for the foreign-born population - Peru (%)
Place of birth for the foreign-born population - Uruguay (%)
Place of birth for the foreign-born population - Venezuela (%)
Place of birth for the foreign-born population - Other South America (%)
Place of birth for the foreign-born population - Canada (%)
Place of birth for the foreign-born population - Other Northern America (%)
Place of birth for the foreign-born population - Other (%)
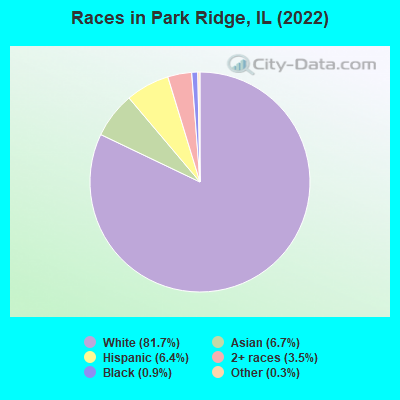
According to 2022 data, the most numerous races in Park Ridge, IL are White alone (31,467 residents), Hispanic (2,464 residents), and Black alone (349 residents). 77.0% of Park Ridge residents speak English at home. 14.4% of Park Ridge, IL residents are foreign-born (8.5% born in Europe, 4.2% born in Asia), which is 3.1% greater than the foreign-born rate of 14.0% across the entire state of Illinois.
Race distribution in Park Ridge
2000 2022
8,424,140 67.8% White alone 1,856,152 14.9% Black alone 1,530,262 12.3% Hispanic 419,916 3.4% Asian alone 153,996 1.2% Two or more races 13,479 0.1% Other race alone 18,232 0.1% American Indian alone 3,116 0.03% Native Hawaiian and Other
7,356,301 58.5% White alone 2,299,726 18.3% Hispanic 1,660,423 13.2% Black alone 747,296 5.9% Asian alone 458,599 3.6% Two or more races 45,386 0.4% Other race alone 10,405 0.08% American Indian alone 3,896 0.03% Native Hawaiian and Other
Income and house value in Park Ridge Median household income in 2022 $133,005 White non-Hispanic householders$154,348 Black householders$141,419 Asian householders$149,638 Some other race householders$145,049 Two or more races householders$135,940 Hispanic or Latino race householdersMedian 2022 house value $552,930 White Non-Hispanic householders$209,302 Black or African American householders$651,163 American Indian or Alaska Native householders $490,047 Asian householders$368,186 Some other race householders$276,093 Two or more races householders$429,953 Hispanic or Latino householders
Median age by race in Park Ridge
49.0 Median age for White residents46.4 51.4 48.2 Median age for Black or African American residents48.0 51.8 31.5 Median age for American Indian / Alaska Native residents-736,736,736.0 29.7 42.8 Median age for Asian residents42.8 43.2 -687,999,999.3 Median age for Native Hawaiian / Pacific Islander residents-918,721,460.3 -610,229,276.3 31.3 Median age for Other race residents31.3 31.6 16.7 Median age for Two or more races residents12.7 20.8 47.9 Median age for White alone residents45.4 50.0 31.8 Median age for Hispanic or Latino residents31.8 34.0
Owner/renter occupied households by race in Park Ridge
House owners and renters - White residents 11,080 86.3% Owner occupied1,763 13.7% Renter occupiedHouse owners and renters - Black or African American residents 31 23.0% Owner occupied104 77.0% Renter occupiedHouse owners and renters - American Indian / Alaska Native residents 24 100.0% Owner occupiedHouse owners and renters - Asian residents 622 80.8% Owner occupied148 19.2% Renter occupiedHouse owners and renters - Other race residents 111 94.2% Owner occupied7 5.8% Renter occupiedHouse owners and renters - Two or more races residents 515 75.0% Owner occupied171 25.0% Renter occupiedHouse owners and renters - White alone residents 11,563 86.4% Owner occupied1,824 13.6% Renter occupiedHouse owners and renters - Hispanic or Latino residents 491 66.8% Owner occupied244 33.2% Renter occupied
Language usage in Park Ridge
English speakers - Total 77.0% of residents of Park Ridge speak English at home.
4.0% of residents speak Spanish at home 1,254 85.8% Speak English very well208 14.2% Speak English less than very well18.9% of residents speak other language at home 5,032 73.3% Speak English very well1,837 26.7% Speak English less than very well
English speakers - Born in the United States 94.8% of residents of Park Ridge speak English at home.
2.3% of residents speak Spanish at home 101 87.1% Speak English very well15 12.9% Speak English less than very well2.8% of residents speak other language at home 141 100.0% Speak English very well
English speakers - Native, born elsewhere 38.2% of residents of Park Ridge speak English at home.
8.2% of residents speak Spanish at home 40 100.0% Speak English very well53.4% of residents speak other language at home 209 80.4% Speak English very well51 19.6% Speak English less than very well
English speakers - Foreign-born 18.0% of residents of Park Ridge speak English at home.
7.9% of residents speak Spanish at home 285 64.9% Speak English very well154 35.1% Speak English less than very well73.1% of residents speak other language at home 2,503 61.8% Speak English very well1,547 38.2% Speak English less than very well
White (Caucasian) - Speak only English Native:
93.8% (23,435)Foreign-born:
22.2% (649)
White (Caucasian) - Speak another language Native:
7.6% (1,910)Foreign-born:
78.4% (2,296)
Asian - Speak only English Native:
69.0% (764)Foreign-born:
14.7% (205)
Asian - Speak another language Native:
31.2% (345)Foreign-born:
84.8% (1,181)
Other race - Speak another language Native:
51.4% (231)Foreign-born:
100.0% (185)
Two or more races - Speak only English Native:
75.8% (1,743)Foreign-born:
28.2% (55)
Two or more races - Speak another language Native:
22.0% (505)Foreign-born:
71.8% (140)
White alone - Speak only English Native:
90.0% (23,707)Foreign-born:
19.3% (706)
White alone - Speak another language Native:
10.1% (2,667)Foreign-born:
80.2% (2,938)
Hispanic or Latino - Speak only English Native:
56.9% (1,027)Foreign-born:
10.5% (45)
Hispanic or Latino - Speak another language Native:
44.7% (808)Foreign-born:
88.8% (381)
Foreign-born residents in Park Ridge 5,560 residents are foreign born (8.5% Europe , 4.2% Asia ).
This city:
14.4%Illinois:
14.1%
Marital status for residents in Park Ridge Marital status - White (Caucasian) population 15 years and over
Males 26.3% Never married63.1% Now married1.4% Separated2.9% Widowed6.3% DivorcedFemales 21.8% Never married57.2% Now married1.5% Separated8.6% Widowed10.9% DivorcedWomen who gave birth in the past 12 months Now married:
97.4% (220)Unmarried:
2.6% (6)
Women who did not give birth in the past 12 months Now married:
51.9% (2,590)Unmarried:
48.1% (2,398)
Marital status - Black or African American population 15 years and over
Males 65.0% Never married32.3% Now married0.0% Separated0.9% Widowed1.8% DivorcedFemales 51.5% Never married19.3% Now married0.0% Separated7.0% Widowed22.2% DivorcedWomen who gave birth in the past 12 months Now married:
0.0% (0)Unmarried:
94.4% (1)
Women who did not give birth in the past 12 months Now married:
38.8% (31)Unmarried:
61.2% (49)
Marital status - Asian population 15 years and over
Males 13.8% Never married85.0% Now married0.0% Separated0.0% Widowed1.2% DivorcedFemales 14.1% Never married71.0% Now married1.7% Separated8.0% Widowed5.3% DivorcedWomen who gave birth in the past 12 months Now married:
100.0% (42)Unmarried:
0.0% (0)
Women who did not give birth in the past 12 months Now married:
75.7% (523)Unmarried:
24.3% (168)
Marital status - Other race population 15 years and over
Males 31.5% Never married65.1% Now married0.0% Separated3.4% Widowed0.0% DivorcedFemales 39.3% Never married49.8% Now married0.0% Separated3.5% Widowed7.4% DivorcedWomen who did not give birth in the past 12 months Now married:
44.8% (82)Unmarried:
55.2% (102)
Marital status - Two or more races population 15 years and over
Males 39.3% Never married57.4% Now married0.0% Separated0.0% Widowed3.4% DivorcedFemales 45.4% Never married42.4% Now married0.0% Separated10.6% Widowed1.6% DivorcedWomen who did not give birth in the past 12 months Now married:
29.2% (148)Unmarried:
70.8% (359)
Marital status - White alone, not Hispanic / Latino population 15 years and over
Males 25.5% Never married64.5% Now married1.4% Separated2.8% Widowed5.9% DivorcedFemales 21.4% Never married57.6% Now married1.4% Separated8.8% Widowed10.8% DivorcedWomen who gave birth in the past 12 months Now married:
97.4% (247)Unmarried:
2.6% (7)
Women who did not give birth in the past 12 months Now married:
52.9% (2,867)Unmarried:
47.1% (2,557)
Marital status - Hispanic or Latino population 15 years and over
Males 40.2% Never married46.0% Now married0.0% Separated3.3% Widowed10.4% DivorcedFemales 39.7% Never married40.7% Now married3.1% Separated7.1% Widowed9.4% DivorcedWomen who did not give birth in the past 12 months Now married:
32.1% (168)Unmarried:
67.9% (355)
Ancestries in Park Ridge
3,662 21.6% Polish1,949 11.5% Irish1,883 11.1% German1,296 7.7% Italian971 5.7% American511 3.0% Greek468 2.8% Ukrainian430 2.5% English401 2.4% Serbian363 2.1% European219 1.3% Scandinavian155 0.9% Romanian150 0.9% Norwegian128 0.8% Assyrian122 0.7% Croatian112 0.7% Albanian111 0.7% Iranian83 0.5% Macedonian83 0.5% Bulgarian79 0.5% Eastern European74 0.4% Czech70 0.4% Belgian64 0.4% Lithuanian62 0.4% Scottish59 0.3% Swedish52 0.3% African51 0.3% Austrian46 0.3% Russian42 0.2% Iraqi37 0.2% Lebanese36 0.2% Dutch34 0.2% Yugoslavian33 0.2% Egyptian32 0.2% Luxembourger32 0.2% French26 0.2% Slovene22 0.1% Armenian22 0.1% Slovak19 0.1% Syrian17 0.1% Czechoslovakian16 0.09% British16 0.09% Scotch-Irish15 0.09% Finnish13 0.08% Palestinian10 0.06% Brazilian9 0.05% Danish8 0.05% Arab7 0.04% Swiss4 0.02% French Canadian1 0.01% Israeli
Geographical mobility in Park Ridge Same house 1 year ago 26,344 91.5% White (Caucasian)398 95.5% Black or African American29 61.3% American Indian / Alaska Native2,149 84.7% Asian550 85.0% Other race2,897 92.8% Two or more races28,754 91.8% White alone, not Hispanic / Latino2,244 91.5% Hispanic or LatinoMoved within same county 1,548 5.4% White / Caucasian18 4.4% Black or African American21 43.9% American Indian / Alaska Native271 10.7% Asian48 7.4% Other race153 4.9% Two or more races1,663 5.3% White alone, not Hispanic / Latino129 5.3% Hispanic or LatinoMoved within same state 256 0.9% White / Caucasian3 0.7% Black or African American24 0.9% Asian14 2.1% Other race9 0.3% Two or more races269 0.9% White alone, not Hispanic / Latino18 0.7% Hispanic or LatinoMoved from different state 459 1.6% White / Caucasian45 1.8% Asian38 1.2% Two or more races449 1.4% White alone, not Hispanic / Latino27 1.1% Hispanic or LatinoMoved from abroad 59 0.2% White45 1.8% Asian41 6.4% Other race64 0.2% White alone, not Hispanic / Latino48 2.0% Hispanic or Latino
Children Nativity (place of birth) in Park Ridge
Children under 6 years - Living with two parents Both parents native 1,638 100.0% NativeBoth parents foreign-born 243 94.0% Native15 6.0% Foreign-bornOne native, one foreign-born parent 436 100.0% NativeChildren under 6 years - Living with one parent Native parent 199 100.0% NativeForeign-born parent 53 100.0% NativeChildren 6 to 17 years - Living with two parents Both parents native 3,635 100.0% NativeBoth parents foreign-born 486 76.6% Native149 23.4% Foreign-bornOne native, one foreign-born parent 522 100.0% NativeChildren 6 to 17 years - Living with one parent Native parent 901 100.0% NativeForeign-born parent 234 54.2% Native197 45.8% Foreign-born
Grandparents responsible for own grandchildren in Park Ridge
Grandparents (30 to 59 years) White / Caucasian 13 100.0% Responsible for grandchildrenAsian 37 100.0% Not responsible for grandchildrenOther race 41 100.0% Not responsible for grandchildrenWhite alone, not Hispanic / Latino 17 100.0% Responsible for grandchildrenHispanic or Latino 33 100.0% Not responsible for grandchildrenGrandparents (60 years and over) White / Caucasian 17 12.0% Responsible for grandchildren127 88.0% Not responsible for grandchildrenAsian 72 100.0% Not responsible for grandchildrenWhite alone, not Hispanic / Latino 21 13.6% Responsible for grandchildren134 86.4% Not responsible for grandchildrenHispanic or Latino 22 100.0% Not responsible for grandchildren