Owings Mills, MD (Maryland) Houses and Residents
| Owings Mills: | $337,448 |
| Maryland: | $398,100 |
Mean price in 2022:
Detached houses: $411,666
Here: $411,666 State: $526,819 Townhouses or other attached units: $328,550
Here: $328,550 State: $328,305 In 5-or-more-unit structures: $204,113
Here: $204,113 State: $350,378
Total population: 30,622 (Urban population: 20,212, Rural population: 0)
Houses: 15,442 (14,190 occupied: 6,924 owner occupied, 7,582 renter occupied)
| % of renters here: | 52% |
| State: | 32% |
Housing density: 1,606 houses/condos per square mile
Median price asked for vacant for-sale houses and condos in 2022: $160,017.
Median contract rent in 2022: $1,585 (lower quartile is $1,265, upper quartile is $1,900)
Median rent asked for vacant for-rent units in 2022: $1,282
Median gross rent in Owings Mills, MD in 2022: $1,730
Housing units in Owings Mills with a mortgage: 6,016 (545 second mortgage, 24 home equity loan, 412 both second mortgage and home equity loan)
Houses without a mortgage: 81
Median household income for houses/condos with a mortgage: $116,449
Median household income for apartments without a mortgage: $93,207
Median monthly housing costs: $1,718
Compare current foreclosures in Owings Mills, MD:
| Photo | Address | Area | Beds / Baths | Price | Details |
|---|---|---|---|---|---|

|
#1
Wilgate Rd
Owings Mills, MD 21117
|
1,056 sq. feet
|
1 baths 3 beds |
$321,000
|
show details |

|
#2
Willow Branch Way Unit 303
Owings Mills, MD 21117
|
1,200 sq. feet
|
2 baths 2 beds |
$259,000
|
show details |

|
#3
Cypress Grove Ct
Owings Mills, MD 21117
|
1,280 sq. feet
|
4 baths 3 beds |
show details | |

|
#4
Valley Manor Rd Apt 3b
Owings Mills, MD 21117
|
1,346 sq. feet
|
2 baths 2 beds |
show details | |

|
#5
Cedarmere Rd
Owings Mills, MD 21117
|
1,162 sq. feet
|
1 baths 3 beds |
show details | |

|
#6
Doe Meadow Dr
Owings Mills, MD 21117
|
2,155 sq. feet
|
2 baths 4 beds |
show details | |

|
#7
Greenshire Ln
Owings Mills, MD 21117
|
1,572 sq. feet
|
2 baths - beds |
show details | |

|
#8
Oliver Heights Rd
Owings Mills, MD 21117
|
1,536 sq. feet
|
3 baths - beds |
show details | |

|
#9
Town Place Dr
Owings Mills, MD 21117
|
1,200 sq. feet
|
1 baths - beds |
show details | |

|
#10
Town Place Dr
Owings Mills, MD 21117
|
1,200 sq. feet
|
1 baths - beds |
show details |
| Photo | Address | Area | Beds / Baths | Price | Details |
|---|---|---|---|---|---|

|
#11
Windbluff Ct
Owings Mills, MD 21117
|
1,582 sq. feet
|
2 baths - beds |
show details | |

|
#12
Ashforth Way
Owings Mills, MD 21117
|
2,172 sq. feet
|
3 baths - beds |
show details | |

|
#13
Tollgate Rd
Owings Mills, MD 21117
|
2,184 sq. feet
|
2 baths - beds |
show details | |

|
#14
Taiper Ct
Owings Mills, MD 21117
|
1,188 sq. feet
|
2 baths - beds |
show details | |

|
#15
High Rock Way
Owings Mills, MD 21117
|
1,600 sq. feet
|
2 baths - beds |
show details | |

|
#16
Bradbury Rd
Owings Mills, MD 21117
|
1,435 sq. feet
|
1 baths - beds |
show details | |

|
#17
Avatar Ln
Owings Mills, MD 21117
|
1,981 sq. feet
|
2 baths - beds |
show details | |

|
#18
Dark Star Way
Owings Mills, MD 21117
|
2,016 sq. feet
|
2 baths - beds |
show details | |

|
#19
Amber Oaks Way
Owings Mills, MD 21117
|
3,072 sq. feet
|
2 baths - beds |
show details | |

|
#20
Meadow Mills Rd
Owings Mills, MD 21117
|
1,962 sq. feet
|
3 baths - beds |
show details |
| Photo | Address | Area | Beds / Baths | Price | Details |
|---|---|---|---|---|---|

|
#21
Spring Lake Ln
Owings Mills, MD 21117
|
2,366 sq. feet
|
2 baths - beds |
show details | |

|
#22
Arbor Vista Ln
Owings Mills, MD 21117
|
2,000 sq. feet
|
3 baths - beds |
show details | |

|
#23
Kendig Dr
Owings Mills, MD 21117
|
1,545 sq. feet
|
2 baths - beds |
show details | |

|
#24
Ashforth Way
Owings Mills, MD 21117
|
1,838 sq. feet
|
3 baths - beds |
show details | |

|
#25
Wengate Rd
Owings Mills, MD 21117
|
984 sq. feet
|
1 baths - beds |
show details | |

|
#26
S Hampton Ct
Owings Mills, MD 21117
|
2,658 sq. feet
|
2 baths - beds |
show details | |

|
#27
Pleasant Hill Rd
Owings Mills, MD 21117
|
2,048 sq. feet
|
2 baths - beds |
show details | |

|
#28
Wengate Rd
Owings Mills, MD 21117
|
738 sq. feet
|
1 baths - beds |
show details | |

|
#29
Caves Rd
Owings Mills, MD 21117
|
2,664 sq. feet
|
2 baths - beds |
show details | |

|
#30
Hunters Forge Ct
Owings Mills, MD 21117
|
2,416 sq. feet
|
2 baths - beds |
show details |
| Photo | Address | Area | Beds / Baths | Price | Details |
|---|---|---|---|---|---|

|
#31
Sherwood Farm Rd
Owings Mills, MD 21117
|
1,834 sq. feet
|
2 baths - beds |
show details | |

|
#32
Spirit Ln
Owings Mills, MD 21117
|
1,702 sq. feet
|
3 baths - beds |
show details | |

|
#33
Gentlebrook Rd
Owings Mills, MD 21117
|
1,370 sq. feet
|
2 baths - beds |
show details | |

|
#34
Coach House Dr
Owings Mills, MD 21117
|
2,000 sq. feet
|
2 baths - beds |
show details | |

|
#35
Hunting Ridge Dr # A
Owings Mills, MD 21117
|
1,124 sq. feet
|
2 baths - beds |
show details | |

|
#36
Greenway Ln
Owings Mills, MD 21117
|
2,144 sq. feet
|
2 baths - beds |
show details | |

|
#37
Runnymeade Rd
Owings Mills, MD 21117
|
2,250 sq. feet
|
2 baths - beds |
show details | |

|
#38
Bon Haven Ln
Owings Mills, MD 21117
|
1,584 sq. feet
|
2 baths - beds |
show details | |

|
#39
Lyonswood Dr
Owings Mills, MD 21117
|
1,872 sq. feet
|
2 baths - beds |
show details | |

|
#40
Cedarmere Cir
Owings Mills, MD 21117
|
1,996 sq. feet
|
2 baths - beds |
show details |
| Photo | Address | Area | Beds / Baths | Price | Details |
|---|---|---|---|---|---|

|
#41
Greenspring Valley Rd
Owings Mills, MD 21117
|
1,345 sq. feet
|
2 baths - beds |
show details | |

|
#42
Sihler Oaks Trl
Owings Mills, MD 21117
|
2,596 sq. feet
|
3 baths - beds |
show details | |

|
#43
Manor Forge Way
Owings Mills, MD 21117
|
1,600 sq. feet
|
2 baths - beds |
show details | |

|
#44
Tollgate Rd
Owings Mills, MD 21117
|
1,188 sq. feet
|
1 baths - beds |
show details | |

|
#45
Bon Haven Ln
Owings Mills, MD 21117
|
1,540 sq. feet
|
3 baths - beds |
show details | |

|
#46
Royalty 112
Owings Mills, MD 21117
|
1,594 sq. feet
|
2 baths - beds |
show details | |

|
#47
Owings Choice Ct
Owings Mills, MD 21117
|
1,840 sq. feet
|
2 baths - beds |
show details | |

|
#48
High Rock Way
Owings Mills, MD 21117
|
1,600 sq. feet
|
3 baths - beds |
show details | |

|
#49
Wild Branch Ct
Owings Mills, MD 21117
|
1,410 sq. feet
|
1 baths - beds |
show details | |

|
Check over 1 million property listings on Foreclosure.com!
|
browse all offers | |||


 | Homeland Houses For Sale (33 replies) |
| Safety of Metro Train from Owings Mills to Johns Hopkins (14 replies) |
| Ryan Homes being built in Owings Mills (10 replies) |
| Half-Off Houses in Owings Mills?? (28 replies) |
| Accepted job offer in Owings Mills. Where to move? Mid-30s, no kids...yet (21 replies) |
| suggestions regarding apartments (with indian families)and commuting in owing mills (2 replies) |

Median year apartment built: 1995
Household type by relationship:
Households: 34,810- Male householders: 5,728 (1,546 living alone), Female householders: 8,320 (3,469 living alone)
4,978 spouses (4,902 opposite-sex spouses), 1,014 unmarried partners, (964 opposite-sex unmarried partners), 9,273 children (8,797 natural, 191 adopted, 284 stepchildren), 716 grandchildren, 298 brothers or sisters, 768 parents, 0 foster children, 902 other relatives, 1,448 non-relatives
- In group quarters: 1,362
Size of family households: 3,382 2-persons, 2,683 3-persons, 1,136 4-persons, 823 5-persons, 205 6-persons, 78 7-or-more-persons.
Size of nonfamily households: 5,224 1-person, 688 2-persons, 135 3-persons, 30 4-persons, 64 5-persons.
3,407 married couples with children.
2,954 single-parent households (536 men, 2,418 women).
78.5% of residents of Owings Mills speak English at home.
5.8% of residents speak Spanish at home (52% speak English very well, 30% speak English well, 18% speak English not well).
7.1% of residents speak other Indo-European language at home (69% speak English very well, 23% speak English well, 3% speak English not well, 5% don't speak English at all).
2.0% of residents speak Asian or Pacific Island language at home (61% speak English very well, 25% speak English well, 13% speak English not well, 1% don't speak English at all).
5.4% of residents speak other language at home (89% speak English very well, 8% speak English well, 3% speak English not well).
Foreign born population: 7,279 (20.9%)
(54.5% of them are naturalized citizens)
| Here: | 6.5 |
| State: | 7.3 |
| Here: | 4.2 |
| State: | 4.2 |

- Bedrooms in owner-occupied houses and condos in Owings Mills, Maryland
- 0no bedroom
- 1401 bedroom
- 1,5062 bedrooms
- 3,1443 bedrooms
- 1,7184 bedrooms
- 4175+ bedrooms

- Bedrooms in renter-occupied apartments in Owings Mills, Maryland
- 190no bedroom
- 2,0301 bedroom
- 3,3752 bedrooms
- 1,8193 bedrooms
- 1684 bedrooms
- 05+ bedrooms

- Cars and other vehicles available in Owings Mills in owner-occupied houses/condos
- 144no vehicle
- 2,5571 vehicle
- 2,6762 vehicles
- 9353 vehicles
- 5304 vehicles
- 845+ vehicles

- Cars and other vehicles available in Owings Mills in renter-occupied apartments
- 1,051no vehicle
- 4,3311 vehicle
- 1,6572 vehicles
- 4883 vehicles
- 554 vehicles
- 05+ vehicles

- Rooms in owner-occupied houses in Owings Mills, Maryland
- 01 room
- 312 rooms
- 1593 rooms
- 6224 rooms
- 1,2915 rooms
- 1,2976 rooms
- 1,0627 rooms
- 8618 rooms
- 1,6019+ rooms

- Rooms in renter-occupied apartments in Owings Mills, Maryland
- 1901 room
- 3092 rooms
- 1,2963 rooms
- 2,4704 rooms
- 1,4845 rooms
- 9736 rooms
- 3657 rooms
- 1558 rooms
- 3409+ rooms


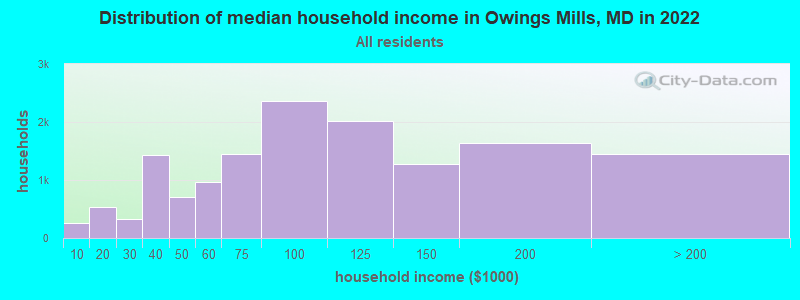
Owings Mills, MD household income distribution

- 258Less than $10,000
- 532$10,000 to $19,999
- 333$20,000 to $29,999
- 1,424$30,000 to $39,999
- 705$40,000 to $49,999
- 971$50,000 to $59,999
- 1,445$60,000 to $74,999
- 2,364$75,000 to $99,999
- 2,021$100,000 to $124,999
- 1,284$125,000 to $149,999
- 1,633$150,000 to $199,999
- 1,456$200,000 or more
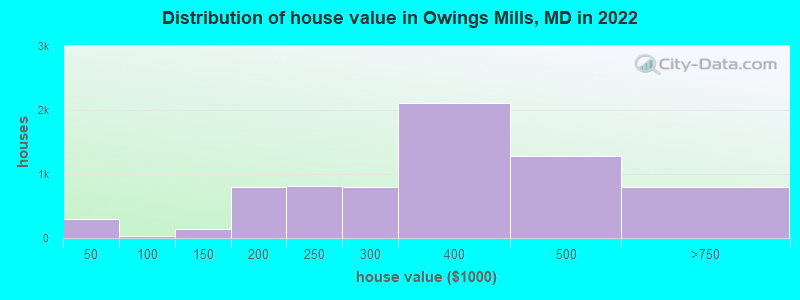
Home value of owner - occupied houses in 2022 in Owings Mills, MD
-
- 141Less than $10,000
- 127$30,000 to $34,999
- 33$40,000 to $49,999
- 13$100,000 to $124,999
- 123$125,000 to $149,999
- 331$150,000 to $174,999
- 467$175,000 to $199,999
- 814$200,000 to $249,999
- 798$250,000 to $299,999
- 2,115$300,000 to $399,999
- 1,280$400,000 to $499,999
- 779$500,000 to $749,999
- 20$1,500,000 to $1,999,999
Rent paid by renters in 2022 in Owings Mills, MD
-
- 48$150 to $199
- 118$200 to $249
- 16$350 to $399
- 12$400 to $449
- 70$500 to $549
- 46$600 to $649
- 32$750 to $799
- 67$900 to $999
- 880$1,000 to $1,249
- 1,755$1,250 to $1,499
- 2,662$1,500 to $1,999
- 1,095$2,000 to $2,499
- 101$2,500 to $2,999
- 224No cash rent


Percentage of workers working in this county: 54.9%
Number of people working at home: 3,761 (19.2% of all workers)
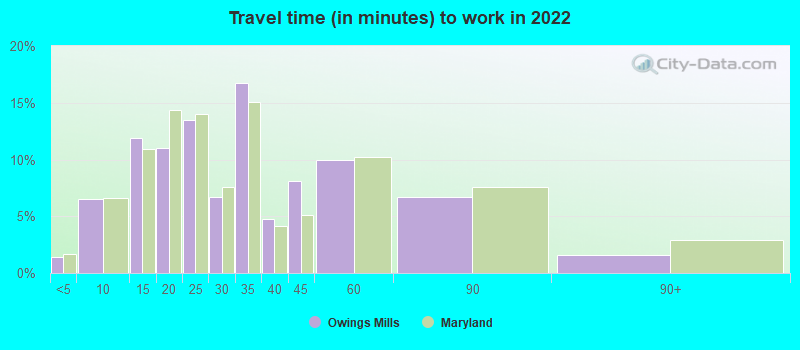
Travel time to work (commute)
- Less than 5 minutes: 373
- 5 to 9 minutes: 1,174
- 10 to 14 minutes: 1,559
- 15 to 19 minutes: 1,149
- 20 to 24 minutes: 1,905
- 25 to 29 minutes: 1,775
- 30 to 34 minutes: 2,594
- 35 to 39 minutes: 805
- 40 to 44 minutes: 1,030
- 45 to 59 minutes: 1,308
- 60 to 89 minutes: 1,177
- 90 or more minutes: 879
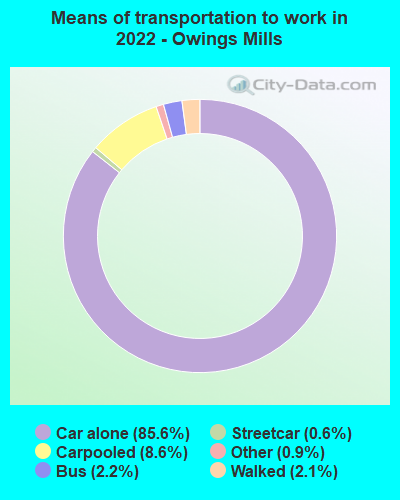
Means of transportation to work:
- Drove a car alone: 15,727 (70.2%)
- Carpooled: 1,803 (8.0%)
- Bus: 247 (1.1%)
- Subway or elevated rail: 119 (0.5%)
- Taxi: 190 (0.8%)
- Walked: 439 (2.0%)
- Worked at home: 3,761 (16.8%)

- Unemployment by race in 2022
- Unemployment rate for White non-Hispanic residents
- 4.6%Males
- 4.9%Females
- Unemployment rate for Black residents
- 3.4%Males
- 5.5%Females
- Unemployment rate for Asian residents
- 3.6%Males
- Unemployment rate for two or more race residents
- 0.2%Males
- 6.9%Females
- Unemployment rate for Hispanic or Latino residents
- 5.0%Males
- 2.3%Females

- Year of entry for the foreign-born population in Owings Mills, Maryland
- 3,3002010 or later
- 1,5572000 to 2009
- 1,5061990 to 1999
- 5721980 to 1989
- 1861970 to 1979
- 213Before 1970
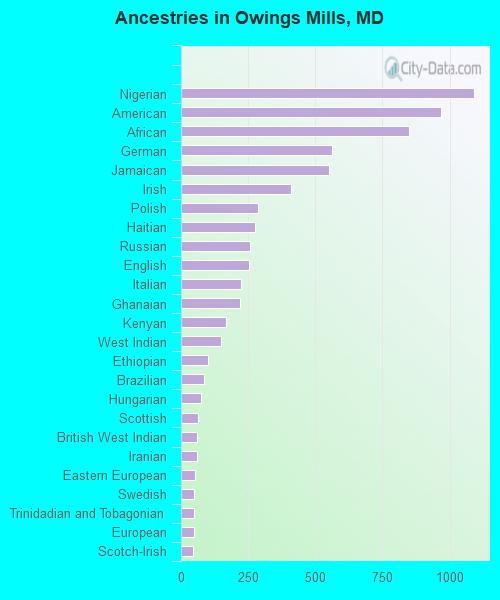
First ancestries reported:
- Nigerian: 1,092 (5.1%)
- American: 967 (4.5%)
- African: 847 (3.9%)
- German: 561 (2.6%)
- Jamaican: 551 (2.6%)
- Irish: 411 (1.9%)
- Polish: 288 (1.3%)
- Haitian: 275 (1.3%)
- Russian: 257 (1.2%)
- English: 254 (1.2%)
- Italian: 223 (1.0%)
- Ghanaian: 219 (1.0%)
- Kenyan: 169 (0.8%)
- West Indian: 150 (0.7%)
- Ethiopian: 99 (0.5%)
- Brazilian: 86 (0.4%)
- Hungarian: 74 (0.3%)
- Scottish: 62 (0.3%)
- British West Indian: 61 (0.3%)
- Iranian: 60 (0.3%)
- Eastern European: 53 (0.2%)
- Swedish: 49 (0.2%)
- Trinidadian and Tobagonian: 49 (0.2%)
- European: 48 (0.2%)
- Scotch-Irish: 44 (0.2%)
- Danish: 41 (0.2%)
- Turkish: 39 (0.2%)
- Sierra Leonean: 32 (0.1%)
- Guyanese: 32 (0.1%)
- Scandinavian: 28 (0.1%)
- Norwegian: 25 (0.1%)
- Ukrainian: 23 (0.1%)
- Jordanian: 20 (0.09%)
- Barbadian: 20 (0.09%)
- French: 19 (0.09%)
- Canadian: 17 (0.08%)
- Israeli: 13 (0.06%)
- Lithuanian: 3 (0.01%)
- Liberian: 2 (0.01%)
- Austrian: 2 (0.01%)
Most common places of birth for foreign-born residents (%):
| Owings Mills: | 16.3% (1,197) |
| Maryland: | 4.6% (44,825) |
| Owings Mills: | 12.2% (896) |
| Maryland: | 6.4% (61,725) |
| Owings Mills: | 10.1% (741) |
| Maryland: | 2.5% (24,026) |
| Owings Mills: | 7.0% (513) |
| Maryland: | 2.5% (23,969) |
| Owings Mills: | 6.6% (487) |
| Maryland: | 2.8% (27,444) |
| Owings Mills: | 5.3% (387) |
| Maryland: | 1.1% (10,205) |
| Owings Mills: | 4.2% (305) |
| Maryland: | 1.8% (17,774) |
| Owings Mills: | 3.8% (282) |
| Maryland: | 1.0% (9,481) |
| Owings Mills: | 3.2% (236) |
| Maryland: | 3.2% (30,870) |
| Owings Mills: | 2.9% (210) |
| Maryland: | 0.1% (1,254) |
| Owings Mills: | 2.9% (209) |
| Maryland: | 3.4% (32,635) |
| Owings Mills: | 2.7% (201) |
| Maryland: | 3.5% (34,065) |
| Owings Mills: | 2.4% (173) |
| Maryland: | 3.8% (36,698) |
| Owings Mills: | 1.9% (142) |
| Maryland: | 0.8% (7,497) |
| Owings Mills: | 1.9% (140) |
| Maryland: | 4.4% (42,350) |
| Owings Mills: | 1.9% (137) |
| Maryland: | 1.8% (17,161) |
Place of birth for U.S.-born residents:
- This state: 19,996
- Other state: 7,300
- Northeast: 3,212
- Midwest: 1,077
- South: 2,594
- West: 428
86.0% of Owings Mills residents lived in the same house 1 years ago.
Out of people who lived in different houses, 38.3% lived in this county.
Out of people who lived in different counties, 72.8% lived in Maryland.
| Owings Mills: | 86.0% |
| State average: | 88.5% |
Education attainment for males 25 years and older:
- No schooling: 218
- Nursery to 4th grade: 0
- 5th and 6th grade: 12
- 7th and 8th grade: 20
- 9th grade: 181
- 10th grade: 14
- 11th grade: 24
- 12th grade, no diploma: 89
- High school graduate (or equivalency): 1,652
- Less than 1 year of college: 791
- Some college more than 1 year, no degree: 1,216
- Associate degree: 673
- Bachelor's degree: 2,889
- Master's degree: 1,584
- Professional school degree: 131
- Doctorate degree: 146

Education attainment for females 25 years and older:
- No schooling: 231
- Nursery to 4th grade: 0
- 5th and 6th grade: 230
- 7th and 8th grade: 49
- 9th grade: 42
- 10th grade: 25
- 11th grade: 169
- 12th grade, no diploma: 287
- High school graduate (or equivalency): 2,817
- Less than 1 year of college: 523
- Some college more than 1 year, no degree: 1,992
- Associate degree: 1,130
- Bachelor's degree: 3,060
- Master's degree: 3,279
- Professional school degree: 226
- Doctorate degree: 177


Housing units in structures:
- One, detached: 3,353
- One, attached: 3,449
- Two: 32
- 3 or 4: 206
- 5 to 9: 1,587
- 10 to 19: 4,334
- 20 to 49: 1,142
- 50 or more: 1,336
Housing units lacking complete kitchen facilities in 2022: 1.3%
House/condo owner moved in on average 11 years ago
Renter moved in on average 3 years ago

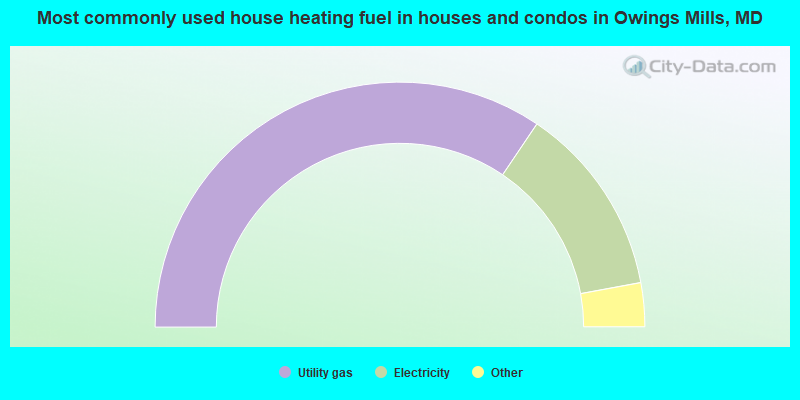
- 68.9%Utility gas
- 25.3%Electricity
- 2.6%Fuel oil, kerosene, etc.
- 2.2%Bottled, tank, or LP gas
- 0.6%Wood
- 0.4%No fuel used
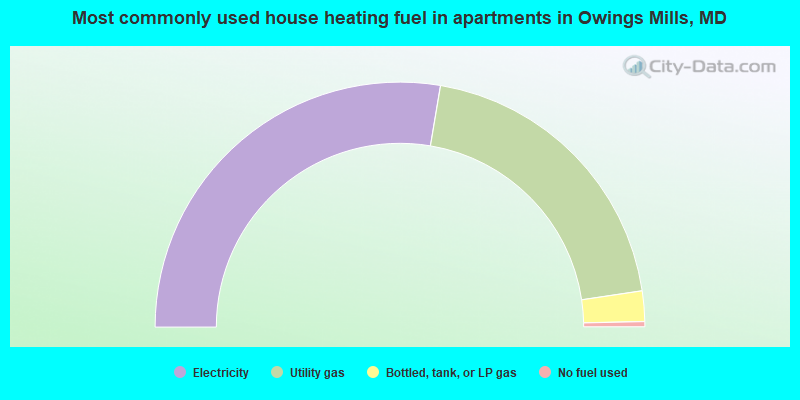
- 55.3%Electricity
- 40.0%Utility gas
- 4.0%Bottled, tank, or LP gas
- 0.7%No fuel used
Private vs. public school enrollment:
| Here: | 8.2% |
| Maryland: | 15.2% |
| Here: | 13.3% |
| Maryland: | 14.4% |
| Here: | 32.4% |
| Maryland: | 20.2% |


