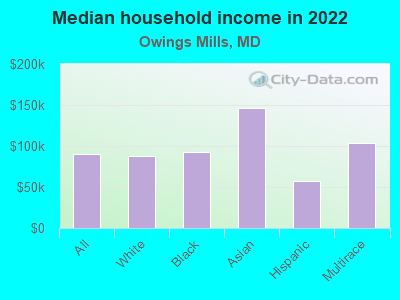
The median household income in Owings Mills, MD in 2022 was $90,613, which was 4.8% less than the median annual income of $94,991 across the entire state of Maryland. Compared to the median income of $53,424 in 2000 this represents an increase of 41.0%. The per capita income in 2022 was $44,875, which means an increase of 39.6% compared to 2000 when it was $27,107.
Whole page based on the data from 2000 / 2022 when the population of Owings Mills, Maryland was 20,193 / 34,811
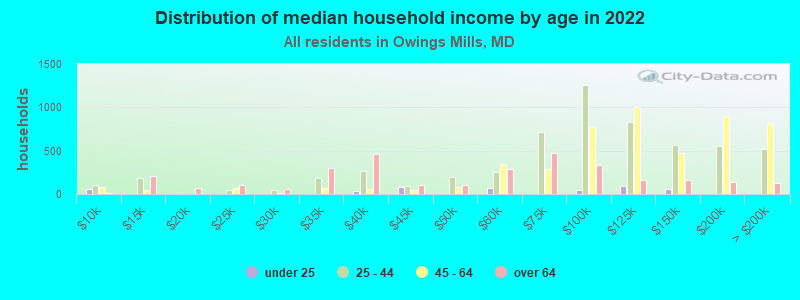
Income statistics for all residents
Median household income in Owings Mills, MD in 2022:
Owings Mills:
$90,614
Maryland:
$94,991
Change in median household income between 2000 and 2022:
Owings Mills, Maryland:
+69.6%
State:
+79.7%
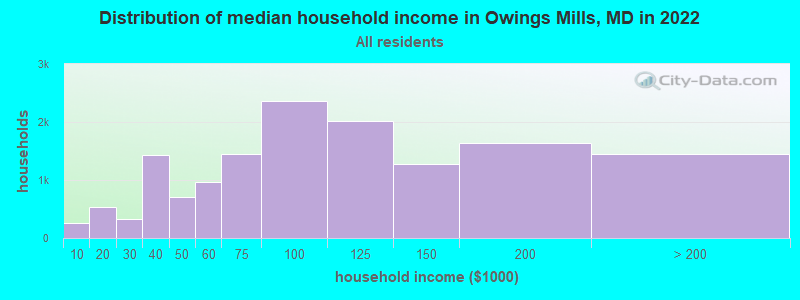
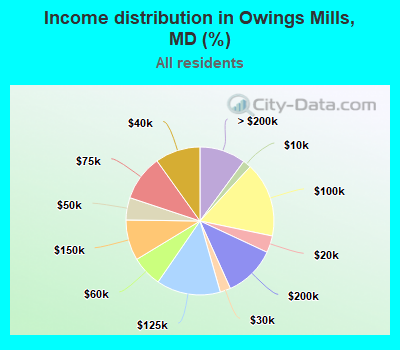
Number of households with income < $10k:
Owings Mills:
1.8% (258)
Maryland:
4.8% (114,450)
Number of households with income $10k - 20k:
Owings Mills:
3.7% (532)
Maryland:
5.0% (117,883)
Number of households with income $20k - 30k:
Owings Mills:
2.3% (333)
Maryland:
5.2% (123,350)
Number of households with income $30k - 40k:
Owings Mills:
9.9% (1,424)
State:
5.6% (134,104)
Number of households with income $40k - 50k:
Owings Mills:
4.9% (705)
State:
5.6% (132,932)
Number of households with income $50k - 60k:
Owings Mills:
6.7% (971)
State:
5.6% (132,707)
Number of households with income $60k - 75k:
Owings Mills:
10.0% (1,445)
State:
7.9% (188,335)
Number of households with income $75k - 100k:
Owings Mills:
16.4% (2,364)
State:
12.5% (297,873)
Number of households with income $100k - 125k:
Owings Mills:
14.0% (2,021)
State:
10.5% (250,497)
Number of households with income $125k - 150k:
Owings Mills:
8.9% (1,284)
State:
8.1% (193,208)
Number of households with income $150k - 200k:
Owings Mills:
11.3% (1,633)
State:
11.6% (274,905)
Number of households with income > $200k:
Owings Mills:
10.1% (1,456)
State:
17.5% (415,740)
Aggregate household income in Owings Mills in 2022: $1,557,610,358
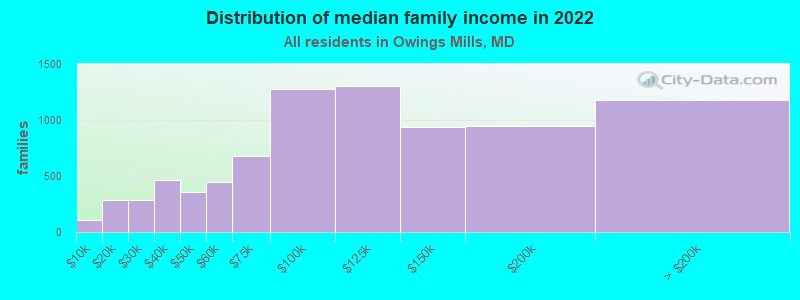
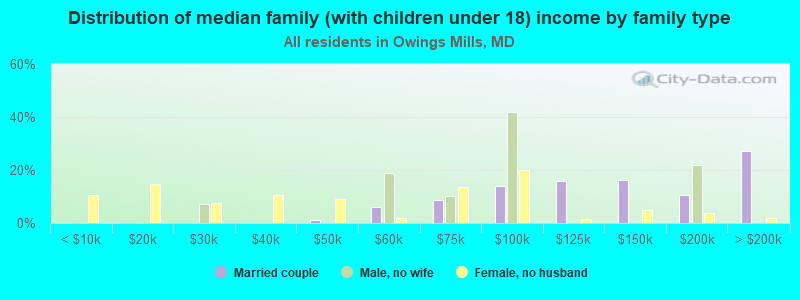
Median family income in Owings Mills in 2022:
Owings Mills:
$105,028
Maryland:
$117,294
Number of families with income < $10k:
Owings Mills:
1.3% (109)
Maryland:
2.7% (41,433)
Number of families with income $10k - 20k:
Owings Mills:
3.5% (287)
State:
2.6% (40,126)
Number of families with income $20k - 30k:
Owings Mills:
3.5% (286)
Maryland:
3.4% (52,891)
Number of families with income $30k - 40k:
Owings Mills:
5.6% (464)
State:
4.5% (70,252)
Number of families with income $40k - 50k:
Owings Mills:
4.3% (353)
Maryland:
4.8% (74,112)
Number of families with income $50k - 60k:
Owings Mills:
5.4% (449)
Maryland:
5.0% (77,590)
Number of families with income $60k - 75k:
Owings Mills:
8.2% (682)
State:
7.1% (109,924)
Number of families with income $75k - 100k:
Owings Mills:
15.4% (1,278)
State:
12.0% (185,255)
Number of families with income $100k - 125k:
Owings Mills:
15.8% (1,306)
State:
11.2% (173,203)
Number of families with income $125k - 150k:
Owings Mills:
11.3% (937)
Maryland:
9.3% (143,453)
Number of families with income $150k - 200k:
Owings Mills:
11.5% (950)
Maryland:
14.2% (218,861)
Number of families with income > $200k:
Owings Mills:
14.3% (1,182)
State:
23.2% (359,182)
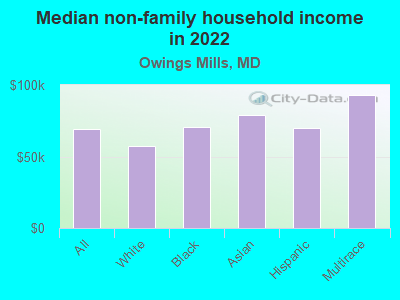
Median non-family income in Owings Mills in 2022:
Owings Mills:
$69,542
State:
$57,179
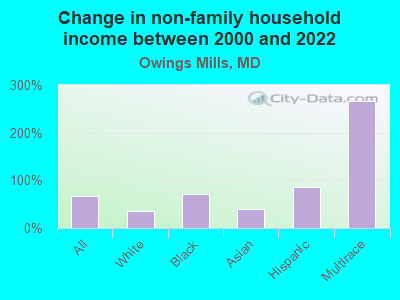
Change in median non-family income between 2000 and 2022:
Owings Mills, Maryland:
+67.1%
State:
+75.1%
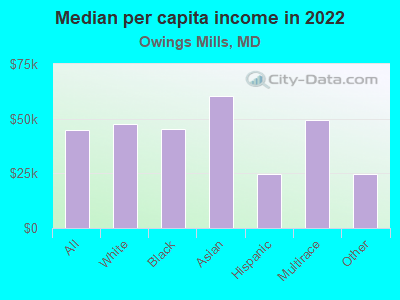
Median per capita income in Owings Mills in 2022:
Owings Mills:
$44,876
State:
$49,236
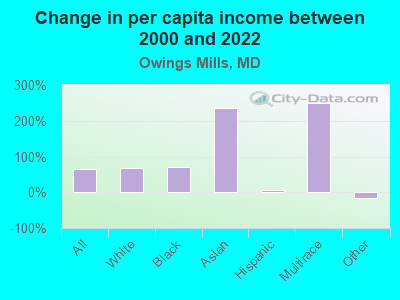
Change in median per capita income between 2000 and 2022:
Owings Mills, Maryland:
+65.5%
State:
+92.2%
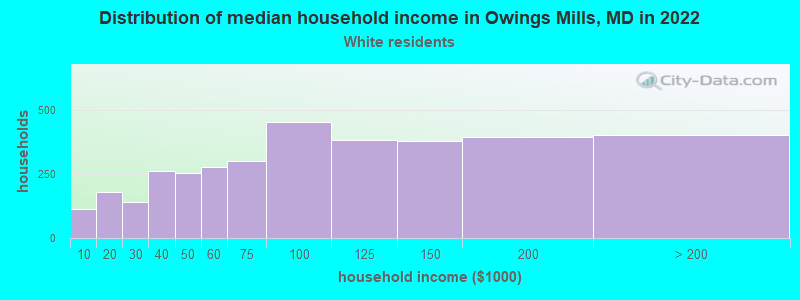
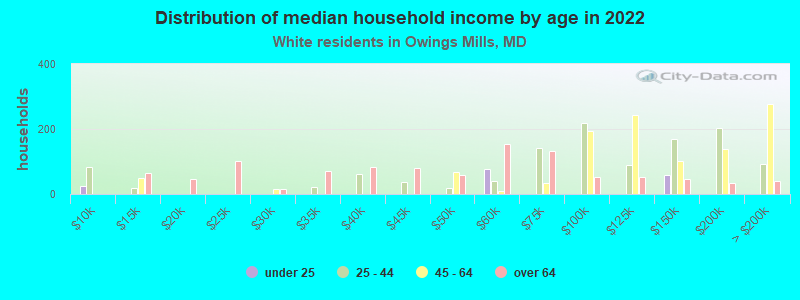
Income statistics for White residents
Median household income in Owings Mills, MD in 2022:
Owings Mills:
$87,913
Maryland:
$107,160
Change in median household income between 2000 and 2022:
Owings Mills, Maryland:
+66.3%
Maryland:
+85.3%
Number of households with income < $10k:
Owings Mills:
3.2% (112)
State:
3.7% (47,387)
Number of households with income $10k - 20k:
Owings Mills:
5.1% (179)
State:
4.1% (52,102)
Number of households with income $20k - 30k:
Owings Mills:
4.0% (140)
State:
4.6% (58,758)
Number of households with income $30k - 40k:
Owings Mills:
7.4% (263)
Maryland:
4.7% (59,745)
Number of households with income $40k - 50k:
Owings Mills:
7.1% (252)
State:
5.0% (62,576)
Number of households with income $50k - 60k:
Owings Mills:
7.9% (279)
State:
5.1% (64,484)
Number of households with income $60k - 75k:
Owings Mills:
8.5% (300)
State:
7.7% (97,019)
Number of households with income $75k - 100k:
Owings Mills:
12.8% (453)
State:
11.8% (149,205)
Number of households with income $100k - 125k:
Owings Mills:
10.8% (381)
State:
10.6% (134,231)
Number of households with income $125k - 150k:
Owings Mills:
10.7% (379)
State:
8.8% (111,081)
Number of households with income $150k - 200k:
Owings Mills:
11.1% (394)
State:
12.9% (162,966)
Number of households with income > $200k:
Owings Mills:
11.4% (404)
State:
20.9% (264,377)
Aggregate household income in Owings Mills in 2022: $364,595,105
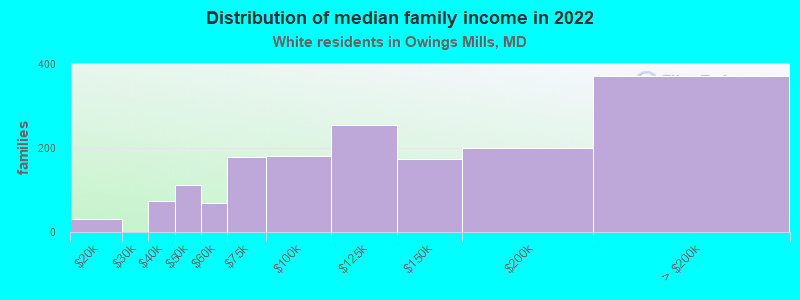
Median family income in Owings Mills in 2022:
Owings Mills:
$114,647
State:
$134,708
Number of families with income $10k - 20k:
Owings Mills:
1.8% (30)
State:
2.0% (16,048)
Number of families with income $30k - 40k:
Owings Mills:
4.4% (73)
State:
3.3% (26,886)
Number of families with income $40k - 50k:
Owings Mills:
6.8% (112)
Maryland:
3.6% (29,194)
Number of families with income $50k - 60k:
Owings Mills:
4.3% (70)
State:
4.1% (33,120)
Number of families with income $60k - 75k:
Owings Mills:
10.8% (178)
State:
6.6% (53,501)
Number of families with income $75k - 100k:
Owings Mills:
11.1% (182)
State:
11.3% (91,779)
Number of families with income $100k - 125k:
Owings Mills:
15.5% (254)
State:
11.3% (91,483)
Number of families with income $125k - 150k:
Owings Mills:
10.6% (175)
Maryland:
9.9% (80,832)
Number of families with income $150k - 200k:
Owings Mills:
12.1% (200)
State:
16.0% (130,295)
Number of families with income > $200k:
Owings Mills:
22.5% (371)
State:
28.1% (228,324)
Median non-family income in Owings Mills in 2022:
Owings Mills:
$57,429
State:
$61,991
Change in median non-family income between 2000 and 2022:
Owings Mills, Maryland:
+36.2%
State:
+76.8%
Median per capita income in Owings Mills in 2022:
Owings Mills:
$47,720
Maryland:
$59,750
Change in median per capita income between 2000 and 2022:
Owings Mills, Maryland:
+67.8%
State:
+104.5%
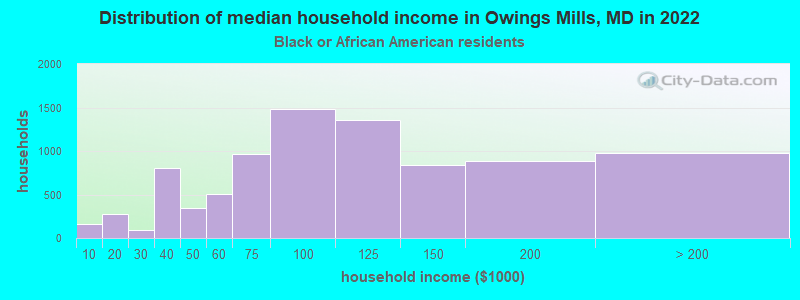
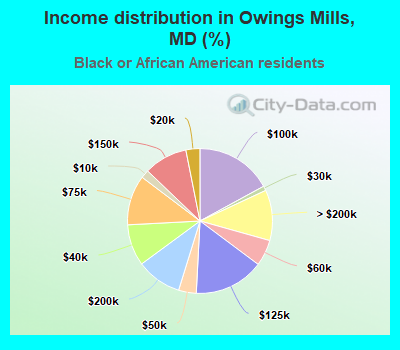
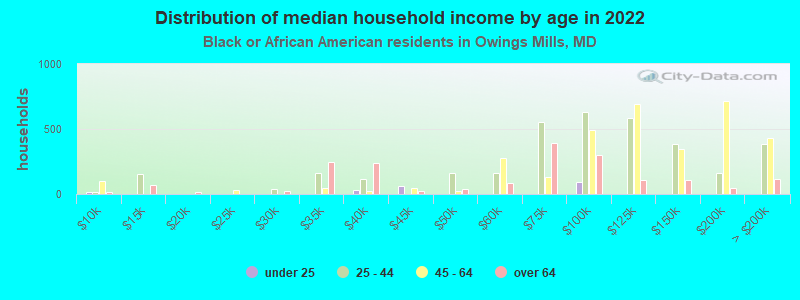
Income statistics for Black or African American residents
Median household income in Owings Mills, MD in 2022:
Owings Mills:
$92,749
State:
$77,368
Change in median household income between 2000 and 2022:
Owings Mills, Maryland:
+64.6%
State:
+85.7%
Number of households with income < $10k:
Owings Mills:
1.9% (161)
State:
7.0% (50,093)
Number of households with income $10k - 20k:
Owings Mills:
3.1% (272)
Maryland:
7.2% (51,849)
Number of households with income $20k - 30k:
Owings Mills:
1.0% (88)
Maryland:
5.8% (41,510)
Number of households with income $30k - 40k:
Owings Mills:
9.2% (803)
State:
6.9% (49,466)
Number of households with income $40k - 50k:
Owings Mills:
4.0% (344)
Maryland:
6.6% (47,557)
Number of households with income $50k - 60k:
Owings Mills:
5.9% (509)
Maryland:
6.2% (44,818)
Number of households with income $60k - 75k:
Owings Mills:
11.1% (968)
State:
8.6% (61,728)
Number of households with income $75k - 100k:
Owings Mills:
17.1% (1,482)
Maryland:
13.2% (95,107)
Number of households with income $100k - 125k:
Owings Mills:
15.6% (1,356)
Maryland:
10.2% (73,579)
Number of households with income $125k - 150k:
Owings Mills:
9.7% (844)
State:
7.2% (51,970)
Number of households with income $150k - 200k:
Owings Mills:
10.1% (880)
State:
9.4% (67,623)
Number of households with income > $200k:
Owings Mills:
11.3% (980)
State:
11.7% (83,862)
Aggregate household income in Owings Mills in 2022: $975,945,116
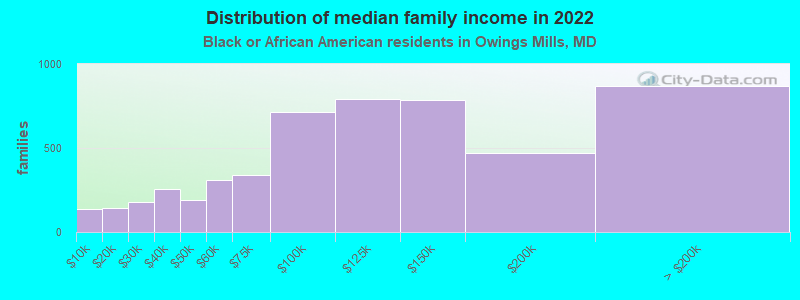
Median family income in Owings Mills in 2022:
Owings Mills:
$106,613
Maryland:
$96,241
Number of families with income < $10k:
Owings Mills:
2.6% (134)
Maryland:
4.5% (19,574)
Number of families with income $10k - 20k:
Owings Mills:
2.7% (141)
State:
3.8% (16,604)
Number of families with income $20k - 30k:
Owings Mills:
3.4% (177)
State:
4.3% (18,629)
Number of families with income $30k - 40k:
Owings Mills:
4.9% (254)
State:
6.1% (26,770)
Number of families with income $40k - 50k:
Owings Mills:
3.7% (192)
Maryland:
6.2% (27,138)
Number of families with income $50k - 60k:
Owings Mills:
6.0% (310)
State:
5.9% (25,636)
Number of families with income $60k - 75k:
Owings Mills:
6.5% (337)
Maryland:
8.0% (35,163)
Number of families with income $75k - 100k:
Owings Mills:
13.7% (712)
State:
12.8% (55,976)
Number of families with income $100k - 125k:
Owings Mills:
15.3% (794)
State:
11.4% (49,778)
Number of families with income $125k - 150k:
Owings Mills:
15.2% (785)
State:
8.8% (38,547)
Number of families with income $150k - 200k:
Owings Mills:
9.1% (472)
State:
11.8% (51,381)
Number of families with income > $200k:
Owings Mills:
16.8% (872)
State:
16.5% (71,997)
Median non-family income in Owings Mills in 2022:
Owings Mills:
$70,464
Maryland:
$49,944
Change in median non-family income between 2000 and 2022:
Owings Mills, Maryland:
+72.1%
State:
+71.8%
Median per capita income in Owings Mills in 2022:
Owings Mills:
$45,463
State:
$40,756
Change in median per capita income between 2000 and 2022:
Owings Mills, Maryland:
+70.2%
State:
+113.5%
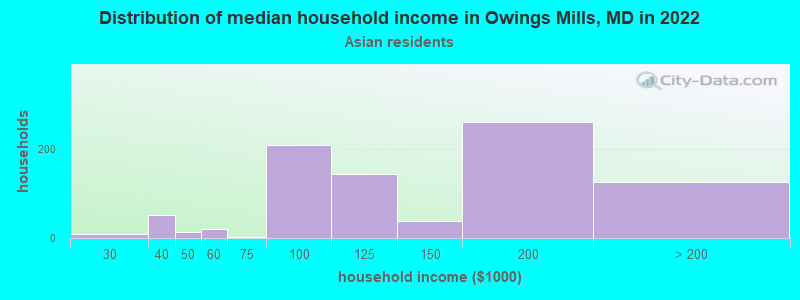
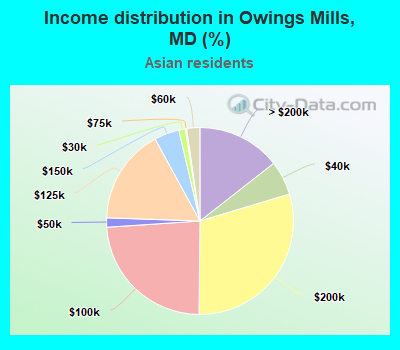
Income statistics for Asian residents
Median household income in Owings Mills, MD in 2022:
Owings Mills:
$146,282
Maryland:
$117,771
Number of households with income < $10k:
Owings Mills:
0.0% (0)
Maryland:
4.6% (6,395)
Number of households with income $10k - 20k:
Owings Mills:
0.0% (0)
Maryland:
3.6% (4,994)
Number of households with income $20k - 30k:
Owings Mills:
1.1% (10)
State:
4.6% (6,399)
Number of households with income $30k - 40k:
Owings Mills:
5.9% (52)
Maryland:
3.4% (4,682)
Number of households with income $40k - 50k:
Owings Mills:
1.6% (14)
State:
4.6% (6,382)
Number of households with income $50k - 60k:
Owings Mills:
2.3% (20)
State:
4.6% (6,402)
Number of households with income $60k - 75k:
Owings Mills:
0.2% (2)
State:
5.4% (7,426)
Number of households with income $75k - 100k:
Owings Mills:
23.8% (209)
State:
11.1% (15,313)
Number of households with income $100k - 125k:
Owings Mills:
16.5% (145)
Maryland:
10.6% (14,640)
Number of households with income $125k - 150k:
Owings Mills:
4.3% (38)
Maryland:
8.3% (11,465)
Number of households with income $150k - 200k:
Owings Mills:
29.8% (262)
State:
13.4% (18,490)
Number of households with income > $200k:
Owings Mills:
14.4% (127)
State:
25.6% (35,377)
Aggregate household income in Owings Mills in 2022: $122,283,551
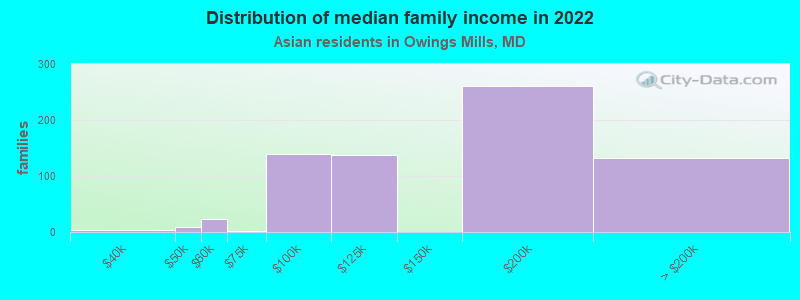
Median family income in Owings Mills in 2022:
Owings Mills:
$154,073
State:
$137,857
Number of families with income $30k - 40k:
Owings Mills:
0.6% (4)
Maryland:
2.4% (2,563)
Number of families with income $40k - 50k:
Owings Mills:
1.2% (9)
State:
4.1% (4,351)
Number of families with income $50k - 60k:
Owings Mills:
3.2% (23)
State:
4.4% (4,709)
Number of families with income $60k - 75k:
Owings Mills:
0.2% (2)
State:
4.5% (4,749)
Number of families with income $75k - 100k:
Owings Mills:
19.6% (139)
Maryland:
10.9% (11,658)
Number of families with income $100k - 125k:
Owings Mills:
19.6% (138)
Maryland:
10.6% (11,243)
Number of families with income $150k - 200k:
Owings Mills:
36.8% (260)
State:
15.2% (16,182)
Number of families with income > $200k:
Owings Mills:
18.6% (132)
State:
30.3% (32,297)
Median non-family income in Owings Mills in 2022:
Owings Mills:
$78,936
State:
$62,510
Change in median non-family income between 2000 and 2022:
Owings Mills, Maryland:
+39.6%
State:
+83.8%
Median per capita income in Owings Mills in 2022:
Owings Mills:
$60,539
Maryland:
$53,546
Income statistics for Hispanic or Latino residents
Median household income in Owings Mills, MD in 2022:
Owings Mills:
$57,552
Maryland:
$82,138
Change in median household income between 2000 and 2022:
Owings Mills, Maryland:
+33.4%
State:
+70.2%
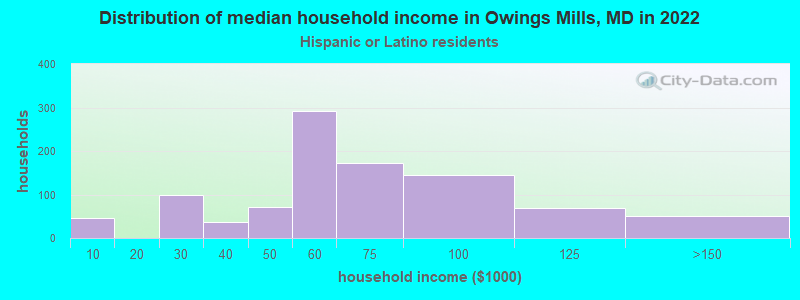
Number of households with income < $10k:
Owings Mills:
4.7% (46)
Maryland:
3.7% (6,871)
Number of households with income $10k - 20k:
Owings Mills:
0.0% (0)
State:
2.9% (5,465)
Number of households with income $20k - 30k:
Owings Mills:
10.0% (98)
Maryland:
5.9% (11,012)
Number of households with income $30k - 40k:
Owings Mills:
3.7% (36)
State:
7.9% (14,668)
Number of households with income $40k - 50k:
Owings Mills:
7.2% (71)
Maryland:
7.6% (14,074)
Number of households with income $50k - 60k:
Owings Mills:
29.8% (292)
Maryland:
7.6% (14,166)
Number of households with income $60k - 75k:
Owings Mills:
17.6% (172)
Maryland:
9.9% (18,486)
Number of households with income $75k - 100k:
Owings Mills:
14.8% (145)
State:
16.1% (30,032)
Number of households with income $100k - 125k:
Owings Mills:
7.0% (69)
State:
9.4% (17,432)
Number of households with income $125k - 150k:
Owings Mills:
5.2% (51)
State:
7.5% (13,963)
Number of households with income $150k - 200k:
Owings Mills:
0.0% (0)
Maryland:
10.1% (18,750)
Number of households with income > $200k:
Owings Mills:
0.0% (0)
State:
11.4% (21,133)
Aggregate household income in Owings Mills in 2022: $63,012,939
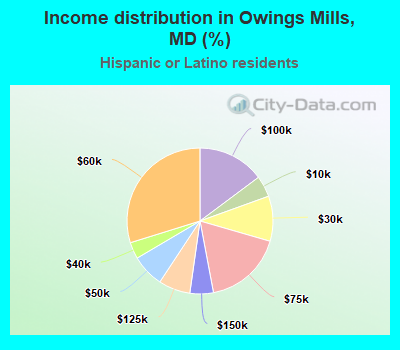
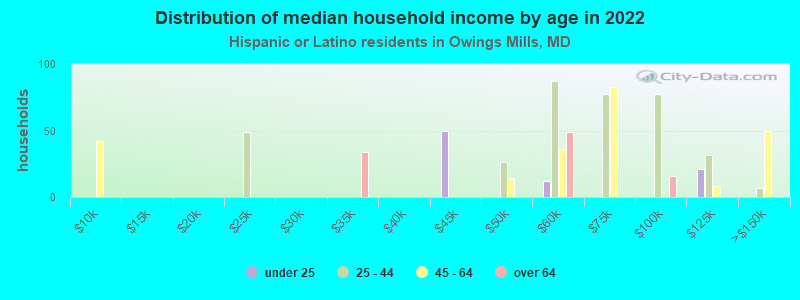
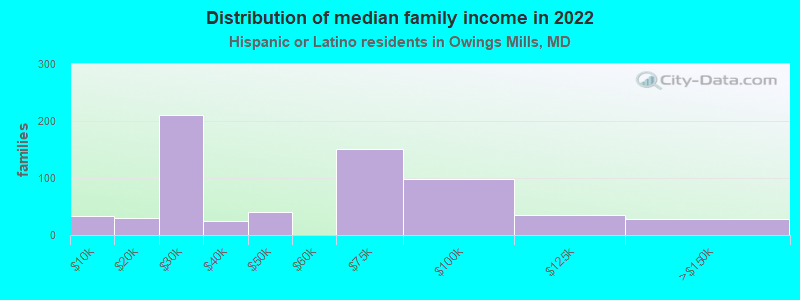
Median family income in Owings Mills in 2022:
Owings Mills:
$57,199
State:
$80,127
Number of families with income < $10k:
Owings Mills:
5.2% (34)
Maryland:
3.1% (4,499)
Number of families with income $10k - 20k:
Owings Mills:
4.6% (30)
Maryland:
2.2% (3,250)
Number of families with income $20k - 30k:
Owings Mills:
32.1% (210)
State:
6.8% (10,000)
Number of families with income $30k - 40k:
Owings Mills:
3.7% (24)
Maryland:
7.6% (11,123)
Number of families with income $40k - 50k:
Owings Mills:
6.3% (41)
State:
8.1% (11,900)
Number of families with income $60k - 75k:
Owings Mills:
23.2% (151)
State:
10.2% (15,051)
Number of families with income $75k - 100k:
Owings Mills:
15.1% (99)
Maryland:
14.6% (21,440)
Number of families with income $100k - 125k:
Owings Mills:
5.3% (35)
State:
9.6% (14,146)
Number of families with income $125k - 150k:
Owings Mills:
4.3% (28)
State:
6.9% (10,202)
Median non-family income in Owings Mills in 2022:
Owings Mills:
$69,719
State:
$55,347
Change in median non-family income between 2000 and 2022:
Owings Mills, Maryland:
+85.9%
Maryland:
+61.9%
Median per capita income in Owings Mills in 2022:
Owings Mills:
$24,783
Maryland:
$29,024
Change in median per capita income between 2000 and 2022:
Owings Mills, Maryland:
+6.2%
Maryland:
+79.2%
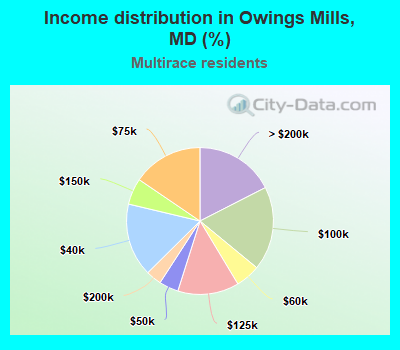
Income statistics for Multirace residents
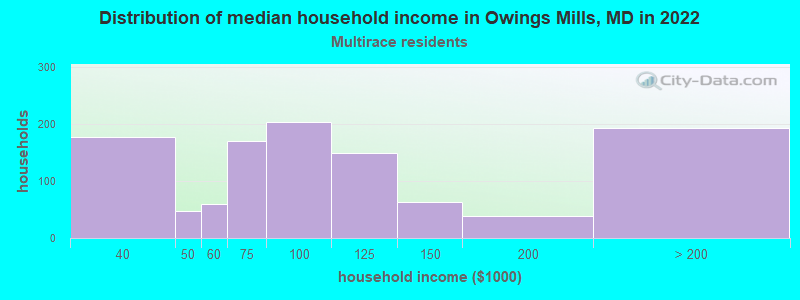
Median household income in Owings Mills, MD in 2022:
Owings Mills:
$104,249
Maryland:
$99,027
Number of households with income < $10k:
Owings Mills:
0.0% (0)
State:
4.8% (6,469)
Number of households with income $10k - 20k:
Owings Mills:
0.0% (0)
State:
3.3% (4,464)
Number of households with income $20k - 30k:
Owings Mills:
0.0% (0)
Maryland:
5.8% (7,826)
Number of households with income $30k - 40k:
Owings Mills:
16.1% (178)
Maryland:
8.1% (11,077)
Number of households with income $40k - 50k:
Owings Mills:
4.3% (47)
State:
4.3% (5,895)
Number of households with income $50k - 60k:
Owings Mills:
5.4% (60)
State:
3.9% (5,346)
Number of households with income $60k - 75k:
Owings Mills:
15.5% (171)
State:
6.7% (9,159)
Number of households with income $75k - 100k:
Owings Mills:
18.5% (204)
State:
13.6% (18,420)
Number of households with income $100k - 125k:
Owings Mills:
13.5% (149)
State:
12.9% (17,488)
Number of households with income $125k - 150k:
Owings Mills:
5.8% (64)
Maryland:
8.1% (11,039)
Number of households with income $150k - 200k:
Owings Mills:
3.4% (38)
Maryland:
11.5% (15,675)
Number of households with income > $200k:
Owings Mills:
17.5% (193)
Maryland:
17.0% (23,059)
Aggregate household income in Owings Mills in 2022: $137,941,661
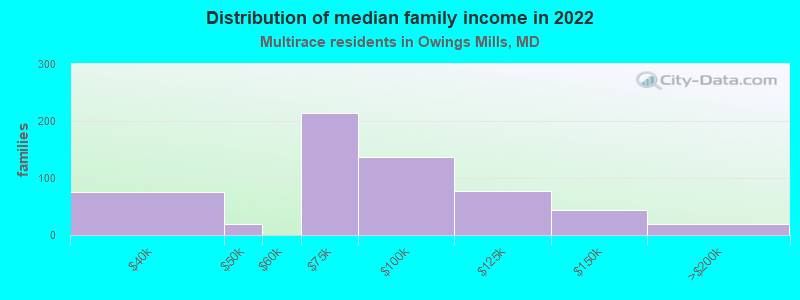
Median family income in Owings Mills in 2022:
Owings Mills:
$96,955
State:
$110,784
Number of families with income $30k - 40k:
Owings Mills:
12.7% (75)
State:
7.8% (7,382)
Number of families with income $40k - 50k:
Owings Mills:
3.3% (20)
State:
3.6% (3,426)
Number of families with income $60k - 75k:
Owings Mills:
36.6% (214)
State:
6.5% (6,128)
Number of families with income $75k - 100k:
Owings Mills:
23.3% (137)
State:
11.7% (11,110)
Number of families with income $100k - 125k:
Owings Mills:
13.2% (77)
State:
13.2% (12,548)
Number of families with income $125k - 150k:
Owings Mills:
7.4% (43)
Maryland:
9.0% (8,509)
Number of families with income $150k - 200k:
Owings Mills:
3.4% (20)
State:
13.6% (12,921)
Median non-family income in Owings Mills in 2022:
Owings Mills:
$93,300
Maryland:
$60,702
Median per capita income in Owings Mills in 2022:
Owings Mills:
$49,286
State:
$35,630
Income statistics for other residents
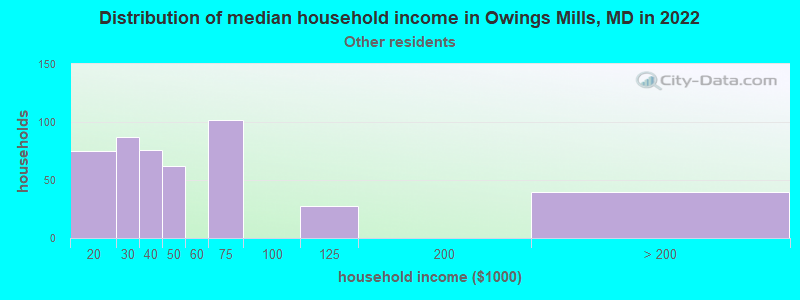
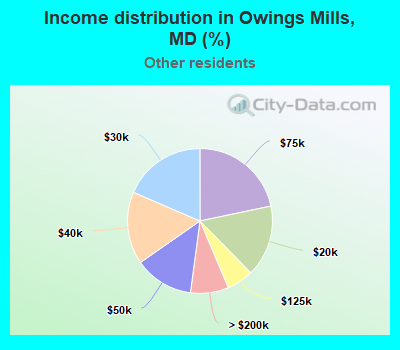
Number of households with income < $10k:
Owings Mills:
0.0% (0)
State:
3.4% (3,746)
Number of households with income $10k - 20k:
Owings Mills:
16.0% (75)
Maryland:
3.5% (3,842)
Number of households with income $20k - 30k:
Owings Mills:
18.5% (87)
Maryland:
7.6% (8,343)
Number of households with income $30k - 40k:
Owings Mills:
16.2% (76)
State:
7.5% (8,251)
Number of households with income $40k - 50k:
Owings Mills:
13.2% (62)
State:
8.6% (9,414)
Number of households with income $50k - 60k:
Owings Mills:
0.0% (0)
Maryland:
10.0% (11,048)
Number of households with income $60k - 75k:
Owings Mills:
21.7% (102)
State:
11.2% (12,339)
Number of households with income $75k - 100k:
Owings Mills:
0.0% (0)
Maryland:
17.5% (19,277)
Number of households with income $100k - 125k:
Owings Mills:
6.0% (28)
State:
8.9% (9,813)
Number of households with income $125k - 150k:
Owings Mills:
0.0% (0)
State:
6.3% (6,907)
Number of households with income $150k - 200k:
Owings Mills:
0.0% (0)
State:
8.2% (9,023)
Number of households with income > $200k:
Owings Mills:
8.5% (40)
State:
7.3% (8,036)
Aggregate household income in Owings Mills in 2022: $39,109,466
Median per capita income in Owings Mills in 2022:
Owings Mills:
$24,872
Maryland:
$24,415
Change in median per capita income between 2000 and 2022:: -15.1%
Owings Mills, Maryland:
-15.1%
Maryland:
+73.6%
Discuss Owings Mills, Maryland (MD) on our hugely popular Maryland forum.