Orland Park, IL (Illinois) Houses and Residents
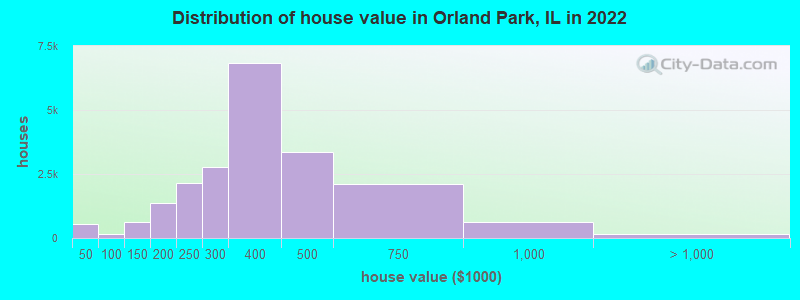
Estimated median house or condo value in 2022: $346,656 (it was $196,700 in 2000 )
Orland Park:
$346,656Illinois:
$251,600
Lower value quartile - upper value quartile: $257,951 - $435,068Mean price in 2022: Detached houses: $459,116 Here:
$459,116State:
$310,164
Townhouses or other attached units: $299,838 Here:
$299,838State:
$286,230
In 2-unit structures: $420,686 Here:
$420,686State:
$299,638
In 3-to-4-unit structures: $210,067 Here:
$210,067State:
$330,907
In 5-or-more-unit structures: $241,869 Here:
$241,869State:
$318,887
Total population: 58,666 (Urban population: 50,989, Rural population: 114 (all nonfarm) )
Houses: 24,342 (23,077 occupied: 20,164 owner occupied, 3,307 renter occupied )
% of renters here:
14%State:
33%
Housing density: 1,272 houses/condos per square mile
Median price asked for vacant for-sale houses and condos in 2022: $195,709.
Median contract rent in 2022: $1,274 (lower quartile is $1,064, upper quartile is $1,674)
Median rent asked for vacant for-rent units in 2022: $1,138
Median gross rent in Orland Park, IL in 2022: $1,389
Housing units in Orland Park with a mortgage: 11,538 (1,276 second mortgage, 22 home equity loan, 990 both second mortgage and home equity loan )Houses without a mortgage: 400
Median household income for houses/condos with a mortgage: $112,050
Median household income for apartments without a mortgage: $84,007
Median monthly housing costs: $1,466
Data:
Median house or condo value ($)
Median house or condo value ($ change since 2000)
Median house or condo value ($) - White
Median house or condo value ($) - Black or African American
Median house or condo value ($) - Asian
Median house or condo value ($) - Hispanic or Latino
Median house or condo value ($) - American Indian and Alaska Native
Median house or condo value ($) - Multirace
Median house or condo value ($) - Other Race
Median price asked for mobile homes ($)
Household density (households per square mile)
Mean house or condo value by units in structure - 1, detached ($)
Mean house or condo value by units in structure - 1, attached ($)
Mean house or condo value by units in structure - 2 ($)
Mean house or condo value by units in structure by units in structure - 3 or 4 ($)
Mean house or condo value by units in structure - 5 or more ($)
Mean house or condo value by units in structure - Boat, RV, van, etc. ($)
Mean house or condo value by units in structure - Mobile home ($)
Median contract rent ($)
Median contract rent - Lower quartile ($)
Median contract rent - Upper quartile ($)
Median gross rent ($)
Urban houses (%)
Rural houses (%)
Houses occupied (%)
Houses occupied (% change since 2000)
Houses owner occupied (%)
Houses owner occupied (% change since 2000)
Houses renter occupied (%)
Houses renter occupied (% change since 2000)
Vacant housing units - For rent (%)
Vacant housing units - For rent (% change since 2000)
Vacant housing units - For sale only (%)
Vacant housing units - For sale only (% change since 2000)
Vacant housing units - Rented or sold, not occupied (%)
Vacant housing units - Rented or sold, not occupied (% change since 2000)
Vacant housing units - For seasonal, recreational, or occasional use (%)
Vacant housing units - For seasonal, recreational, or occasional use (% change since 2000)
Vacant housing units - For migrant workers (%)
Vacant housing units - For migrant workers (% change since 2000)
Vacant housing units - Other vacant (%)
Vacant housing units - Other vacant (% change since 2000)
Median monthly housing costs ($)
Median household income for houses/condos with a mortgage ($)
Median household income for houses/condos without a mortgage ($)
Median household income ($)
Median household income ($) - White
Median household income ($) - Black or African American
Median household income ($) - Asian
Median household income ($) - Hispanic or Latino
Median household income ($) - American Indian and Alaska Native
Median household income ($) - Multirace
Median household income ($) - Other Race
Mortgage status - with mortgage (%)
Mortgage status - with second mortgage (%)
Mortgage status - with home equity loan (%)
Mortgage status - with both second mortgage and home equity loan (%)
Mortgage status - without a mortgage (%)
Median year house/condo built
Median year apartment built
Household type by relationship - Male householder living alone (%)
Household type by relationship - Male householder not living alone (%)
Household type by relationship - Female householder living alone (%)
Household type by relationship - Female householder not living alone (%)
Household type by relationship - Opposite-Sex spouse (%)
Household type by relationship - Same-Sex spouse (%)
Household type by relationship - Opposite-Sex unmarried partner (%)
Household type by relationship - Same-Sex unmarried partner (%)
Household type by relationship - In group quarters (%)
Size of family households - 2-person household (%)
Size of family households - 3-person household (%)
Size of family households - 4-person household (%)
Size of family households - 5-person household (%)
Size of family households - 6-person household (%)
Size of family households - 7-or-more-person household (%)
Size of nonfamily households - 1-person household (%)
Size of nonfamily households - 2-person household (%)
Size of nonfamily households - 3-person household (%)
Size of nonfamily households - 4-person household (%)
Size of nonfamily households - 5-person household (%)
Size of nonfamily households - 6-person household (%)
Size of nonfamily households - 7-or-moreperson household (%)
Year house built - Built 2010 or later (%)
Year house built - Built 2000 to 2009 (%)
Year house built - Built 1990 to 1999 (%)
Year house built - Built 1980 to 1989 (%)
Year house built - Built 1970 to 1979 (%)
Year house built - Built 1960 to 1969 (%)
Year house built - Built 1950 to 1959 (%)
Year house built - Built 1940 to 1949 (%)
Year house built - Built 1939 or earlier (%)
Median number of rooms in houses and condos
Median number of rooms in apartments
Median number of bedrooms in owner occupied houses
Mean number of bedrooms in owner occupied houses
Median number of bedrooms in renter occupied houses
Mean number of bedrooms in renter occupied houses
Median number of vehichles in owner occupied houses
Mean number of vehichles in owner occupied houses
Median number of vehichles in renter occupied houses
Mean number of vehichles in renter occupied houses
Rooms in owner-occupied houses - 1 room (%)
Rooms in owner-occupied houses - 2 rooms (%)
Rooms in owner-occupied houses - 3 rooms (%)
Rooms in owner-occupied houses - 4 rooms (%)
Rooms in owner-occupied houses - 5 rooms (%)
Rooms in owner-occupied houses - 6 rooms (%)
Rooms in owner-occupied houses - 7 rooms (%)
Rooms in owner-occupied houses - 8 rooms (%)
Rooms in owner-occupied houses - 9+ rooms (%)
Rooms in renter-occupied houses - 1 room (%)
Rooms in renter-occupied houses - 2 rooms (%)
Rooms in renter-occupied houses - 3 rooms (%)
Rooms in renter-occupied houses - 4 rooms (%)
Rooms in renter-occupied houses - 5 rooms (%)
Rooms in renter-occupied houses - 6 rooms (%)
Rooms in renter-occupied houses - 7 rooms (%)
Rooms in renter-occupied houses - 8 rooms (%)
Rooms in renter-occupied houses - 9+ rooms (%)
Bedrooms in owner-occupied houses - no bedrooms (%)
Bedrooms in owner-occupied houses - 1 bedroom (%)
Bedrooms in owner-occupied houses - 2 bedrooms (%)
Bedrooms in owner-occupied houses - 3 bedrooms (%)
Bedrooms in owner-occupied houses - 4 bedrooms (%)
Bedrooms in owner-occupied houses - 5+ bedrooms (%)
Bedrooms in renter-occupied houses - no bedrooms (%)
Bedrooms in renter-occupied houses - 1 bedroom (%)
Bedrooms in renter-occupied houses - 2 bedrooms (%)
Bedrooms in renter-occupied houses - 3 bedrooms (%)
Bedrooms in renter-occupied houses - 4 bedrooms (%)
Bedrooms in renter-occupied houses - 5+ bedrooms (%)
Vehicles available in owner-occupied houses - no vehicle available (%)
Vehicles available in owner-occupied houses - 1 vehicle available(%)
Vehicles available in owner-occupied houses - 2 Vehicles available (%)
Vehicles available in owner-occupied houses - 3 Vehicles available (%)
Vehicles available in owner-occupied houses - 4 Vehicles available (%)
Vehicles available in owner-occupied houses - 5+ Vehicles available (%)
Vehicles available in renter-occupied houses - no vehicle available (%)
Vehicles available in renter-occupied houses - 1 vehicle available (%)
Vehicles available in renter-occupied houses - 2 Vehicles available (%)
Vehicles available in renter-occupied houses - 3 Vehicles available (%)
Vehicles available in renter-occupied houses - 4 Vehicles available (%)
Vehicles available in renter-occupied houses - 5+ Vehicles available (%)
Housing units in structures - 1, detached (%)
Housing units in structures - 1, attached (%)
Housing units in structures - 2 (%)
Housing units in structures - 3 or 4 (%)
Housing units in structures - 5 to 9 (%)
Housing units in structures - 10 to 19 (%)
Housing units in structures - 20 to 49 (%)
Housing units in structures - 50 or more (%)
Housing units in structures - Mobile home (%)
Housing units in structures - Boat, RV, van, etc. (%)
Housing units in structures - Owners - 1, detached (%)
Housing units in structures - Owners - 1, attached (%)
Housing units in structures - Owners - 2 (%)
Housing units in structures - Owners - 3 or 4 (%)
Housing units in structures - Owners - 5 to 9 (%)
Housing units in structures - Owners - 10 to 19 (%)
Housing units in structures - Owners - 20 to 49 (%)
Housing units in structures - Owners - 50 or more (%)
Housing units in structures - Owners - Mobile home (%)
Housing units in structures - Owners - Boat, RV, van, etc. (%)
Housing units in structures - Renters - 1, detached (%)
Housing units in structures - Renters - 1, attached (%)
Housing units in structures - Renters - 2 (%)
Housing units in structures - Renters - 3 or 4 (%)
Housing units in structures - Renters - 5 to 9 (%)
Housing units in structures - Renters - 10 to 19 (%)
Housing units in structures - Renters - 20 to 49 (%)
Housing units in structures - Renters - 50 or more (%)
Housing units in structures - Renters - Mobile home (%)
Housing units in structures - Renters - Boat, RV, van, etc. (%)
House/condo owner moved in on average (years ago)
Renter moved in on average (years ago)
Year householder moved into unit - Moved in 1999 to March 2000 (%)
Year householder moved into unit - Moved in 1999 to March 2000 (%) - White
Year householder moved into unit - Moved in 1999 to March 2000 (%) - Black or African American
Year householder moved into unit - Moved in 1999 to March 2000 (%) - Asian
Year householder moved into unit - Moved in 1999 to March 2000 (%) - Hispanic or Latino
Year householder moved into unit - Moved in 1999 to March 2000 (%) - American Indian and Alaska Native
Year householder moved into unit - Moved in 1999 to March 2000 (%) - Multirace
Year householder moved into unit - Moved in 1999 to March 2000 (%) - Other Race
Year householder moved into unit - Moved in 1995 to 1998 (%)
Year householder moved into unit - Moved in 1995 to 1998 (%) - White
Year householder moved into unit - Moved in 1995 to 1998 (%) - Black or African American
Year householder moved into unit - Moved in 1995 to 1998 (%) - Asian
Year householder moved into unit - Moved in 1995 to 1998 (%) - Hispanic or Latino
Year householder moved into unit - Moved in 1995 to 1998 (%) - American Indian and Alaska Native
Year householder moved into unit - Moved in 1995 to 1998 (%) - Multirace
Year householder moved into unit - Moved in 1995 to 1998 (%) - Other Race
Year householder moved into unit - Moved in 1990 to 1994 (%)
Year householder moved into unit - Moved in 1990 to 1994 (%) - White
Year householder moved into unit - Moved in 1990 to 1994 (%) - Black or African American
Year householder moved into unit - Moved in 1990 to 1994 (%) - Asian
Year householder moved into unit - Moved in 1990 to 1994 (%) - Hispanic or Latino
Year householder moved into unit - Moved in 1990 to 1994 (%) - American Indian and Alaska Native
Year householder moved into unit - Moved in 1990 to 1994 (%) - Multirace
Year householder moved into unit - Moved in 1990 to 1994 (%) - Other Race
Year householder moved into unit - Moved in 1980 to 1989 (%)
Year householder moved into unit - Moved in 1980 to 1989 (%) - White
Year householder moved into unit - Moved in 1980 to 1989 (%) - Black or African American
Year householder moved into unit - Moved in 1980 to 1989 (%) - Asian
Year householder moved into unit - Moved in 1980 to 1989 (%) - Hispanic or Latino
Year householder moved into unit - Moved in 1980 to 1989 (%) - American Indian and Alaska Native
Year householder moved into unit - Moved in 1980 to 1989 (%) - Multirace
Year householder moved into unit - Moved in 1980 to 1989 (%) - Other Race
Year householder moved into unit - Moved in 1970 to 1979 (%)
Year householder moved into unit - Moved in 1970 to 1979 (%) - White
Year householder moved into unit - Moved in 1970 to 1979 (%) - Black or African American
Year householder moved into unit - Moved in 1970 to 1979 (%) - Asian
Year householder moved into unit - Moved in 1970 to 1979 (%) - Hispanic or Latino
Year householder moved into unit - Moved in 1970 to 1979 (%) - American Indian and Alaska Native
Year householder moved into unit - Moved in 1970 to 1979 (%) - Multirace
Year householder moved into unit - Moved in 1970 to 1979 (%) - Other Race
Year householder moved into unit - Moved in 1969 or earlier (%)
Year householder moved into unit - Moved in 1969 or earlier (%) - White
Year householder moved into unit - Moved in 1969 or earlier (%) - Black or African American
Year householder moved into unit - Moved in 1969 or earlier (%) - Asian
Year householder moved into unit - Moved in 1969 or earlier (%) - Hispanic or Latino
Year householder moved into unit - Moved in 1969 or earlier (%) - American Indian and Alaska Native
Year householder moved into unit - Moved in 1969 or earlier (%) - Multirace
Year householder moved into unit - Moved in 1969 or earlier (%) - Other Race
Housing units lacking complete plumbing facilities (%)
Housing units lacking complete kitchen facilities (%)
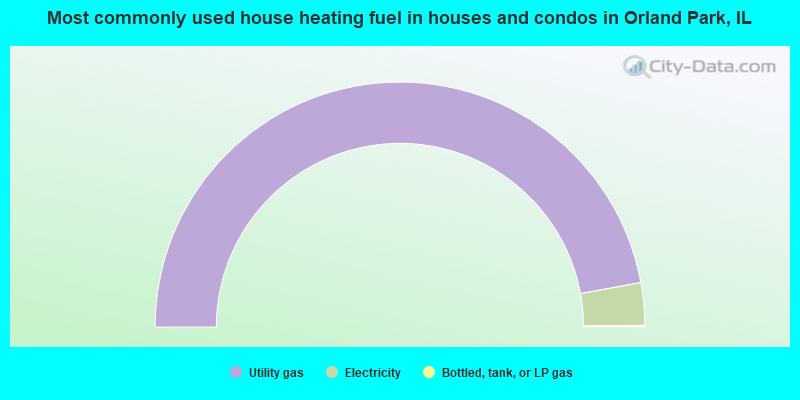
House heating fuel used in houses and condos - Utility gas (%)
House heating fuel used in houses and condos - Bottled, tank, or LP gas (%)
House heating fuel used in houses and condos - Electricity (%)
House heating fuel used in houses and condos - Fuel oil, kerosene, etc. (%)
House heating fuel used in houses and condos - Coal or coke (%)
House heating fuel used in houses and condos - Wood (%)
House heating fuel used in houses and condos - Solar energy (%)
House heating fuel used in houses and condos - Other fuel (%)
House heating fuel used in houses and condos - No fuel used (%)
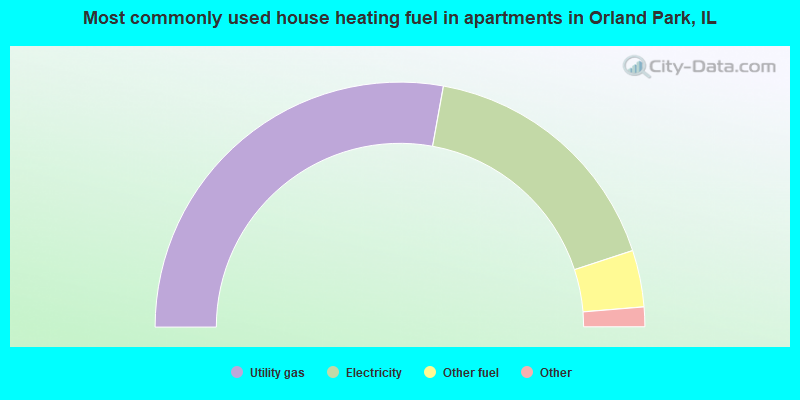
House heating fuel used in apartments - Utility gas (%)
House heating fuel used in apartments - Bottled, tank, or LP gas (%)
House heating fuel used in apartments - Electricity (%)
House heating fuel used in apartments - Fuel oil, kerosene, etc. (%)
House heating fuel used in apartments - Coal or coke (%)
House heating fuel used in apartments - Wood (%)
House heating fuel used in apartments - Solar energy (%)
House heating fuel used in apartments - Other fuel (%)
House heating fuel used in apartments - No fuel used (%)
Median year house/condo built: 1988Median year apartment built: 1991Household type by relationship:
Households: 57,048
Male householders: 11,815 (2,796 living alone ), Female householders: 10,653 (3,513 living alone )12,877 spouses (12,761 opposite-sex spouses ), 655 unmarried partners , (642 opposite-sex unmarried partners ), 17,347 children (16,759 natural , 294 adopted , 294 stepchildren ), 537 grandchildren , 421 brothers or sisters , 1,159 parents , 0 foster children , 630 other relatives , 445 non-relatives In group quarters: 503
Size of family households: 7,263 2-persons , 3,571 3-persons , 2,872 4-persons , 1,382 5-persons , 667 6-persons , 107 7-or-more-persons .
Size of nonfamily households: 6,778 1-person , 603 2-persons , 34 3-persons , 15 5-persons .
8,989 married couples with children. single-parent households (242 men , 1,358 women ).
75.5% of residents of Orland Park speak English at home. of residents speak Spanish at home (60% speak English very well , 28% speak English well , 11% speak English not well ).of residents speak other Indo-European language at home (64% speak English very well , 20% speak English well , 15% speak English not well , 1% don't speak English at all ).of residents speak Asian or Pacific Island language at home (67% speak English very well , 20% speak English well , 7% speak English not well , 6% don't speak English at all ).of residents speak other language at home (79% speak English very well , 13% speak English well , 6% speak English not well , 2% don't speak English at all ).
Foreign born population: 8,476 (14.9%)of them are naturalized citizens )
Median number of rooms in houses and condos:
Median number of rooms in apartments
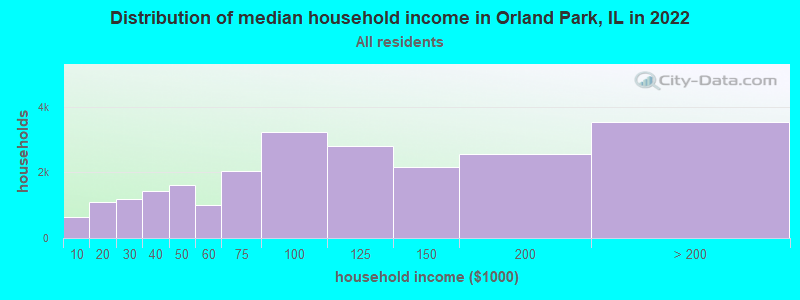
Orland Park, IL household income distribution 640 Less than $10,0001,102 $10,000 to $19,9991,183 $20,000 to $29,9991,425 $30,000 to $39,9991,618 $40,000 to $49,999998 $50,000 to $59,9992,047 $60,000 to $74,9993,226 $75,000 to $99,9992,808 $100,000 to $124,9992,169 $125,000 to $149,9992,574 $150,000 to $199,9993,537 $200,000 or more
Home value of owner - occupied houses in 2022 in Orland Park, IL 385 Less than $10,00036 $15,000 to $19,99917 $20,000 to $24,99931 $25,000 to $29,99919 $30,000 to $34,99911 $35,000 to $39,99937 $40,000 to $49,99921 $50,000 to $59,99914 $60,000 to $69,99995 $90,000 to $99,999193 $100,000 to $124,999414 $125,000 to $149,999576 $150,000 to $174,999777 $175,000 to $199,9992,156 $200,000 to $249,9992,787 $250,000 to $299,9996,833 $300,000 to $399,9993,356 $400,000 to $499,9992,092 $500,000 to $749,999609 $750,000 to $999,999112 $1,000,000 to $1,499,99944 $2,000,000 or moreRent paid by renters in 2022 in Orland Park, IL 12 $550 to $5997 $650 to $6999 $700 to $749102 $750 to $79919 $800 to $899310 $900 to $999971 $1,000 to $1,249552 $1,250 to $1,499756 $1,500 to $1,999111 $2,000 to $2,49977 $2,500 to $2,99913 $3,000 to $3,499112 $3,500 or more240 No cash rent
Percentage of workers working in this county: 80.2%Number of people working at home: 5,092 (18.5% of all workers )
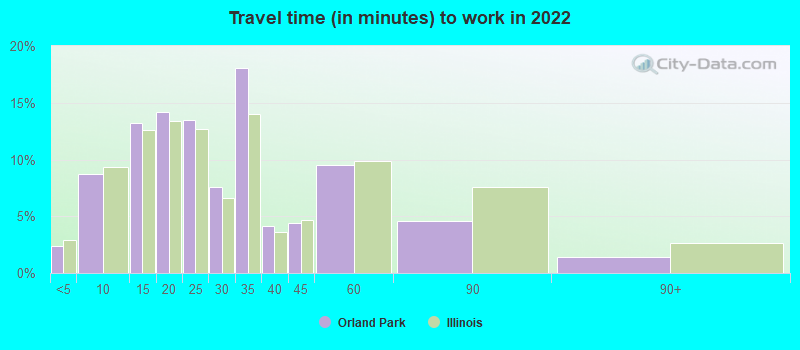
Travel time to work (commute)
Less than 5 minutes: 3215 to 9 minutes: 1,73810 to 14 minutes: 2,15815 to 19 minutes: 2,10820 to 24 minutes: 2,34825 to 29 minutes: 1,07130 to 34 minutes: 2,97635 to 39 minutes: 1,24040 to 44 minutes: 1,41145 to 59 minutes: 3,17160 to 89 minutes: 3,10190 or more minutes: 664
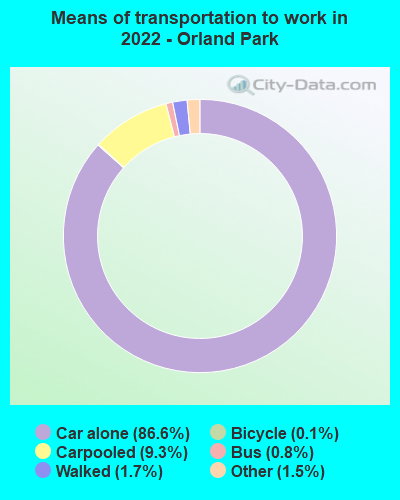
Means of transportation to work:
Drove a car alone: 18,397 (71.6%)Carpooled: 2,118 (8.2%)Bus : 166 (0.6%)Taxi: 313 (1.2%)Bicycle: 33 (0.1%)Walked: 363 (1.4%)Worked at home: 5,092 (19.8%)
Unemployment by race in 2022
Unemployment rate for White non-Hispanic residents 2.1% Males4.2% FemalesUnemployment rate for Black residents 8.9% Males8.4% FemalesUnemployment rate for Asian residents 4.9% Males3.8% FemalesUnemployment rate for other race residents 5.4% Males9.0% FemalesUnemployment rate for two or more race residents 3.7% FemalesUnemployment rate for Hispanic or Latino residents 3.9% Males5.1% Females
Year of entry for the foreign-born population in Orland Park, Illinois
1,240 2010 or later 1,658 2000 to 2009 2,039 1990 to 1999 680 1980 to 1989 1,236 1970 to 1979 2,135 Before 1970
First ancestries reported:
Polish: 5,011 (16.6%)
Irish: 3,714 (12.3%)
Italian: 2,441 (8.1%)
Palestinian: 2,309 (7.6%)
American: 1,793 (5.9%)
German: 1,708 (5.7%)
Greek: 856 (2.8%)
Lithuanian: 855 (2.8%)
Arab: 717 (2.4%)
Dutch: 517 (1.7%)
English: 351 (1.2%)
Ukrainian: 335 (1.1%)
Jordanian: 222 (0.7%)
European: 222 (0.7%)
Eastern European: 140 (0.5%)
Albanian: 138 (0.5%)
Croatian: 136 (0.5%)
Scottish: 128 (0.4%)
Serbian: 118 (0.4%)
Swedish: 118 (0.4%)
Czech: 102 (0.3%)
Russian: 97 (0.3%)
Scandinavian: 96 (0.3%)
Norwegian: 87 (0.3%)
British: 71 (0.2%)
Austrian: 64 (0.2%)
Lebanese: 59 (0.2%)
Ethiopian: 53 (0.2%)
Iraqi: 52 (0.2%)
Haitian: 52 (0.2%)
Moroccan: 44 (0.1%)
Czechoslovakian: 40 (0.1%)
Egyptian: 38 (0.1%)
Slovak: 34 (0.1%)
Hungarian: 30 (0.10%)
Turkish: 29 (0.10%)
Brazilian: 28 (0.09%)
Swiss: 27 (0.09%)
Scotch-Irish: 26 (0.09%)
Nigerian: 24 (0.08%)
French: 19 (0.06%)
Romanian: 18 (0.06%)
French Canadian: 16 (0.05%)
Assyrian: 15 (0.05%)
African: 15 (0.05%)
Latvian: 14 (0.05%)
Macedonian: 13 (0.04%)
Luxembourger: 11 (0.04%)
Northern European: 10 (0.03%)
Estonian: 10 (0.03%)
Canadian: 10 (0.03%)
Finnish: 6 (0.02%)
Slovene: 5 (0.02%)
Welsh: 5 (0.02%)
Most common places of birth for foreign-born residents (%): Poland Orland Park:
17.2% (1,462)Illinois:
6.9% (124,474)
Asia, n.e.c. Orland Park:
9.8% (833)Illinois:
0.4% (7,117)
Mexico Orland Park:
8.1% (685)Illinois:
34.7% (626,958)
India Orland Park:
7.3% (622)Illinois:
9.2% (166,409)
Philippines Orland Park:
5.4% (456)Illinois:
5.2% (93,003)
Jordan Orland Park:
5.0% (422)Illinois:
0.5% (8,827)
Lithuania Orland Park:
4.9% (419)Illinois:
0.6% (10,249)
Greece Orland Park:
4.3% (364)Illinois:
0.6% (10,720)
Korea Orland Park:
4.3% (361)Illinois:
2.2% (40,393)
Pakistan Orland Park:
3.5% (299)Illinois:
1.6% (29,519)
Saudi Arabia Orland Park:
3.4% (291)Illinois:
0.2% (3,363)
Ukraine Orland Park:
3.2% (270)Illinois:
1.6% (29,316)
Italy Orland Park:
2.8% (241)Illinois:
0.9% (15,679)
Belarus Orland Park:
1.9% (159)Illinois:
0.3% (6,186)
Albania Orland Park:
1.5% (129)Illinois:
0.4% (6,488)
Place of birth for U.S.-born residents:
This state: 42,614Other state: 4,829Northeast: 892Midwest: 2,237South: 1,126West: 606 88.9% of Orland Park residents lived in the same house 1 years ago.
Out of people who lived in different houses, 45.6% lived in this county.
Out of people who lived in different counties, 57.6% lived in Illinois.
Orland Park:
88.9%State average:
88.3%
Education attainment for males 25 years and older:
No schooling: 178Nursery to 4th grade: 545th and 6th grade: 447th and 8th grade: 2279th grade: 15810th grade: 11811th grade: 10312th grade, no diploma: 444High school graduate (or equivalency): 4,292Less than 1 year of college: 1,185Some college more than 1 year, no degree: 2,340Associate degree: 1,772Bachelor's degree: 5,680Master's degree: 2,564Professional school degree: 927Doctorate degree: 318
Education attainment for females 25 years and older:
No schooling: 181Nursery to 4th grade: 1165th and 6th grade: 567th and 8th grade: 2859th grade: 510th grade: 6811th grade: 21412th grade, no diploma: 147High school graduate (or equivalency): 5,215Less than 1 year of college: 1,500Some college more than 1 year, no degree: 2,233Associate degree: 2,307Bachelor's degree: 5,312Master's degree: 3,100Professional school degree: 368Doctorate degree: 335
Housing units in structures:
One, detached: 13,927One, attached: 4,987Two: 1833 or 4: 1,1535 to 9: 1,69510 to 19: 1,48820 to 49: 25250 or more: 650Mobile homes: 4Housing units lacking complete plumbing facilities in 2022: 0.3%Housing units lacking complete kitchen facilities in 2022: 0.9%House/condo owner moved in on average 15 years ago
Renter moved in on average 2 years ago
Private vs. public school enrollment:
Students in private schools in grades 1 to 8 (elementary and middle school): 674 Students in private schools in grades 9 to 12 (high school): 309 Students in private undergraduate colleges: 444