Olney, MD (Maryland) Houses and Residents
| Olney: | $641,942 |
| Maryland: | $398,100 |
Total population: 33,844 (Urban population: 31,651, Rural population: 0)
Houses: 12,266 (12,022 occupied: 10,787 owner occupied, 1,326 renter occupied)
| % of renters here: | 11% |
| State: | 32% |
Housing density: 944 houses/condos per square mile
Median price asked for vacant for-sale houses and condos in 2022: $586,363.
Median contract rent in 2022: $1,993 (lower quartile is $1,402, upper quartile is over $2,000)
Median rent asked for vacant for-rent units in 2022: $4,213
Median gross rent in Olney, MD in 2022: over $2,000
Housing units in Olney with a mortgage: 8,002 (847 second mortgage, 8 home equity loan, 771 both second mortgage and home equity loan)
Houses without a mortgage: 132
Median household income for houses/condos with a mortgage: $183,665
Median household income for apartments without a mortgage: $134,382
Median monthly housing costs: $2,184
Compare current foreclosures near Olney, MD:
| Photo | Address | Area | Beds / Baths | Price | Details |
|---|---|---|---|---|---|

|
#1
Ripley Manor Ter
Olney, MD 20832
|
2,311 sq. feet
|
2 baths - beds |
show details | |

|
#2
Fishermans Ct
Olney, MD 20832
|
1,188 sq. feet
|
2 baths - beds |
show details | |

|
#3
Gatsby Ter
Olney, MD 20832
|
2,356 sq. feet
|
2 baths - beds |
show details | |

|
#4
Macduff Ave
Olney, MD 20832
|
3,518 sq. feet
|
2 baths - beds |
show details | |

|
#5
Mcgee Way
Olney, MD 20832
|
1,440 sq. feet
|
2 baths - beds |
show details | |

|
#6
Boastfield Ln
Olney, MD 20832
|
1,397 sq. feet
|
2 baths - beds |
show details | |

|
#7
Hitchcock Ct
Olney, MD 20832
|
2,813 sq. feet
|
2 baths - beds |
show details | |

|
#8
Olney Laytonsville Rd
Olney, MD 20832
|
2,468 sq. feet
|
3 baths - beds |
show details | |

|
#9
Old Baltimore Dr
Olney, MD 20832
|
2,992 sq. feet
|
3 baths - beds |
show details | |

|
#10
Lochness Cir # 43
Olney, MD 20832
|
660 sq. feet
|
- baths - beds |
show details |
| Photo | Address | Area | Beds / Baths | Price | Details |
|---|---|---|---|---|---|

|
#11
Olney Laytonsville Rd Ste B
Olney, MD 20832
|
- sq. feet
|
- baths - beds |
show details | |

|
#12
9th St NW
Washington, DC 20011
|
1,604 sq. feet
|
2 baths 3 beds |
$598,000
|
show details |

|
#13
17th St NW Apt 504
Washington, DC 20009
|
800 sq. feet
|
1 baths 1 beds |
$405,000
|
show details |

|
#14
Hammersmith Cir
Silver Spring, MD 20906
|
1,152 sq. feet
|
1 baths 3 beds |
$353,600
|
show details |

|
#15
Pooks Hill Rd Apt 1612s
Bethesda, MD 20814
|
1,250 sq. feet
|
1 baths 2 beds |
$289,000
|
show details |

|
#16
Brooke Knolls Rd
Gaithersburg, MD 20882
|
1,704 sq. feet
|
3 baths 4 beds |
$681,500
|
show details |

|
#17
Monroe St NW
Washington, DC 20010
|
- sq. feet
|
2 baths 2 beds |
$665,000
|
show details |

|
#18
Mandan Rd Apt 103 Unit 621
Greenbelt, MD 20770
|
1,420 sq. feet
|
2 baths 3 beds |
$179,900
|
show details |

|
#19
Cathedral Ave NW Apt 108
Washington, DC 20016
|
765 sq. feet
|
1 baths 1 beds |
$269,900
|
show details |

|
#20
Eastern Ave NE
Washington, DC 20011
|
1,024 sq. feet
|
1 baths 3 beds |
$395,000
|
show details |
| Photo | Address | Area | Beds / Baths | Price | Details |
|---|---|---|---|---|---|

|
#21
Interlachen Dr Apt 111
Silver Spring, MD 20906
|
965 sq. feet
|
1 baths 2 beds |
$148,000
|
show details |

|
#22
13th Ave
Hyattsville, MD 20782
|
1,598 sq. feet
|
1 baths 4 beds |
show details | |

|
#23
Manor Ln
Ellicott City, MD 21042
|
864 sq. feet
|
1 baths 2 beds |
show details | |

|
#24
Sargent Rd NE
Washington, DC 20017
|
1,360 sq. feet
|
2 baths 3 beds |
show details | |

|
#25
Berryville Rd
Germantown, MD 20874
|
960 sq. feet
|
1 baths 3 beds |
show details | |

|
#26
16th St NW Apt 305
Washington, DC 20009
|
1,158 sq. feet
|
1 baths 2 beds |
show details | |

|
#27
Brassie Pl Apt 201
Montgomery Village, MD 20886
|
1,054 sq. feet
|
2 baths 2 beds |
show details | |

|
#28
Jefferson St NW
Washington, DC 20011
|
1,280 sq. feet
|
5 baths 6 beds |
show details | |

|
#29
Connecticut Ave NW Apt 606
Washington, DC 20008
|
160 sq. feet
|
1 baths 1 beds |
show details | |

|
#30
Palmetto Cir
Germantown, MD 20874
|
1,135 sq. feet
|
2 baths 3 beds |
show details |
| Photo | Address | Area | Beds / Baths | Price | Details |
|---|---|---|---|---|---|

|
#31
Softwater Way
Columbia, MD 21046
|
1,520 sq. feet
|
3 baths 4 beds |
show details | |

|
#32
Avena St
Silver Spring, MD 20902
|
1,188 sq. feet
|
2 baths 3 beds |
show details | |

|
#33
Navahoe St
Hyattsville, MD 20783
|
1,068 sq. feet
|
2 baths 3 beds |
show details | |

|
#34
Oakland Mills Rd
Columbia, MD 21046
|
- sq. feet
|
3 baths 4 beds |
show details | |

|
#35
S Arbory Ln
Laurel, MD 20707
|
1,283 sq. feet
|
3 baths 3 beds |
show details | |

|
#36
Mcwhorter Farm Ct
Damascus, MD 20872
|
6,621 sq. feet
|
6 baths 5 beds |
show details | |

|
#37
Brooke Rd
Sandy Spring, MD 20860
|
5,046 sq. feet
|
4 baths 4 beds |
show details | |

|
#38
55th Ave
Bladensburg, MD 20710
|
1,023 sq. feet
|
3 baths 5 beds |
show details | |

|
#39
Irving St NW
Washington, DC 20010
|
1,088 sq. feet
|
1 baths 3 beds |
show details | |

|
#40
Kansas Ave NW
Washington, DC 20011
|
1,484 sq. feet
|
1 baths 3 beds |
show details |
| Photo | Address | Area | Beds / Baths | Price | Details |
|---|---|---|---|---|---|

|
#41
Sycamore St NW
Washington, DC 20012
|
2,263 sq. feet
|
4 baths 3 beds |
show details | |

|
#42
Georgetown Pike
Great Falls, VA 22066
|
3,965 sq. feet
|
4 baths 4 beds |
show details | |

|
#43
Alaska Ave NW
Washington, DC 20012
|
1,768 sq. feet
|
2 baths 3 beds |
show details | |

|
#44
Shoal Pl
Sterling, VA 20165
|
3,542 sq. feet
|
3 baths 4 beds |
show details | |

|
#45
Verbena St NW
Washington, DC 20012
|
1,706 sq. feet
|
2 baths 4 beds |
show details | |

|
#46
Asbury Pl NW
Washington, DC 20016
|
2,464 sq. feet
|
3 baths 4 beds |
show details | |

|
#47
Asbury Pl NW
Washington, DC 20016
|
1,813 sq. feet
|
3 baths 4 beds |
show details | |

|
#48
Oglethorpe St NE
Washington, DC 20011
|
1,123 sq. feet
|
1 baths 3 beds |
show details | |

|
#49
17th Pl NE
Washington, DC 20018
|
1,200 sq. feet
|
1 baths 3 beds |
show details | |

|
Check over 1 million property listings on Foreclosure.com!
|
browse all offers | |||

Latest news about housing in Olney, MD collected exclusively by city-data.com from local newspapers, TV, and radio stations


Median year apartment built: 1989
Household type by relationship:
Households: 35,374- Male householders: 6,384 (483 living alone), Female householders: 5,494 (1,248 living alone)
8,184 spouses (8,147 opposite-sex spouses), 333 unmarried partners, (285 opposite-sex unmarried partners), 12,323 children (11,867 natural, 315 adopted, 140 stepchildren), 406 grandchildren, 199 brothers or sisters, 723 parents, 31 foster children, 449 other relatives, 654 non-relatives
- In group quarters: 189
Size of family households: 3,597 2-persons, 2,091 3-persons, 2,524 4-persons, 990 5-persons, 260 6-persons, 68 7-or-more-persons.
Size of nonfamily households: 1,979 1-person, 397 2-persons.
7,070 married couples with children.
943 single-parent households (237 men, 706 women).
72.4% of residents of Olney speak English at home.
6.4% of residents speak Spanish at home (66% speak English very well, 19% speak English well, 13% speak English not well, 2% don't speak English at all).
6.6% of residents speak other Indo-European language at home (80% speak English very well, 12% speak English well, 4% speak English not well, 3% don't speak English at all).
8.5% of residents speak Asian or Pacific Island language at home (65% speak English very well, 20% speak English well, 13% speak English not well, 3% don't speak English at all).
5.5% of residents speak other language at home (82% speak English very well, 11% speak English well, 7% speak English not well).
Foreign born population: 8,231 (23.3%)
(72.0% of them are naturalized citizens)
| Here: | 8.0 |
| State: | 7.3 |
| Here: | 6.1 |
| State: | 4.2 |

- Bedrooms in owner-occupied houses and condos in Olney, Maryland
- 23no bedroom
- 1031 bedroom
- 6972 bedrooms
- 3,1743 bedrooms
- 5,1484 bedrooms
- 1,6435+ bedrooms

- Bedrooms in renter-occupied apartments in Olney, Maryland
- 15no bedroom
- 1141 bedroom
- 3392 bedrooms
- 5633 bedrooms
- 2124 bedrooms
- 835+ bedrooms

- Cars and other vehicles available in Olney in owner-occupied houses/condos
- 62no vehicle
- 2,0781 vehicle
- 5,4582 vehicles
- 2,1403 vehicles
- 8744 vehicles
- 1765+ vehicles

- Cars and other vehicles available in Olney in renter-occupied apartments
- 150no vehicle
- 3891 vehicle
- 6202 vehicles
- 733 vehicles
- 944 vehicles
- 05+ vehicles

- Rooms in owner-occupied houses in Olney, Maryland
- 231 room
- 122 rooms
- 1713 rooms
- 5714 rooms
- 7775 rooms
- 1,0176 rooms
- 1,2677 rooms
- 2,4108 rooms
- 4,5409+ rooms

- Rooms in renter-occupied apartments in Olney, Maryland
- 151 room
- 572 rooms
- 1263 rooms
- 1944 rooms
- 1415 rooms
- 2216 rooms
- 2387 rooms
- 1698 rooms
- 1669+ rooms


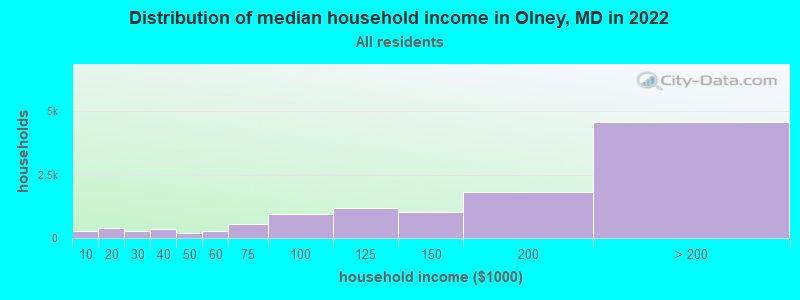
Olney, MD household income distribution

- 286Less than $10,000
- 385$10,000 to $19,999
- 262$20,000 to $29,999
- 357$30,000 to $39,999
- 201$40,000 to $49,999
- 289$50,000 to $59,999
- 571$60,000 to $74,999
- 967$75,000 to $99,999
- 1,166$100,000 to $124,999
- 1,023$125,000 to $149,999
- 1,813$150,000 to $199,999
- 4,580$200,000 or more
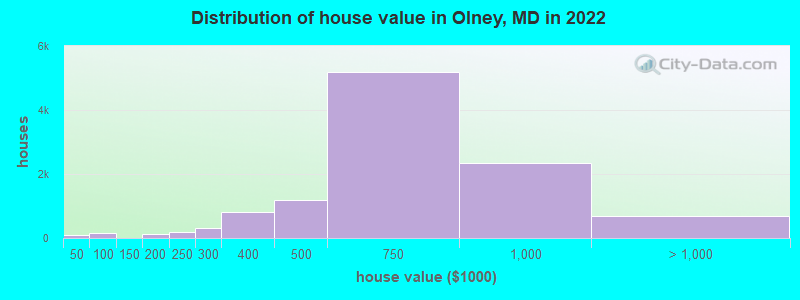
Home value of owner - occupied houses in 2022 in Olney, MD
-
- 51Less than $10,000
- 4$15,000 to $19,999
- 6$30,000 to $34,999
- 39$40,000 to $49,999
- 17$50,000 to $59,999
- 60$60,000 to $69,999
- 6$70,000 to $79,999
- 24$90,000 to $99,999
- 8$125,000 to $149,999
- 47$150,000 to $174,999
- 87$175,000 to $199,999
- 179$200,000 to $249,999
- 300$250,000 to $299,999
- 825$300,000 to $399,999
- 1,175$400,000 to $499,999
- 5,182$500,000 to $749,999
- 2,346$750,000 to $999,999
- 378$1,000,000 to $1,499,999
- 57$1,500,000 to $1,999,999
- 257$2,000,000 or more
Rent paid by renters in 2022 in Olney, MD
-
- 5Less than $100
- 5$100 to $149
- 50$150 to $199
- 24$300 to $349
- 17$400 to $449
- 16$450 to $499
- 33$600 to $649
- 26$700 to $749
- 61$800 to $899
- 8$900 to $999
- 118$1,250 to $1,499
- 206$1,500 to $1,999
- 441$2,000 to $2,499
- 69$2,500 to $2,999
- 61$3,000 to $3,499
- 9$3,500 or more
- 116No cash rent


Percentage of workers working in this county: 78.4%
Number of people working at home: 5,890 (32.2% of all workers)
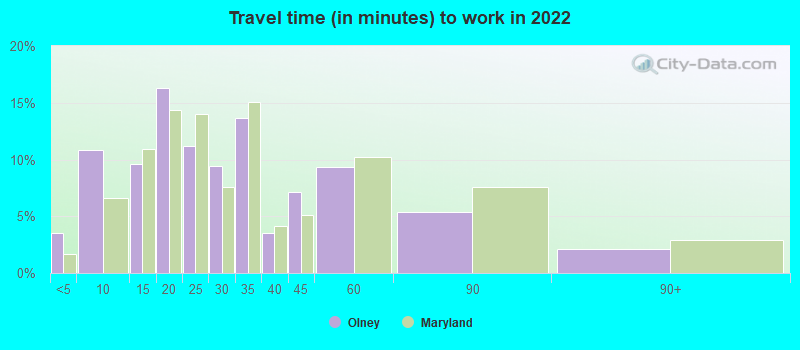
Travel time to work (commute)
- Less than 5 minutes: 254
- 5 to 9 minutes: 753
- 10 to 14 minutes: 1,016
- 15 to 19 minutes: 932
- 20 to 24 minutes: 1,771
- 25 to 29 minutes: 820
- 30 to 34 minutes: 2,167
- 35 to 39 minutes: 637
- 40 to 44 minutes: 1,026
- 45 to 59 minutes: 1,545
- 60 to 89 minutes: 1,436
- 90 or more minutes: 211
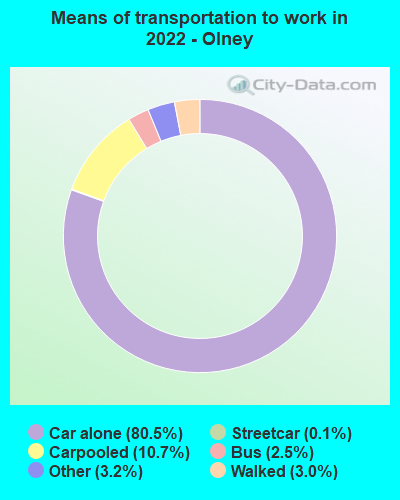
Means of transportation to work:
- Drove a car alone: 5,777 (46.6%)
- Carpooled: 819 (6.6%)
- Bus: 153 (1.2%)
- Subway or elevated rail: 7 (0.1%)
- Taxi: 245 (2.0%)
- Walked: 181 (1.5%)
- Worked at home: 5,890 (47.5%)

- Unemployment by race in 2022
- Unemployment rate for White non-Hispanic residents
- 1.7%Males
- 1.9%Females
- Unemployment rate for Black residents
- 7.7%Males
- 3.9%Females
- Unemployment rate for Asian residents
- 1.1%Males
- 3.3%Females
- Unemployment rate for other race residents
- 1.6%Males
- Unemployment rate for two or more race residents
- 2.4%Males
- 7.9%Females
- Unemployment rate for Hispanic or Latino residents
- 3.5%Males

- Year of entry for the foreign-born population in Olney, Maryland
- 1,7902010 or later
- 2,0342000 to 2009
- 1,4431990 to 1999
- 1,2981980 to 1989
- 1,2151970 to 1979
- 883Before 1970

First ancestries reported:
- Irish: 1,278 (6.6%)
- German: 998 (5.2%)
- American: 888 (4.6%)
- Italian: 733 (3.8%)
- English: 714 (3.7%)
- Ethiopian: 702 (3.6%)
- European: 601 (3.1%)
- Kenyan: 581 (3.0%)
- Russian: 537 (2.8%)
- African: 381 (2.0%)
- Eastern European: 373 (1.9%)
- Polish: 317 (1.6%)
- Iranian: 281 (1.5%)
- Northern European: 256 (1.3%)
- Portuguese: 218 (1.1%)
- Ukrainian: 184 (1.0%)
- Scottish: 171 (0.9%)
- Jamaican: 160 (0.8%)
- Greek: 147 (0.8%)
- Finnish: 141 (0.7%)
- Lithuanian: 140 (0.7%)
- Scotch-Irish: 128 (0.7%)
- British: 110 (0.6%)
- Lebanese: 106 (0.6%)
- Czech: 89 (0.5%)
- Albanian: 86 (0.4%)
- Brazilian: 83 (0.4%)
- Egyptian: 71 (0.4%)
- Swedish: 61 (0.3%)
- Dutch: 53 (0.3%)
- Slovak: 53 (0.3%)
- Hungarian: 51 (0.3%)
- Afghan: 39 (0.2%)
- Trinidadian and Tobagonian: 37 (0.2%)
- Romanian: 36 (0.2%)
- Guyanese: 32 (0.2%)
- Danish: 30 (0.2%)
- Nigerian: 29 (0.2%)
- Jordanian: 27 (0.1%)
- French Canadian: 25 (0.1%)
- West Indian: 24 (0.1%)
- Swiss: 23 (0.1%)
- French: 22 (0.1%)
- Syrian: 16 (0.08%)
- Norwegian: 15 (0.08%)
- Cajun: 15 (0.08%)
- Liberian: 14 (0.07%)
- Cypriot: 13 (0.07%)
- Ghanaian: 13 (0.07%)
- Sierra Leonean: 12 (0.06%)
- U.S. Virgin Islander: 12 (0.06%)
- Armenian: 10 (0.05%)
- Welsh: 10 (0.05%)
- Austrian: 9 (0.05%)
- Scandinavian: 8 (0.04%)
- Palestinian: 6 (0.03%)
- Croatian: 5 (0.03%)
- Moroccan: 5 (0.03%)
- Canadian: 4 (0.02%)
- Israeli: 2 (0.01%)
Most common places of birth for foreign-born residents (%):
| Olney: | 9.1% (746) |
| Maryland: | 3.2% (30,870) |
| Olney: | 8.3% (686) |
| Maryland: | 3.4% (32,635) |
| Olney: | 6.8% (563) |
| Maryland: | 6.4% (61,725) |
| Olney: | 5.7% (467) |
| Maryland: | 4.6% (44,742) |
| Olney: | 4.2% (346) |
| Maryland: | 12.0% (115,412) |
| Olney: | 4.1% (337) |
| Maryland: | 0.8% (7,497) |
| Olney: | 3.0% (243) |
| Maryland: | 3.8% (36,698) |
| Olney: | 2.6% (217) |
| Maryland: | 0.9% (8,520) |
| Olney: | 2.5% (209) |
| Maryland: | 1.3% (12,074) |
| Olney: | 2.5% (206) |
| Maryland: | 1.8% (17,161) |
| Olney: | 2.3% (193) |
| Maryland: | 1.0% (9,481) |
| Olney: | 2.3% (193) |
| Maryland: | 1.2% (11,980) |
| Olney: | 2.2% (182) |
| Maryland: | 1.9% (18,716) |
| Olney: | 2.1% (176) |
| Maryland: | 0.5% (4,888) |
| Olney: | 2.1% (170) |
| Maryland: | 1.3% (12,898) |
| Olney: | 2.1% (169) |
| Maryland: | 0.7% (7,124) |
| Olney: | 1.9% (153) |
| Maryland: | 2.8% (27,444) |
| Olney: | 1.8% (150) |
| Maryland: | 0.7% (7,000) |
| Olney: | 1.8% (148) |
| Maryland: | 0.9% (8,603) |
| Olney: | 1.7% (144) |
| Maryland: | 0.3% (3,199) |
Place of birth for U.S.-born residents:
- This state: 12,125
- Other state: 13,723
- Northeast: 3,964
- Midwest: 1,675
- South: 6,841
- West: 1,269
93.3% of Olney residents lived in the same house 1 years ago.
Out of people who lived in different houses, 39.8% lived in this county.
Out of people who lived in different counties, 26.4% lived in Maryland.
| Olney: | 93.3% |
| State average: | 88.5% |
Education attainment for males 25 years and older:
- No schooling: 128
- Nursery to 4th grade: 11
- 5th and 6th grade: 33
- 7th and 8th grade: 45
- 9th grade: 12
- 10th grade: 24
- 11th grade: 141
- 12th grade, no diploma: 52
- High school graduate (or equivalency): 1,214
- Less than 1 year of college: 473
- Some college more than 1 year, no degree: 1,009
- Associate degree: 515
- Bachelor's degree: 3,896
- Master's degree: 2,313
- Professional school degree: 765
- Doctorate degree: 639

Education attainment for females 25 years and older:
- No schooling: 172
- Nursery to 4th grade: 4
- 5th and 6th grade: 32
- 7th and 8th grade: 0
- 9th grade: 20
- 10th grade: 23
- 11th grade: 40
- 12th grade, no diploma: 130
- High school graduate (or equivalency): 1,899
- Less than 1 year of college: 549
- Some college more than 1 year, no degree: 831
- Associate degree: 789
- Bachelor's degree: 4,324
- Master's degree: 3,020
- Professional school degree: 506
- Doctorate degree: 495


Housing units in structures:
- One, detached: 8,159
- One, attached: 3,369
- Two: 60
- 3 or 4: 33
- 5 to 9: 120
- 10 to 19: 184
- 20 to 49: 171
- 50 or more: 167
Housing units lacking complete kitchen facilities in 2022: 0.3%
House/condo owner moved in on average 15 years ago
Renter moved in on average 6 years ago

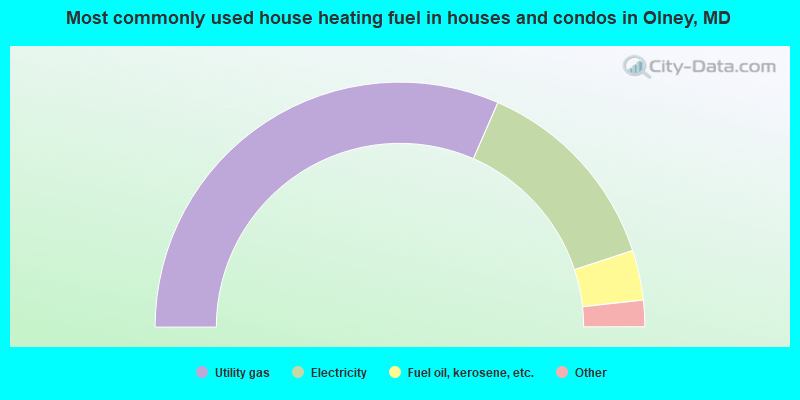
- 63.1%Utility gas
- 26.8%Electricity
- 6.6%Fuel oil, kerosene, etc.
- 2.3%Bottled, tank, or LP gas
- 0.4%Wood
- 0.4%Other fuel
- 0.3%Solar energy
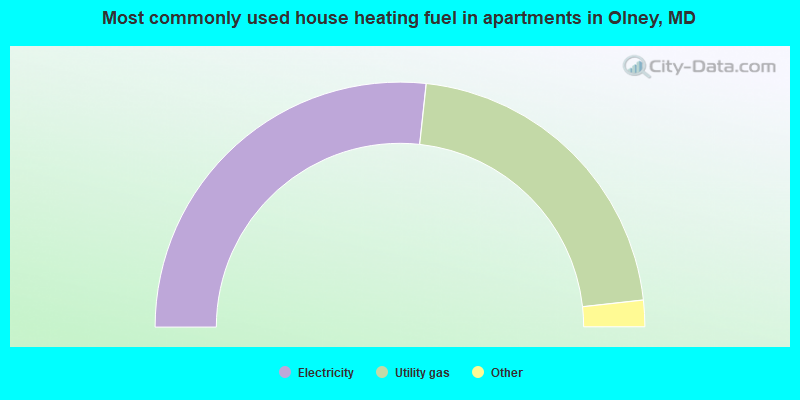
- 53.5%Electricity
- 43.1%Utility gas
- 2.9%Fuel oil, kerosene, etc.
- 0.5%Bottled, tank, or LP gas
Private vs. public school enrollment:
| Here: | 18.6% |
| Maryland: | 15.2% |
| Here: | 27.0% |
| Maryland: | 14.4% |
| Here: | 21.4% |
| Maryland: | 20.2% |


