Races in Olney, Maryland (MD) Detailed Stats
Data:
Races - White alone (%)
Races - White alone (% change since 2000)
Races - Black alone (%)
Races - Black alone (% change since 2000)
Races - American Indian alone (%)
Races - American Indian alone (% change since 2000)
Races - Asian alone (%)
Races - Asian alone (% change since 2000)
Races - Hispanic (%)
Races - Hispanic (% change since 2000)
Races - Native Hawaiian and Other Pacific Islander alone (%)
Races - Native Hawaiian and Other Pacific Islander alone (% change since 2000)
Races - Two or more races(%)
Races - Two or more races(% change since 2000)
Races - Other race alone (%)
Races - Other race alone (% change since 2000)
Racial diversity
Place of birth - Born in state of residence (%)
Place of birth - Born in state of residence (%) - White
Place of birth - Born in state of residence (%) - Black or African American
Place of birth - Born in state of residence (%) - Asian
Place of birth - Born in state of residence (%) - Hispanic or Latino
Place of birth - Born in state of residence (%) - American Indian and Alaska Native
Place of birth - Born in state of residence (%) - Multirace
Place of birth - Born in state of residence (%) - Other Race
Place of birth - Born in other state (%)
Place of birth - Born in other state (%) - White
Place of birth - Born in other state (%) - Black or African American
Place of birth - Born in other state (%) - Asian
Place of birth - Born in other state (%) - Hispanic or Latino
Place of birth - Born in other state (%) - American Indian and Alaska Native
Place of birth - Born in other state (%) - Multirace
Place of birth - Born in other state (%) - Other Race
Place of birth - Native, outside of US (%)
Place of birth - Native, outside of US (%) - White
Place of birth - Native, outside of US (%) - Black or African American
Place of birth - Native, outside of US (%) - Asian
Place of birth - Native, outside of US (%) - Hispanic or Latino
Place of birth - Native, outside of US (%) - American Indian and Alaska Native
Place of birth - Native, outside of US (%) - Multirace
Place of birth - Native, outside of US (%) - Other Race
Place of birth - Foreign born (%)
Place of birth - Foreign born (%) - White
Place of birth - Foreign born (%) - Black or African American
Place of birth - Foreign born (%) - Asian
Place of birth - Foreign born (%) - Hispanic or Latino
Place of birth - Foreign born (%) - American Indian and Alaska Native
Place of birth - Foreign born (%) - Multirace
Place of birth - Foreign born (%) - Other Race
Residents speaking English at home (%)
Residents speaking English at home - Born in the United States (%)
Residents speaking English at home - Native, born elsewhere (%)
Residents speaking English at home - Foreign born (%)
Residents speaking Spanish at home (%)
Residents speaking Spanish at home - Born in the United States (%)
Residents speaking Spanish at home - Native, born elsewhere (%)
Residents speaking Spanish at home - Foreign born (%)
Residents speaking other language at home (%)
Residents speaking other language at home - Born in the United States (%)
Residents speaking other language at home - Native, born elsewhere (%)
Residents speaking other language at home - Foreign born (%)
Marital status - Never married (%)
Marital status - Now married (%)
Marital status - Separated (%)
Marital status - Widowed (%)
Marital status - Divorced (%)
Ancestries Reported - Arab (%)
Ancestries Reported - Czech (%)
Ancestries Reported - Danish (%)
Ancestries Reported - Dutch (%)
Ancestries Reported - English (%)
Ancestries Reported - French (%)
Ancestries Reported - French Canadian (%)
Ancestries Reported - German (%)
Ancestries Reported - Greek (%)
Ancestries Reported - Hungarian (%)
Ancestries Reported - Irish (%)
Ancestries Reported - Italian (%)
Ancestries Reported - Lithuanian (%)
Ancestries Reported - Norwegian (%)
Ancestries Reported - Polish (%)
Ancestries Reported - Portuguese (%)
Ancestries Reported - Russian (%)
Ancestries Reported - Scotch-Irish (%)
Ancestries Reported - Scottish (%)
Ancestries Reported - Slovak (%)
Ancestries Reported - Subsaharan African (%)
Ancestries Reported - Swedish (%)
Ancestries Reported - Swiss (%)
Ancestries Reported - Ukrainian (%)
Ancestries Reported - United States (%)
Ancestries Reported - Welsh (%)
Ancestries Reported - West Indian (%)
Ancestries Reported - Other (%)
Geographical mobility - Same house 1 year ago (%)
Geographical mobility - Same house 1 year ago (%) - White
Geographical mobility - Same house 1 year ago (%) - Black or African American
Geographical mobility - Same house 1 year ago (%) - Asian
Geographical mobility - Same house 1 year ago (%) - Hispanic or Latino
Geographical mobility - Same house 1 year ago (%) - American Indian and Alaska Native
Geographical mobility - Same house 1 year ago (%) - Multirace
Geographical mobility - Same house 1 year ago (%) - Other Race
Geographical mobility - Moved within same county (%)
Geographical mobility - Moved within same county (%) - White
Geographical mobility - Moved within same county (%) - Black or African American
Geographical mobility - Moved within same county (%) - Asian
Geographical mobility - Moved within same county (%) - Hispanic or Latino
Geographical mobility - Moved within same county (%) - American Indian and Alaska Native
Geographical mobility - Moved within same county (%) - Multirace
Geographical mobility - Moved within same county (%) - Other Race
Geographical mobility - Moved from different county within same state (%)
Geographical mobility - Moved from different county within same state (%) - White
Geographical mobility - Moved from different county within same state (%) - Black or African American
Geographical mobility - Moved from different county within same state (%) - Asian
Geographical mobility - Moved from different county within same state (%) - Hispanic or Latino
Geographical mobility - Moved from different county within same state (%) - American Indian and Alaska Native
Geographical mobility - Moved from different county within same state (%) - Multirace
Geographical mobility - Moved from different county within same state (%) - Other Race
Geographical mobility - Moved from different state (%)
Geographical mobility - Moved from different state (%) - White
Geographical mobility - Moved from different state (%) - Black or African American
Geographical mobility - Moved from different state (%) - Asian
Geographical mobility - Moved from different state (%) - Hispanic or Latino
Geographical mobility - Moved from different state (%) - American Indian and Alaska Native
Geographical mobility - Moved from different state (%) - Multirace
Geographical mobility - Moved from different state (%) - Other Race
Geographical mobility - Moved from abroad (%)
Geographical mobility - Moved from abroad (%) - White
Geographical mobility - Moved from abroad (%) - Black or African American
Geographical mobility - Moved from abroad (%) - Asian
Geographical mobility - Moved from abroad (%) - Hispanic or Latino
Geographical mobility - Moved from abroad (%) - American Indian and Alaska Native
Geographical mobility - Moved from abroad (%) - Multirace
Geographical mobility - Moved from abroad (%) - Other Race
Place of birth for the foreign-born population - Ireland (%)
Place of birth for the foreign-born population - Denmark (%)
Place of birth for the foreign-born population - Norway (%)
Place of birth for the foreign-born population - Sweden (%)
Place of birth for the foreign-born population - United Kingdom (%)
Place of birth for the foreign-born population - England (%)
Place of birth for the foreign-born population - Scotland (%)
Place of birth for the foreign-born population - Other Northern Europe (%)
Place of birth for the foreign-born population - Austria (%)
Place of birth for the foreign-born population - Belgium (%)
Place of birth for the foreign-born population - France (%)
Place of birth for the foreign-born population - Germany (%)
Place of birth for the foreign-born population - Netherlands (%)
Place of birth for the foreign-born population - Switzerland (%)
Place of birth for the foreign-born population - Other Western Europe (%)
Place of birth for the foreign-born population - Greece (%)
Place of birth for the foreign-born population - Italy (%)
Place of birth for the foreign-born population - Portugal (%)
Place of birth for the foreign-born population - Spain (%)
Place of birth for the foreign-born population - Other Southern Europe (%)
Place of birth for the foreign-born population - Albania (%)
Place of birth for the foreign-born population - Belarus (%)
Place of birth for the foreign-born population - Bosnia and Herzegovina (%)
Place of birth for the foreign-born population - Bulgaria (%)
Place of birth for the foreign-born population - Croatia (%)
Place of birth for the foreign-born population - Czechoslovakia (%)
Place of birth for the foreign-born population - Hungary (%)
Place of birth for the foreign-born population - Latvia (%)
Place of birth for the foreign-born population - Lithuania (%)
Place of birth for the foreign-born population - North Macedonia (Macedonia) (%)
Place of birth for the foreign-born population - Moldova (%)
Place of birth for the foreign-born population - Poland (%)
Place of birth for the foreign-born population - Romania (%)
Place of birth for the foreign-born population - Russia (%)
Place of birth for the foreign-born population - Serbia (%)
Place of birth for the foreign-born population - Ukraine (%)
Place of birth for the foreign-born population - Other Eastern Europe (%)
Place of birth for the foreign-born population - China (%)
Place of birth for the foreign-born population - Hong Kong (%)
Place of birth for the foreign-born population - Taiwan (%)
Place of birth for the foreign-born population - Japan (%)
Place of birth for the foreign-born population - Korea (%)
Place of birth for the foreign-born population - Other Eastern Asia (%)
Place of birth for the foreign-born population - Afghanistan (%)
Place of birth for the foreign-born population - Bangladesh (%)
Place of birth for the foreign-born population - India (%)
Place of birth for the foreign-born population - Iran (%)
Place of birth for the foreign-born population - Kazakhstan (%)
Place of birth for the foreign-born population - Nepal (%)
Place of birth for the foreign-born population - Pakistan (%)
Place of birth for the foreign-born population - Sri Lanka (%)
Place of birth for the foreign-born population - Uzbekistan (%)
Place of birth for the foreign-born population - Other South Central Asia (%)
Place of birth for the foreign-born population - Burma (%)
Place of birth for the foreign-born population - Cambodia (%)
Place of birth for the foreign-born population - Indonesia (%)
Place of birth for the foreign-born population - Laos (%)
Place of birth for the foreign-born population - Malaysia (%)
Place of birth for the foreign-born population - Philippines (%)
Place of birth for the foreign-born population - Singapore (%)
Place of birth for the foreign-born population - Thailand (%)
Place of birth for the foreign-born population - Vietnam (%)
Place of birth for the foreign-born population - Other South Eastern Asia (%)
Place of birth for the foreign-born population - Armenia (%)
Place of birth for the foreign-born population - Iraq (%)
Place of birth for the foreign-born population - Israel (%)
Place of birth for the foreign-born population - Jordan (%)
Place of birth for the foreign-born population - Kuwait (%)
Place of birth for the foreign-born population - Lebanon (%)
Place of birth for the foreign-born population - Saudi Arabia (%)
Place of birth for the foreign-born population - Syria (%)
Place of birth for the foreign-born population - Turkey (%)
Place of birth for the foreign-born population - Yemen (%)
Place of birth for the foreign-born population - Other Western Asia (%)
Place of birth for the foreign-born population - Eritrea (%)
Place of birth for the foreign-born population - Ethiopia (%)
Place of birth for the foreign-born population - Kenya (%)
Place of birth for the foreign-born population - Somalia (%)
Place of birth for the foreign-born population - Uganda (%)
Place of birth for the foreign-born population - Zimbabwe (%)
Place of birth for the foreign-born population - Other Eastern Africa (%)
Place of birth for the foreign-born population - Cameroon (%)
Place of birth for the foreign-born population - Congo (%)
Place of birth for the foreign-born population - Democratic Republic of Congo (Zaire) (%)
Place of birth for the foreign-born population - Other Middle Africa (%)
Place of birth for the foreign-born population - Egypt (%)
Place of birth for the foreign-born population - Morocco (%)
Place of birth for the foreign-born population - Sudan (%)
Place of birth for the foreign-born population - Other Northern Africa (%)
Place of birth for the foreign-born population - South Africa (%)
Place of birth for the foreign-born population - Other Southern Africa (%)
Place of birth for the foreign-born population - Cabo Verde (%)
Place of birth for the foreign-born population - Ghana (%)
Place of birth for the foreign-born population - Liberia (%)
Place of birth for the foreign-born population - Nigeria (%)
Place of birth for the foreign-born population - Senegal (%)
Place of birth for the foreign-born population - Sierra Leone (%)
Place of birth for the foreign-born population - Other Western Africa (%)
Place of birth for the foreign-born population - Australia (%)
Place of birth for the foreign-born population - New Zealand (%)
Place of birth for the foreign-born population - Fiji (%)
Place of birth for the foreign-born population - Micronesia (%)
Place of birth for the foreign-born population - Bahamas (%)
Place of birth for the foreign-born population - Barbados (%)
Place of birth for the foreign-born population - Cuba (%)
Place of birth for the foreign-born population - Dominica (%)
Place of birth for the foreign-born population - Dominican Republic (%)
Place of birth for the foreign-born population - Grenada (%)
Place of birth for the foreign-born population - Haiti (%)
Place of birth for the foreign-born population - Jamaica (%)
Place of birth for the foreign-born population - St. Vincent and the Grenadines (%)
Place of birth for the foreign-born population - Trinidad and Tobago (%)
Place of birth for the foreign-born population - West Indies (%)
Place of birth for the foreign-born population - Other Caribbean (%)
Place of birth for the foreign-born population - Belize (%)
Place of birth for the foreign-born population - Costa Rica (%)
Place of birth for the foreign-born population - El Salvador (%)
Place of birth for the foreign-born population - Guatemala (%)
Place of birth for the foreign-born population - Honduras (%)
Place of birth for the foreign-born population - Mexico (%)
Place of birth for the foreign-born population - Nicaragua (%)
Place of birth for the foreign-born population - Panama (%)
Place of birth for the foreign-born population - Other Central America (%)
Place of birth for the foreign-born population - Argentina (%)
Place of birth for the foreign-born population - Bolivia (%)
Place of birth for the foreign-born population - Brazil (%)
Place of birth for the foreign-born population - Chile (%)
Place of birth for the foreign-born population - Colombia (%)
Place of birth for the foreign-born population - Ecuador (%)
Place of birth for the foreign-born population - Guyana (%)
Place of birth for the foreign-born population - Peru (%)
Place of birth for the foreign-born population - Uruguay (%)
Place of birth for the foreign-born population - Venezuela (%)
Place of birth for the foreign-born population - Other South America (%)
Place of birth for the foreign-born population - Canada (%)
Place of birth for the foreign-born population - Other Northern America (%)
Place of birth for the foreign-born population - Other (%)
Latest news about races in Olney, MD collected exclusively by city-data.com from local newspapers, TV, and radio stations
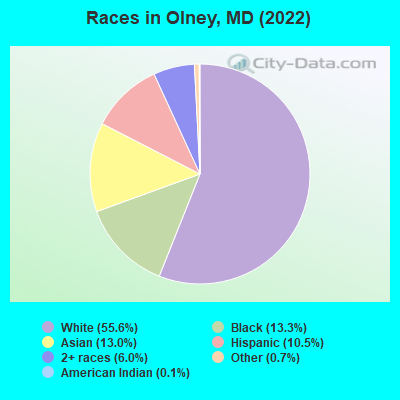
According to 2022 data, the most numerous races in Olney, MD are White alone (19,676 residents), Black alone (4,710 residents), and Hispanic (3,726 residents). 72.5% of Olney residents speak English at home. 23.3% of Olney, MD residents are foreign-born (9.6% born in Asia, 5.8% born in Latin America, 3.5% born in Africa, 2.8% born in Europe), which is 31.2% greater than the foreign-born rate of 16.0% across the entire state of Maryland.
Race distribution in Olney
2000 2022
3,286,547 62.1% White alone 1,464,735 27.7% Black alone 227,916 4.3% Hispanic 209,738 4.0% Asian alone 82,946 1.6% Two or more races 13,312 0.3% American Indian alone 9,379 0.2% Other race alone 1,913 0.04% Native Hawaiian and Other
2,906,492 47.1% White alone 1,800,914 29.2% Black alone 705,842 11.4% Hispanic 401,818 6.5% Asian alone 291,317 4.7% Two or more races 46,930 0.8% Other race alone 8,930 0.1% American Indian alone 2,417 0.04% Native Hawaiian and Other
Income and house value in Olney Median household income in 2022 $160,849 White non-Hispanic householders$104,912 Black householders$120,919 American Indian and Alaska Native householders$178,386 Asian householders$101,171 Some other race householdersover $200,000 Two or more races householders$148,056 Hispanic or Latino race householdersMedian 2022 house value $653,859 White Non-Hispanic householders$558,256 Black or African American householders$728,276 American Indian or Alaska Native householders $643,796 Asian householders$466,361 Some other race householders$392,739 Two or more races householders$595,067 Hispanic or Latino householders
Median age by race in Olney
47.7 Median age for White residents44.8 50.3 42.2 Median age for Black or African American residents44.9 41.2 47.3 Median age for American Indian / Alaska Native residents41.4 52.4 42.8 Median age for Asian residents41.4 45.5 -763,333,332.6 Median age for Native Hawaiian / Pacific Islander residents-720,061,021.4 -760,942,760.2 37.4 Median age for Other race residents33.8 39.8 24.1 Median age for Two or more races residents18.0 27.2 47.1 Median age for White alone residents44.5 49.8 33.6 Median age for Hispanic or Latino residents28.3 35.2
Owner/renter occupied households by race in Olney
House owners and renters - White residents 7,177 92.6% Owner occupied573 7.4% Renter occupiedHouse owners and renters - Black or African American residents 1,217 78.3% Owner occupied336 21.7% Renter occupiedHouse owners and renters - American Indian / Alaska Native residents 30 58.0% Owner occupied22 42.0% Renter occupiedHouse owners and renters - Asian residents 1,348 87.4% Owner occupied194 12.6% Renter occupiedHouse owners and renters - Other race residents 267 72.8% Owner occupied99 27.2% Renter occupiedHouse owners and renters - Two or more races residents 607 94.6% Owner occupied35 5.4% Renter occupiedHouse owners and renters - White alone residents 7,239 92.8% Owner occupied564 7.2% Renter occupiedHouse owners and renters - Hispanic or Latino residents 659 83.0% Owner occupied135 17.0% Renter occupied
Language usage in Olney
English speakers - Total 72.5% of residents of Olney speak English at home.
6.5% of residents speak Spanish at home 1,413 65.0% Speak English very well760 35.0% Speak English less than very well20.3% of residents speak other language at home 5,036 74.1% Speak English very well1,758 25.9% Speak English less than very well
English speakers - Born in the United States 91.1% of residents of Olney speak English at home.
2.9% of residents speak Spanish at home 381 99.0% Speak English very well4 1.0% Speak English less than very well6.4% of residents speak other language at home 722 84.1% Speak English very well137 15.9% Speak English less than very well
English speakers - Native, born elsewhere 76.5% of residents of Olney speak English at home.
6.0% of residents speak Spanish at home 66 98.5% Speak English very well1 1.5% Speak English less than very well12.7% of residents speak other language at home 141 100.0% Speak English very well
English speakers - Foreign-born 22.9% of residents of Olney speak English at home.
16.9% of residents speak Spanish at home 622 45.0% Speak English very well759 55.0% Speak English less than very well59.9% of residents speak other language at home 3,388 69.1% Speak English very well1,513 30.9% Speak English less than very well
White (Caucasian) - Speak only English Native:
96.9% (16,385)Foreign-born:
38.0% (625)
White (Caucasian) - Speak another language Native:
4.3% (722)Foreign-born:
65.8% (1,083)
Black or African American - Speak only English Native:
90.0% (2,660)Foreign-born:
32.0% (498)
Black or African American - Speak another language Native:
9.7% (285)Foreign-born:
65.5% (1,022)
American Indian / Alaska Native - Speak only English Native:
61.9% (47)Foreign-born:
10.2% (8)
Asian - Speak only English Native:
41.4% (588)Foreign-born:
15.0% (445)
Asian - Speak another language Native:
59.7% (848)Foreign-born:
85.1% (2,533)
Other race - Speak only English Native:
56.4% (346)Foreign-born:
9.9% (98)
Other race - Speak another language Native:
52.1% (320)Foreign-born:
89.1% (876)
Two or more races - Speak only English Native:
83.2% (2,357)Foreign-born:
32.0% (221)
Two or more races - Speak another language Native:
12.4% (350)Foreign-born:
69.6% (480)
White alone - Speak only English Native:
95.7% (16,145)Foreign-born:
33.3% (576)
White alone - Speak another language Native:
4.5% (753)Foreign-born:
65.8% (1,138)
Hispanic or Latino - Speak only English Native:
67.4% (1,242)Foreign-born:
7.7% (116)
Hispanic or Latino - Speak another language Native:
36.1% (666)Foreign-born:
92.0% (1,384)
Foreign-born residents in Olney 8,232 residents are foreign born (9.6% Asia , 5.8% Latin America , 3.5% Africa , 2.8% Europe ).
This city:
23.3%Maryland:
15.7%
Marital status for residents in Olney Marital status - White (Caucasian) population 15 years and over
Males 25.6% Never married67.1% Now married1.2% Separated1.3% Widowed4.9% DivorcedFemales 21.1% Never married61.1% Now married0.6% Separated5.9% Widowed11.2% DivorcedWomen who gave birth in the past 12 months Now married:
94.0% (135)Unmarried:
6.0% (9)
Women who did not give birth in the past 12 months Now married:
50.8% (1,805)Unmarried:
49.2% (1,751)
Marital status - Black or African American population 15 years and over
Males 31.7% Never married61.1% Now married0.3% Separated0.5% Widowed6.5% DivorcedFemales 41.6% Never married35.8% Now married5.6% Separated6.7% Widowed10.3% DivorcedWomen who gave birth in the past 12 months Now married:
100.0% (31)Unmarried:
0.0% (0)
Women who did not give birth in the past 12 months Now married:
27.1% (285)Unmarried:
72.9% (768)
Marital status - American Indian / Alaska Native population 15 years and over
Males 61.8% Never married38.2% Now married0.0% Separated0.0% Widowed0.0% DivorcedFemales 26.4% Never married24.1% Now married0.0% Separated14.9% Widowed34.5% DivorcedWomen who did not give birth in the past 12 months Now married:
28.1% (13)Unmarried:
71.9% (34)
Marital status - Asian population 15 years and over
Males 31.1% Never married68.2% Now married0.0% Separated0.0% Widowed0.6% DivorcedFemales 15.8% Never married62.1% Now married0.6% Separated12.0% Widowed9.5% DivorcedWomen who gave birth in the past 12 months Now married:
100.0% (68)Unmarried:
0.0% (0)
Women who did not give birth in the past 12 months Now married:
60.8% (608)Unmarried:
39.2% (391)
Marital status - Other race population 15 years and over
Males 37.0% Never married61.1% Now married1.9% Separated0.0% Widowed0.0% DivorcedFemales 30.1% Never married61.5% Now married0.0% Separated2.0% Widowed6.4% DivorcedWomen who gave birth in the past 12 months Now married:
100.0% (15)Unmarried:
0.0% (0)
Women who did not give birth in the past 12 months Now married:
63.5% (292)Unmarried:
36.5% (168)
Marital status - Two or more races population 15 years and over
Males 51.5% Never married45.5% Now married0.0% Separated1.1% Widowed1.9% DivorcedFemales 45.8% Never married49.7% Now married0.0% Separated2.0% Widowed2.5% DivorcedWomen who gave birth in the past 12 months Now married:
100.0% (16)Unmarried:
0.0% (0)
Women who did not give birth in the past 12 months Now married:
33.1% (240)Unmarried:
66.9% (484)
Marital status - White alone, not Hispanic / Latino population 15 years and over
Males 24.8% Never married67.6% Now married1.2% Separated1.3% Widowed5.0% DivorcedFemales 20.5% Never married61.6% Now married0.6% Separated6.0% Widowed11.4% DivorcedWomen who gave birth in the past 12 months Now married:
94.0% (148)Unmarried:
6.0% (9)
Women who did not give birth in the past 12 months Now married:
50.8% (1,830)Unmarried:
49.2% (1,774)
Marital status - Hispanic or Latino population 15 years and over
Males 40.4% Never married58.2% Now married0.8% Separated0.0% Widowed0.6% DivorcedFemales 29.9% Never married58.2% Now married0.6% Separated5.0% Widowed6.3% DivorcedWomen who gave birth in the past 12 months Now married:
100.0% (12)Unmarried:
0.0% (0)
Women who did not give birth in the past 12 months Now married:
58.1% (500)Unmarried:
41.9% (360)
Ancestries in Olney
1,278 6.6% Irish998 5.2% German888 4.6% American733 3.8% Italian714 3.7% English702 3.6% Ethiopian601 3.1% European581 3.0% Kenyan537 2.8% Russian381 2.0% African373 1.9% Eastern European317 1.6% Polish281 1.5% Iranian256 1.3% Northern European218 1.1% Portuguese184 1.0% Ukrainian171 0.9% Scottish160 0.8% Jamaican147 0.8% Greek141 0.7% Finnish140 0.7% Lithuanian128 0.7% Scotch-Irish110 0.6% British106 0.6% Lebanese89 0.5% Czech86 0.4% Albanian83 0.4% Brazilian71 0.4% Egyptian61 0.3% Swedish53 0.3% Dutch53 0.3% Slovak51 0.3% Hungarian39 0.2% Afghan37 0.2% Trinidadian and Tobagonian36 0.2% Romanian32 0.2% Guyanese30 0.2% Danish29 0.2% Nigerian27 0.1% Jordanian25 0.1% French Canadian24 0.1% West Indian23 0.1% Swiss22 0.1% French16 0.08% Syrian15 0.08% Norwegian15 0.08% Cajun14 0.07% Liberian13 0.07% Cypriot13 0.07% Ghanaian12 0.06% Sierra Leonean12 0.06% U.S. Virgin Islander10 0.05% Armenian10 0.05% Welsh9 0.05% Austrian8 0.04% Scandinavian6 0.03% Palestinian5 0.03% Croatian5 0.03% Moroccan4 0.02% Canadian2 0.01% Israeli
Geographical mobility in Olney Same house 1 year ago 18,238 94.8% White (Caucasian)4,292 91.2% Black or African American174 98.9% American Indian / Alaska Native4,110 89.7% Asian1,415 84.4% Other race3,818 97.0% Two or more races18,439 94.4% White alone, not Hispanic / Latino3,411 92.4% Hispanic or LatinoMoved within same county 692 3.6% White / Caucasian229 4.9% Black or African American245 5.3% Asian201 12.0% Other race61 1.6% Two or more races758 3.9% White alone, not Hispanic / Latino193 5.2% Hispanic or LatinoMoved within same state 119 0.6% White / Caucasian25 0.5% Asian112 0.6% White alone, not Hispanic / Latino23 0.6% Hispanic or LatinoMoved from different state 241 1.3% White / Caucasian15 0.3% Black or African American117 2.6% Asian73 4.4% Other race95 2.4% Two or more races253 1.3% White alone, not Hispanic / Latino73 2.0% Hispanic or LatinoMoved from abroad 83 0.4% White244 5.2% Black or African American11 0.2% Asian18 0.5% Two or more races97 0.5% White alone, not Hispanic / Latino8 0.2% Hispanic or Latino
Children Nativity (place of birth) in Olney
Children under 6 years - Living with two parents Both parents native 1,102 96.5% Native40 3.5% Foreign-bornBoth parents foreign-born 379 100.0% NativeOne native, one foreign-born parent 560 100.0% NativeChildren under 6 years - Living with one parent Native parent 250 100.0% NativeForeign-born parent 18 100.0% NativeChildren 6 to 17 years - Living with two parents Both parents native 2,983 98.9% Native34 1.1% Foreign-bornBoth parents foreign-born 978 92.3% Native82 7.7% Foreign-bornOne native, one foreign-born parent 744 97.1% Native23 2.9% Foreign-bornChildren 6 to 17 years - Living with one parent Native parent 656 100.0% NativeForeign-born parent 307 55.4% Native247 44.6% Foreign-born
Place of birth for residents in Olney
Grandparents responsible for own grandchildren in Olney
Grandparents (30 to 59 years) White / Caucasian 33 80.5% Responsible for grandchildren8 19.5% Not responsible for grandchildrenWhite alone, not Hispanic / Latino 34 71.0% Responsible for grandchildren14 29.0% Not responsible for grandchildrenGrandparents (60 years and over) White / Caucasian 11 6.0% Responsible for grandchildren174 94.0% Not responsible for grandchildrenWhite alone, not Hispanic / Latino 9 4.1% Responsible for grandchildren211 95.9% Not responsible for grandchildren