North Arlington, NJ (New Jersey) Houses and Residents
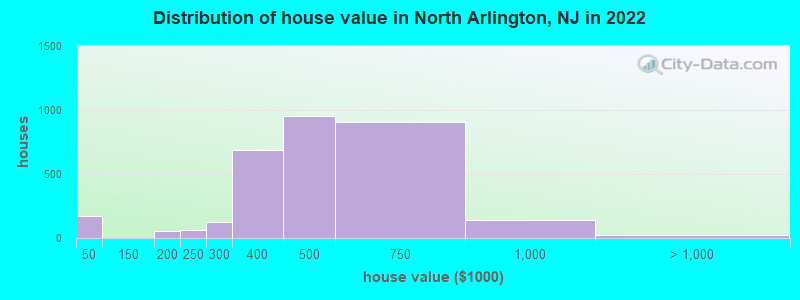
Estimated median house or condo value in 2022: $456,182 (it was $192,300 in 2000 )
North Arlington:
$456,182New Jersey:
$428,900
Lower value quartile - upper value quartile: $361,003 - $544,831Mean price in 2022: Detached houses: $479,561 Here:
$479,561State:
$537,591
Townhouses or other attached units: $516,468 Here:
$516,468State:
$381,113
In 2-unit structures: $524,160 Here:
$524,160State:
$444,476
In 3-to-4-unit structures: $458,599 Here:
$458,599State:
$457,463
In 5-or-more-unit structures: $363,410 Here:
$363,410State:
$368,745
Total population: 15,723 (Urban population: 15,181, Rural population: 0)
Houses: 6,996 (6,675 occupied: 3,152 owner occupied, 3,559 renter occupied )
% of renters here:
53%State:
35%
Housing density: 2,710 houses/condos per square mile
Median price asked for vacant for-sale houses and condos in 2022: $470,914.
Median contract rent in 2022: $1,484 (lower quartile is $1,281, upper quartile is $1,736)
Median rent asked for vacant for-rent units in 2022: $1,731
Median gross rent in North Arlington, NJ in 2022: $1,629
Housing units in North Arlington with a mortgage: 1,981 (351 second mortgage, 0 home equity loan, 362 both second mortgage and home equity loan )Houses without a mortgage: 41
Median household income for houses/condos with a mortgage: $151,658
Median household income for apartments without a mortgage: $81,254
Median monthly housing costs: $1,644
Data:
Median house or condo value ($)
Median house or condo value ($ change since 2000)
Median house or condo value ($) - White
Median house or condo value ($) - Black or African American
Median house or condo value ($) - Asian
Median house or condo value ($) - Hispanic or Latino
Median house or condo value ($) - American Indian and Alaska Native
Median house or condo value ($) - Multirace
Median house or condo value ($) - Other Race
Median price asked for mobile homes ($)
Household density (households per square mile)
Mean house or condo value by units in structure - 1, detached ($)
Mean house or condo value by units in structure - 1, attached ($)
Mean house or condo value by units in structure - 2 ($)
Mean house or condo value by units in structure by units in structure - 3 or 4 ($)
Mean house or condo value by units in structure - 5 or more ($)
Mean house or condo value by units in structure - Boat, RV, van, etc. ($)
Mean house or condo value by units in structure - Mobile home ($)
Median contract rent ($)
Median contract rent - Lower quartile ($)
Median contract rent - Upper quartile ($)
Median gross rent ($)
Urban houses (%)
Rural houses (%)
Houses occupied (%)
Houses occupied (% change since 2000)
Houses owner occupied (%)
Houses owner occupied (% change since 2000)
Houses renter occupied (%)
Houses renter occupied (% change since 2000)
Vacant housing units - For rent (%)
Vacant housing units - For rent (% change since 2000)
Vacant housing units - For sale only (%)
Vacant housing units - For sale only (% change since 2000)
Vacant housing units - Rented or sold, not occupied (%)
Vacant housing units - Rented or sold, not occupied (% change since 2000)
Vacant housing units - For seasonal, recreational, or occasional use (%)
Vacant housing units - For seasonal, recreational, or occasional use (% change since 2000)
Vacant housing units - For migrant workers (%)
Vacant housing units - For migrant workers (% change since 2000)
Vacant housing units - Other vacant (%)
Vacant housing units - Other vacant (% change since 2000)
Median monthly housing costs ($)
Median household income for houses/condos with a mortgage ($)
Median household income for houses/condos without a mortgage ($)
Median household income ($)
Median household income ($) - White
Median household income ($) - Black or African American
Median household income ($) - Asian
Median household income ($) - Hispanic or Latino
Median household income ($) - American Indian and Alaska Native
Median household income ($) - Multirace
Median household income ($) - Other Race
Mortgage status - with mortgage (%)
Mortgage status - with second mortgage (%)
Mortgage status - with home equity loan (%)
Mortgage status - with both second mortgage and home equity loan (%)
Mortgage status - without a mortgage (%)
Median year house/condo built
Median year apartment built
Household type by relationship - Male householder living alone (%)
Household type by relationship - Male householder not living alone (%)
Household type by relationship - Female householder living alone (%)
Household type by relationship - Female householder not living alone (%)
Household type by relationship - Opposite-Sex spouse (%)
Household type by relationship - Same-Sex spouse (%)
Household type by relationship - Opposite-Sex unmarried partner (%)
Household type by relationship - Same-Sex unmarried partner (%)
Household type by relationship - In group quarters (%)
Size of family households - 2-person household (%)
Size of family households - 3-person household (%)
Size of family households - 4-person household (%)
Size of family households - 5-person household (%)
Size of family households - 6-person household (%)
Size of family households - 7-or-more-person household (%)
Size of nonfamily households - 1-person household (%)
Size of nonfamily households - 2-person household (%)
Size of nonfamily households - 3-person household (%)
Size of nonfamily households - 4-person household (%)
Size of nonfamily households - 5-person household (%)
Size of nonfamily households - 6-person household (%)
Size of nonfamily households - 7-or-moreperson household (%)
Year house built - Built 2010 or later (%)
Year house built - Built 2000 to 2009 (%)
Year house built - Built 1990 to 1999 (%)
Year house built - Built 1980 to 1989 (%)
Year house built - Built 1970 to 1979 (%)
Year house built - Built 1960 to 1969 (%)
Year house built - Built 1950 to 1959 (%)
Year house built - Built 1940 to 1949 (%)
Year house built - Built 1939 or earlier (%)
Median number of rooms in houses and condos
Median number of rooms in apartments
Median number of bedrooms in owner occupied houses
Mean number of bedrooms in owner occupied houses
Median number of bedrooms in renter occupied houses
Mean number of bedrooms in renter occupied houses
Median number of vehichles in owner occupied houses
Mean number of vehichles in owner occupied houses
Median number of vehichles in renter occupied houses
Mean number of vehichles in renter occupied houses
Rooms in owner-occupied houses - 1 room (%)
Rooms in owner-occupied houses - 2 rooms (%)
Rooms in owner-occupied houses - 3 rooms (%)
Rooms in owner-occupied houses - 4 rooms (%)
Rooms in owner-occupied houses - 5 rooms (%)
Rooms in owner-occupied houses - 6 rooms (%)
Rooms in owner-occupied houses - 7 rooms (%)
Rooms in owner-occupied houses - 8 rooms (%)
Rooms in owner-occupied houses - 9+ rooms (%)
Rooms in renter-occupied houses - 1 room (%)
Rooms in renter-occupied houses - 2 rooms (%)
Rooms in renter-occupied houses - 3 rooms (%)
Rooms in renter-occupied houses - 4 rooms (%)
Rooms in renter-occupied houses - 5 rooms (%)
Rooms in renter-occupied houses - 6 rooms (%)
Rooms in renter-occupied houses - 7 rooms (%)
Rooms in renter-occupied houses - 8 rooms (%)
Rooms in renter-occupied houses - 9+ rooms (%)
Bedrooms in owner-occupied houses - no bedrooms (%)
Bedrooms in owner-occupied houses - 1 bedroom (%)
Bedrooms in owner-occupied houses - 2 bedrooms (%)
Bedrooms in owner-occupied houses - 3 bedrooms (%)
Bedrooms in owner-occupied houses - 4 bedrooms (%)
Bedrooms in owner-occupied houses - 5+ bedrooms (%)
Bedrooms in renter-occupied houses - no bedrooms (%)
Bedrooms in renter-occupied houses - 1 bedroom (%)
Bedrooms in renter-occupied houses - 2 bedrooms (%)
Bedrooms in renter-occupied houses - 3 bedrooms (%)
Bedrooms in renter-occupied houses - 4 bedrooms (%)
Bedrooms in renter-occupied houses - 5+ bedrooms (%)
Vehicles available in owner-occupied houses - no vehicle available (%)
Vehicles available in owner-occupied houses - 1 vehicle available(%)
Vehicles available in owner-occupied houses - 2 Vehicles available (%)
Vehicles available in owner-occupied houses - 3 Vehicles available (%)
Vehicles available in owner-occupied houses - 4 Vehicles available (%)
Vehicles available in owner-occupied houses - 5+ Vehicles available (%)
Vehicles available in renter-occupied houses - no vehicle available (%)
Vehicles available in renter-occupied houses - 1 vehicle available (%)
Vehicles available in renter-occupied houses - 2 Vehicles available (%)
Vehicles available in renter-occupied houses - 3 Vehicles available (%)
Vehicles available in renter-occupied houses - 4 Vehicles available (%)
Vehicles available in renter-occupied houses - 5+ Vehicles available (%)
Housing units in structures - 1, detached (%)
Housing units in structures - 1, attached (%)
Housing units in structures - 2 (%)
Housing units in structures - 3 or 4 (%)
Housing units in structures - 5 to 9 (%)
Housing units in structures - 10 to 19 (%)
Housing units in structures - 20 to 49 (%)
Housing units in structures - 50 or more (%)
Housing units in structures - Mobile home (%)
Housing units in structures - Boat, RV, van, etc. (%)
Housing units in structures - Owners - 1, detached (%)
Housing units in structures - Owners - 1, attached (%)
Housing units in structures - Owners - 2 (%)
Housing units in structures - Owners - 3 or 4 (%)
Housing units in structures - Owners - 5 to 9 (%)
Housing units in structures - Owners - 10 to 19 (%)
Housing units in structures - Owners - 20 to 49 (%)
Housing units in structures - Owners - 50 or more (%)
Housing units in structures - Owners - Mobile home (%)
Housing units in structures - Owners - Boat, RV, van, etc. (%)
Housing units in structures - Renters - 1, detached (%)
Housing units in structures - Renters - 1, attached (%)
Housing units in structures - Renters - 2 (%)
Housing units in structures - Renters - 3 or 4 (%)
Housing units in structures - Renters - 5 to 9 (%)
Housing units in structures - Renters - 10 to 19 (%)
Housing units in structures - Renters - 20 to 49 (%)
Housing units in structures - Renters - 50 or more (%)
Housing units in structures - Renters - Mobile home (%)
Housing units in structures - Renters - Boat, RV, van, etc. (%)
House/condo owner moved in on average (years ago)
Renter moved in on average (years ago)
Year householder moved into unit - Moved in 1999 to March 2000 (%)
Year householder moved into unit - Moved in 1999 to March 2000 (%) - White
Year householder moved into unit - Moved in 1999 to March 2000 (%) - Black or African American
Year householder moved into unit - Moved in 1999 to March 2000 (%) - Asian
Year householder moved into unit - Moved in 1999 to March 2000 (%) - Hispanic or Latino
Year householder moved into unit - Moved in 1999 to March 2000 (%) - American Indian and Alaska Native
Year householder moved into unit - Moved in 1999 to March 2000 (%) - Multirace
Year householder moved into unit - Moved in 1999 to March 2000 (%) - Other Race
Year householder moved into unit - Moved in 1995 to 1998 (%)
Year householder moved into unit - Moved in 1995 to 1998 (%) - White
Year householder moved into unit - Moved in 1995 to 1998 (%) - Black or African American
Year householder moved into unit - Moved in 1995 to 1998 (%) - Asian
Year householder moved into unit - Moved in 1995 to 1998 (%) - Hispanic or Latino
Year householder moved into unit - Moved in 1995 to 1998 (%) - American Indian and Alaska Native
Year householder moved into unit - Moved in 1995 to 1998 (%) - Multirace
Year householder moved into unit - Moved in 1995 to 1998 (%) - Other Race
Year householder moved into unit - Moved in 1990 to 1994 (%)
Year householder moved into unit - Moved in 1990 to 1994 (%) - White
Year householder moved into unit - Moved in 1990 to 1994 (%) - Black or African American
Year householder moved into unit - Moved in 1990 to 1994 (%) - Asian
Year householder moved into unit - Moved in 1990 to 1994 (%) - Hispanic or Latino
Year householder moved into unit - Moved in 1990 to 1994 (%) - American Indian and Alaska Native
Year householder moved into unit - Moved in 1990 to 1994 (%) - Multirace
Year householder moved into unit - Moved in 1990 to 1994 (%) - Other Race
Year householder moved into unit - Moved in 1980 to 1989 (%)
Year householder moved into unit - Moved in 1980 to 1989 (%) - White
Year householder moved into unit - Moved in 1980 to 1989 (%) - Black or African American
Year householder moved into unit - Moved in 1980 to 1989 (%) - Asian
Year householder moved into unit - Moved in 1980 to 1989 (%) - Hispanic or Latino
Year householder moved into unit - Moved in 1980 to 1989 (%) - American Indian and Alaska Native
Year householder moved into unit - Moved in 1980 to 1989 (%) - Multirace
Year householder moved into unit - Moved in 1980 to 1989 (%) - Other Race
Year householder moved into unit - Moved in 1970 to 1979 (%)
Year householder moved into unit - Moved in 1970 to 1979 (%) - White
Year householder moved into unit - Moved in 1970 to 1979 (%) - Black or African American
Year householder moved into unit - Moved in 1970 to 1979 (%) - Asian
Year householder moved into unit - Moved in 1970 to 1979 (%) - Hispanic or Latino
Year householder moved into unit - Moved in 1970 to 1979 (%) - American Indian and Alaska Native
Year householder moved into unit - Moved in 1970 to 1979 (%) - Multirace
Year householder moved into unit - Moved in 1970 to 1979 (%) - Other Race
Year householder moved into unit - Moved in 1969 or earlier (%)
Year householder moved into unit - Moved in 1969 or earlier (%) - White
Year householder moved into unit - Moved in 1969 or earlier (%) - Black or African American
Year householder moved into unit - Moved in 1969 or earlier (%) - Asian
Year householder moved into unit - Moved in 1969 or earlier (%) - Hispanic or Latino
Year householder moved into unit - Moved in 1969 or earlier (%) - American Indian and Alaska Native
Year householder moved into unit - Moved in 1969 or earlier (%) - Multirace
Year householder moved into unit - Moved in 1969 or earlier (%) - Other Race
Housing units lacking complete plumbing facilities (%)
Housing units lacking complete kitchen facilities (%)
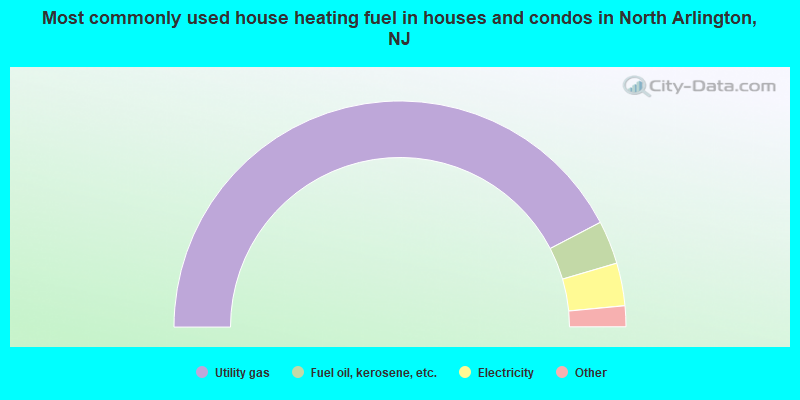
House heating fuel used in houses and condos - Utility gas (%)
House heating fuel used in houses and condos - Bottled, tank, or LP gas (%)
House heating fuel used in houses and condos - Electricity (%)
House heating fuel used in houses and condos - Fuel oil, kerosene, etc. (%)
House heating fuel used in houses and condos - Coal or coke (%)
House heating fuel used in houses and condos - Wood (%)
House heating fuel used in houses and condos - Solar energy (%)
House heating fuel used in houses and condos - Other fuel (%)
House heating fuel used in houses and condos - No fuel used (%)
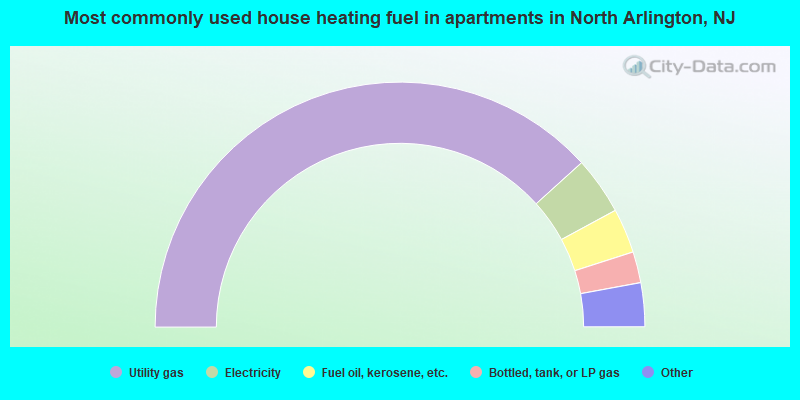
House heating fuel used in apartments - Utility gas (%)
House heating fuel used in apartments - Bottled, tank, or LP gas (%)
House heating fuel used in apartments - Electricity (%)
House heating fuel used in apartments - Fuel oil, kerosene, etc. (%)
House heating fuel used in apartments - Coal or coke (%)
House heating fuel used in apartments - Wood (%)
House heating fuel used in apartments - Solar energy (%)
House heating fuel used in apartments - Other fuel (%)
House heating fuel used in apartments - No fuel used (%)
Median year house/condo built: 1952Median year apartment built: 1959Household type by relationship:
Households: 16,347
Male householders: 3,185 (581 living alone ), Female householders: 3,447 (1,023 living alone )3,771 spouses (3,730 opposite-sex spouses ), 370 unmarried partners , (360 opposite-sex unmarried partners ), 4,464 children (4,301 natural , 50 adopted , 111 stepchildren ), 72 grandchildren , 46 brothers or sisters , 545 parents , 0 foster children , 222 other relatives , 204 non-relatives In group quarters: 14
Size of family households: 2,069 2-persons , 1,521 3-persons , 733 4-persons , 334 5-persons , 104 6-persons .
Size of nonfamily households: 1,659 1-person , 291 2-persons .
2,045 married couples with children. single-parent households (58 men , 604 women ).
49.3% of residents of North Arlington speak English at home. of residents speak Spanish at home (63% speak English very well , 26% speak English well , 5% speak English not well , 6% don't speak English at all ).of residents speak other Indo-European language at home (58% speak English very well , 29% speak English well , 12% speak English not well ).of residents speak Asian or Pacific Island language at home (57% speak English very well , 36% speak English well , 6% speak English not well ).of residents speak other language at home (39% speak English very well , 49% speak English well , 6% speak English not well , 5% don't speak English at all ).
Foreign born population: 5,381 (32.9%)of them are naturalized citizens )
Median number of rooms in houses and condos:
Median number of rooms in apartments
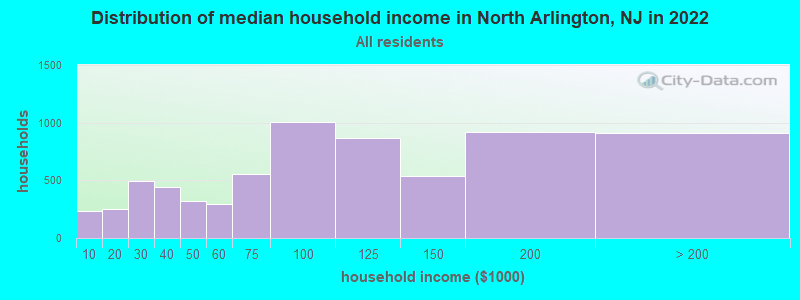
North Arlington, NJ household income distribution 237 Less than $10,000248 $10,000 to $19,999491 $20,000 to $29,999439 $30,000 to $39,999325 $40,000 to $49,999291 $50,000 to $59,999559 $60,000 to $74,9991,007 $75,000 to $99,999872 $100,000 to $124,999540 $125,000 to $149,999917 $150,000 to $199,999913 $200,000 or more
Home value of owner - occupied houses in 2022 in North Arlington, NJ 105 Less than $10,00068 $30,000 to $34,99916 $150,000 to $174,99941 $175,000 to $199,99961 $200,000 to $249,999128 $250,000 to $299,999690 $300,000 to $399,999954 $400,000 to $499,999908 $500,000 to $749,999137 $750,000 to $999,99922 $2,000,000 or moreRent paid by renters in 2022 in North Arlington, NJ 4 $100 to $1499 $500 to $54915 $550 to $59929 $800 to $89941 $900 to $999605 $1,000 to $1,2491,063 $1,250 to $1,4991,621 $1,500 to $1,99962 $2,000 to $2,49970 No cash rent
Percentage of workers working in this county: 42.6%Number of people working at home: 970 (10.9% of all workers )
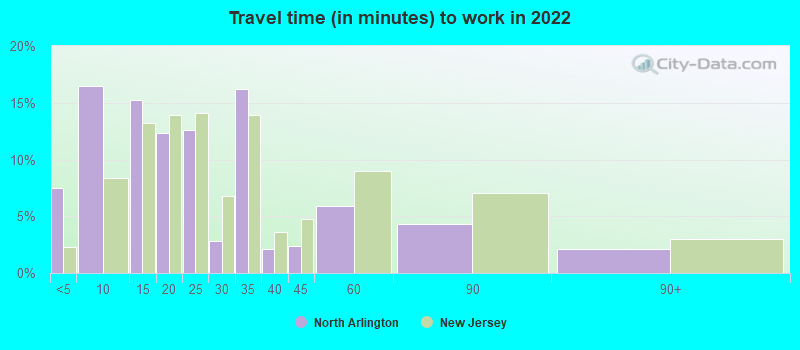
Travel time to work (commute)
Less than 5 minutes: 2405 to 9 minutes: 42110 to 14 minutes: 41715 to 19 minutes: 88720 to 24 minutes: 1,25325 to 29 minutes: 40530 to 34 minutes: 1,15735 to 39 minutes: 24640 to 44 minutes: 48045 to 59 minutes: 1,02260 to 89 minutes: 71390 or more minutes: 370
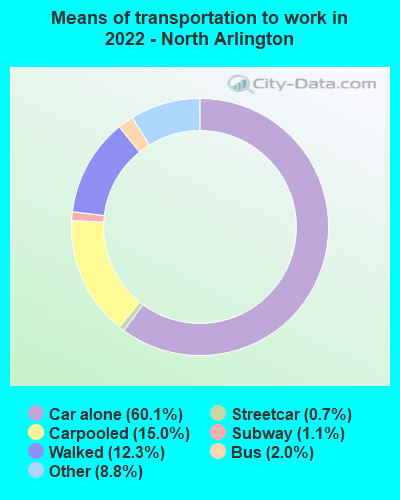
Means of transportation to work:
Drove a car alone: 1,536 (43.9%)Carpooled: 461 (13.2%)Bus : 47 (1.3%)Subway or elevated rail : 15 (0.4%)Long-distance train or commuter rail : 16 (0.5%)Taxi: 256 (7.3%)Walked: 336 (9.6%)Worked at home: 970 (27.7%)
Unemployment by race in 2022
Unemployment rate for White non-Hispanic residents 5.6% Males2.9% FemalesUnemployment rate for Black residents 1.1% MalesUnemployment rate for Asian residents 5.4% MalesUnemployment rate for other race residents 3.5% Males5.3% FemalesUnemployment rate for two or more race residents 2.9% Males7.8% FemalesUnemployment rate for Hispanic or Latino residents 3.9% Males7.5% Females
Year of entry for the foreign-born population in North Arlington, New Jersey
1,383 2010 or later 1,181 2000 to 2009 1,087 1990 to 1999 770 1980 to 1989 565 1970 to 1979 1,088 Before 1970
First ancestries reported:
Italian: 953 (10.3%)
Polish: 944 (10.2%)
Portuguese: 809 (8.7%)
Irish: 531 (5.7%)
Brazilian: 227 (2.5%)
American: 208 (2.2%)
Egyptian: 192 (2.1%)
European: 143 (1.5%)
Turkish: 132 (1.4%)
Dutch: 69 (0.7%)
Scottish: 58 (0.6%)
Moroccan: 46 (0.5%)
British: 41 (0.4%)
Greek: 33 (0.4%)
Iranian: 27 (0.3%)
Eastern European: 26 (0.3%)
German: 22 (0.2%)
Russian: 22 (0.2%)
French: 20 (0.2%)
Scotch-Irish: 19 (0.2%)
Lebanese: 17 (0.2%)
Lithuanian: 14 (0.2%)
English: 1 (0.01%) Most common places of birth for foreign-born residents (%): Portugal North Arlington:
15.5% (834)New Jersey:
1.3% (28,871)
Ecuador North Arlington:
12.7% (686)New Jersey:
4.4% (95,275)
Colombia North Arlington:
7.3% (395)New Jersey:
4.2% (90,817)
Italy North Arlington:
6.2% (331)New Jersey:
1.5% (33,198)
Turkey North Arlington:
6.0% (324)New Jersey:
0.8% (16,778)
Brazil North Arlington:
5.8% (310)New Jersey:
2.1% (46,020)
Cuba North Arlington:
5.6% (299)New Jersey:
2.1% (45,435)
Dominican Republic North Arlington:
5.5% (298)New Jersey:
9.7% (209,055)
Peru North Arlington:
5.1% (274)New Jersey:
2.7% (58,563)
Poland North Arlington:
4.6% (245)New Jersey:
2.3% (48,811)
India North Arlington:
4.2% (228)New Jersey:
12.8% (274,609)
Philippines North Arlington:
3.7% (200)New Jersey:
4.0% (85,934)
Egypt North Arlington:
2.3% (125)New Jersey:
1.6% (33,678)
Guatemala North Arlington:
2.2% (120)New Jersey:
2.2% (46,813)
Morocco North Arlington:
2.0% (106)New Jersey:
0.3% (5,621)
Spain North Arlington:
2.0% (106)New Jersey:
0.5% (10,246)
Place of birth for U.S.-born residents:
This state: 8,518Other state: 2,029Northeast: 1,716Midwest: 40South: 148West: 130 91.2% of North Arlington residents lived in the same house 1 years ago.
Out of people who lived in different houses, 26.4% lived in this county.
Out of people who lived in different counties, 82.0% lived in New Jersey.
North Arlington:
91.2%State average:
90.4%
Education attainment for males 25 years and older:
No schooling: 68Nursery to 4th grade: 335th and 6th grade: 937th and 8th grade: 859th grade: 2710th grade: 2411th grade: 2412th grade, no diploma: 7High school graduate (or equivalency): 1,677Less than 1 year of college: 473Some college more than 1 year, no degree: 940Associate degree: 344Bachelor's degree: 1,352Master's degree: 526Professional school degree: 47Doctorate degree: 50
Education attainment for females 25 years and older:
No schooling: 167Nursery to 4th grade: 115th and 6th grade: 957th and 8th grade: 879th grade: 010th grade: 2711th grade: 1112th grade, no diploma: 63High school graduate (or equivalency): 1,894Less than 1 year of college: 244Some college more than 1 year, no degree: 732Associate degree: 622Bachelor's degree: 1,425Master's degree: 835Professional school degree: 254Doctorate degree: 0
Housing units in structures:
One, detached: 2,755One, attached: 292Two: 1,8963 or 4: 9605 to 9: 35210 to 19: 49120 to 49: 10050 or more: 147Housing units lacking complete plumbing facilities in 2022: 1.1%Housing units lacking complete kitchen facilities in 2022: 1.7%House/condo owner moved in on average 19 years ago
Renter moved in on average 3 years ago
Private vs. public school enrollment:
Students in private schools in grades 1 to 8 (elementary and middle school): 91 Here:
9.3%New Jersey:
12.3%
Students in private schools in grades 9 to 12 (high school): 29 Here:
4.0%New Jersey:
13.1%
Students in private undergraduate colleges: 392 Here:
44.4%New Jersey:
33.2%