Races in North Arlington, New Jersey (NJ) Detailed Stats
Data:
Races - White alone (%)
Races - White alone (% change since 2000)
Races - Black alone (%)
Races - Black alone (% change since 2000)
Races - American Indian alone (%)
Races - American Indian alone (% change since 2000)
Races - Asian alone (%)
Races - Asian alone (% change since 2000)
Races - Hispanic (%)
Races - Hispanic (% change since 2000)
Races - Native Hawaiian and Other Pacific Islander alone (%)
Races - Native Hawaiian and Other Pacific Islander alone (% change since 2000)
Races - Two or more races(%)
Races - Two or more races(% change since 2000)
Races - Other race alone (%)
Races - Other race alone (% change since 2000)
Racial diversity
Place of birth - Born in state of residence (%)
Place of birth - Born in state of residence (%) - White
Place of birth - Born in state of residence (%) - Black or African American
Place of birth - Born in state of residence (%) - Asian
Place of birth - Born in state of residence (%) - Hispanic or Latino
Place of birth - Born in state of residence (%) - American Indian and Alaska Native
Place of birth - Born in state of residence (%) - Multirace
Place of birth - Born in state of residence (%) - Other Race
Place of birth - Born in other state (%)
Place of birth - Born in other state (%) - White
Place of birth - Born in other state (%) - Black or African American
Place of birth - Born in other state (%) - Asian
Place of birth - Born in other state (%) - Hispanic or Latino
Place of birth - Born in other state (%) - American Indian and Alaska Native
Place of birth - Born in other state (%) - Multirace
Place of birth - Born in other state (%) - Other Race
Place of birth - Native, outside of US (%)
Place of birth - Native, outside of US (%) - White
Place of birth - Native, outside of US (%) - Black or African American
Place of birth - Native, outside of US (%) - Asian
Place of birth - Native, outside of US (%) - Hispanic or Latino
Place of birth - Native, outside of US (%) - American Indian and Alaska Native
Place of birth - Native, outside of US (%) - Multirace
Place of birth - Native, outside of US (%) - Other Race
Place of birth - Foreign born (%)
Place of birth - Foreign born (%) - White
Place of birth - Foreign born (%) - Black or African American
Place of birth - Foreign born (%) - Asian
Place of birth - Foreign born (%) - Hispanic or Latino
Place of birth - Foreign born (%) - American Indian and Alaska Native
Place of birth - Foreign born (%) - Multirace
Place of birth - Foreign born (%) - Other Race
Residents speaking English at home (%)
Residents speaking English at home - Born in the United States (%)
Residents speaking English at home - Native, born elsewhere (%)
Residents speaking English at home - Foreign born (%)
Residents speaking Spanish at home (%)
Residents speaking Spanish at home - Born in the United States (%)
Residents speaking Spanish at home - Native, born elsewhere (%)
Residents speaking Spanish at home - Foreign born (%)
Residents speaking other language at home (%)
Residents speaking other language at home - Born in the United States (%)
Residents speaking other language at home - Native, born elsewhere (%)
Residents speaking other language at home - Foreign born (%)
Marital status - Never married (%)
Marital status - Now married (%)
Marital status - Separated (%)
Marital status - Widowed (%)
Marital status - Divorced (%)
Ancestries Reported - Arab (%)
Ancestries Reported - Czech (%)
Ancestries Reported - Danish (%)
Ancestries Reported - Dutch (%)
Ancestries Reported - English (%)
Ancestries Reported - French (%)
Ancestries Reported - French Canadian (%)
Ancestries Reported - German (%)
Ancestries Reported - Greek (%)
Ancestries Reported - Hungarian (%)
Ancestries Reported - Irish (%)
Ancestries Reported - Italian (%)
Ancestries Reported - Lithuanian (%)
Ancestries Reported - Norwegian (%)
Ancestries Reported - Polish (%)
Ancestries Reported - Portuguese (%)
Ancestries Reported - Russian (%)
Ancestries Reported - Scotch-Irish (%)
Ancestries Reported - Scottish (%)
Ancestries Reported - Slovak (%)
Ancestries Reported - Subsaharan African (%)
Ancestries Reported - Swedish (%)
Ancestries Reported - Swiss (%)
Ancestries Reported - Ukrainian (%)
Ancestries Reported - United States (%)
Ancestries Reported - Welsh (%)
Ancestries Reported - West Indian (%)
Ancestries Reported - Other (%)
Geographical mobility - Same house 1 year ago (%)
Geographical mobility - Same house 1 year ago (%) - White
Geographical mobility - Same house 1 year ago (%) - Black or African American
Geographical mobility - Same house 1 year ago (%) - Asian
Geographical mobility - Same house 1 year ago (%) - Hispanic or Latino
Geographical mobility - Same house 1 year ago (%) - American Indian and Alaska Native
Geographical mobility - Same house 1 year ago (%) - Multirace
Geographical mobility - Same house 1 year ago (%) - Other Race
Geographical mobility - Moved within same county (%)
Geographical mobility - Moved within same county (%) - White
Geographical mobility - Moved within same county (%) - Black or African American
Geographical mobility - Moved within same county (%) - Asian
Geographical mobility - Moved within same county (%) - Hispanic or Latino
Geographical mobility - Moved within same county (%) - American Indian and Alaska Native
Geographical mobility - Moved within same county (%) - Multirace
Geographical mobility - Moved within same county (%) - Other Race
Geographical mobility - Moved from different county within same state (%)
Geographical mobility - Moved from different county within same state (%) - White
Geographical mobility - Moved from different county within same state (%) - Black or African American
Geographical mobility - Moved from different county within same state (%) - Asian
Geographical mobility - Moved from different county within same state (%) - Hispanic or Latino
Geographical mobility - Moved from different county within same state (%) - American Indian and Alaska Native
Geographical mobility - Moved from different county within same state (%) - Multirace
Geographical mobility - Moved from different county within same state (%) - Other Race
Geographical mobility - Moved from different state (%)
Geographical mobility - Moved from different state (%) - White
Geographical mobility - Moved from different state (%) - Black or African American
Geographical mobility - Moved from different state (%) - Asian
Geographical mobility - Moved from different state (%) - Hispanic or Latino
Geographical mobility - Moved from different state (%) - American Indian and Alaska Native
Geographical mobility - Moved from different state (%) - Multirace
Geographical mobility - Moved from different state (%) - Other Race
Geographical mobility - Moved from abroad (%)
Geographical mobility - Moved from abroad (%) - White
Geographical mobility - Moved from abroad (%) - Black or African American
Geographical mobility - Moved from abroad (%) - Asian
Geographical mobility - Moved from abroad (%) - Hispanic or Latino
Geographical mobility - Moved from abroad (%) - American Indian and Alaska Native
Geographical mobility - Moved from abroad (%) - Multirace
Geographical mobility - Moved from abroad (%) - Other Race
Place of birth for the foreign-born population - Ireland (%)
Place of birth for the foreign-born population - Denmark (%)
Place of birth for the foreign-born population - Norway (%)
Place of birth for the foreign-born population - Sweden (%)
Place of birth for the foreign-born population - United Kingdom (%)
Place of birth for the foreign-born population - England (%)
Place of birth for the foreign-born population - Scotland (%)
Place of birth for the foreign-born population - Other Northern Europe (%)
Place of birth for the foreign-born population - Austria (%)
Place of birth for the foreign-born population - Belgium (%)
Place of birth for the foreign-born population - France (%)
Place of birth for the foreign-born population - Germany (%)
Place of birth for the foreign-born population - Netherlands (%)
Place of birth for the foreign-born population - Switzerland (%)
Place of birth for the foreign-born population - Other Western Europe (%)
Place of birth for the foreign-born population - Greece (%)
Place of birth for the foreign-born population - Italy (%)
Place of birth for the foreign-born population - Portugal (%)
Place of birth for the foreign-born population - Spain (%)
Place of birth for the foreign-born population - Other Southern Europe (%)
Place of birth for the foreign-born population - Albania (%)
Place of birth for the foreign-born population - Belarus (%)
Place of birth for the foreign-born population - Bosnia and Herzegovina (%)
Place of birth for the foreign-born population - Bulgaria (%)
Place of birth for the foreign-born population - Croatia (%)
Place of birth for the foreign-born population - Czechoslovakia (%)
Place of birth for the foreign-born population - Hungary (%)
Place of birth for the foreign-born population - Latvia (%)
Place of birth for the foreign-born population - Lithuania (%)
Place of birth for the foreign-born population - North Macedonia (Macedonia) (%)
Place of birth for the foreign-born population - Moldova (%)
Place of birth for the foreign-born population - Poland (%)
Place of birth for the foreign-born population - Romania (%)
Place of birth for the foreign-born population - Russia (%)
Place of birth for the foreign-born population - Serbia (%)
Place of birth for the foreign-born population - Ukraine (%)
Place of birth for the foreign-born population - Other Eastern Europe (%)
Place of birth for the foreign-born population - China (%)
Place of birth for the foreign-born population - Hong Kong (%)
Place of birth for the foreign-born population - Taiwan (%)
Place of birth for the foreign-born population - Japan (%)
Place of birth for the foreign-born population - Korea (%)
Place of birth for the foreign-born population - Other Eastern Asia (%)
Place of birth for the foreign-born population - Afghanistan (%)
Place of birth for the foreign-born population - Bangladesh (%)
Place of birth for the foreign-born population - India (%)
Place of birth for the foreign-born population - Iran (%)
Place of birth for the foreign-born population - Kazakhstan (%)
Place of birth for the foreign-born population - Nepal (%)
Place of birth for the foreign-born population - Pakistan (%)
Place of birth for the foreign-born population - Sri Lanka (%)
Place of birth for the foreign-born population - Uzbekistan (%)
Place of birth for the foreign-born population - Other South Central Asia (%)
Place of birth for the foreign-born population - Burma (%)
Place of birth for the foreign-born population - Cambodia (%)
Place of birth for the foreign-born population - Indonesia (%)
Place of birth for the foreign-born population - Laos (%)
Place of birth for the foreign-born population - Malaysia (%)
Place of birth for the foreign-born population - Philippines (%)
Place of birth for the foreign-born population - Singapore (%)
Place of birth for the foreign-born population - Thailand (%)
Place of birth for the foreign-born population - Vietnam (%)
Place of birth for the foreign-born population - Other South Eastern Asia (%)
Place of birth for the foreign-born population - Armenia (%)
Place of birth for the foreign-born population - Iraq (%)
Place of birth for the foreign-born population - Israel (%)
Place of birth for the foreign-born population - Jordan (%)
Place of birth for the foreign-born population - Kuwait (%)
Place of birth for the foreign-born population - Lebanon (%)
Place of birth for the foreign-born population - Saudi Arabia (%)
Place of birth for the foreign-born population - Syria (%)
Place of birth for the foreign-born population - Turkey (%)
Place of birth for the foreign-born population - Yemen (%)
Place of birth for the foreign-born population - Other Western Asia (%)
Place of birth for the foreign-born population - Eritrea (%)
Place of birth for the foreign-born population - Ethiopia (%)
Place of birth for the foreign-born population - Kenya (%)
Place of birth for the foreign-born population - Somalia (%)
Place of birth for the foreign-born population - Uganda (%)
Place of birth for the foreign-born population - Zimbabwe (%)
Place of birth for the foreign-born population - Other Eastern Africa (%)
Place of birth for the foreign-born population - Cameroon (%)
Place of birth for the foreign-born population - Congo (%)
Place of birth for the foreign-born population - Democratic Republic of Congo (Zaire) (%)
Place of birth for the foreign-born population - Other Middle Africa (%)
Place of birth for the foreign-born population - Egypt (%)
Place of birth for the foreign-born population - Morocco (%)
Place of birth for the foreign-born population - Sudan (%)
Place of birth for the foreign-born population - Other Northern Africa (%)
Place of birth for the foreign-born population - South Africa (%)
Place of birth for the foreign-born population - Other Southern Africa (%)
Place of birth for the foreign-born population - Cabo Verde (%)
Place of birth for the foreign-born population - Ghana (%)
Place of birth for the foreign-born population - Liberia (%)
Place of birth for the foreign-born population - Nigeria (%)
Place of birth for the foreign-born population - Senegal (%)
Place of birth for the foreign-born population - Sierra Leone (%)
Place of birth for the foreign-born population - Other Western Africa (%)
Place of birth for the foreign-born population - Australia (%)
Place of birth for the foreign-born population - New Zealand (%)
Place of birth for the foreign-born population - Fiji (%)
Place of birth for the foreign-born population - Micronesia (%)
Place of birth for the foreign-born population - Bahamas (%)
Place of birth for the foreign-born population - Barbados (%)
Place of birth for the foreign-born population - Cuba (%)
Place of birth for the foreign-born population - Dominica (%)
Place of birth for the foreign-born population - Dominican Republic (%)
Place of birth for the foreign-born population - Grenada (%)
Place of birth for the foreign-born population - Haiti (%)
Place of birth for the foreign-born population - Jamaica (%)
Place of birth for the foreign-born population - St. Vincent and the Grenadines (%)
Place of birth for the foreign-born population - Trinidad and Tobago (%)
Place of birth for the foreign-born population - West Indies (%)
Place of birth for the foreign-born population - Other Caribbean (%)
Place of birth for the foreign-born population - Belize (%)
Place of birth for the foreign-born population - Costa Rica (%)
Place of birth for the foreign-born population - El Salvador (%)
Place of birth for the foreign-born population - Guatemala (%)
Place of birth for the foreign-born population - Honduras (%)
Place of birth for the foreign-born population - Mexico (%)
Place of birth for the foreign-born population - Nicaragua (%)
Place of birth for the foreign-born population - Panama (%)
Place of birth for the foreign-born population - Other Central America (%)
Place of birth for the foreign-born population - Argentina (%)
Place of birth for the foreign-born population - Bolivia (%)
Place of birth for the foreign-born population - Brazil (%)
Place of birth for the foreign-born population - Chile (%)
Place of birth for the foreign-born population - Colombia (%)
Place of birth for the foreign-born population - Ecuador (%)
Place of birth for the foreign-born population - Guyana (%)
Place of birth for the foreign-born population - Peru (%)
Place of birth for the foreign-born population - Uruguay (%)
Place of birth for the foreign-born population - Venezuela (%)
Place of birth for the foreign-born population - Other South America (%)
Place of birth for the foreign-born population - Canada (%)
Place of birth for the foreign-born population - Other Northern America (%)
Place of birth for the foreign-born population - Other (%)
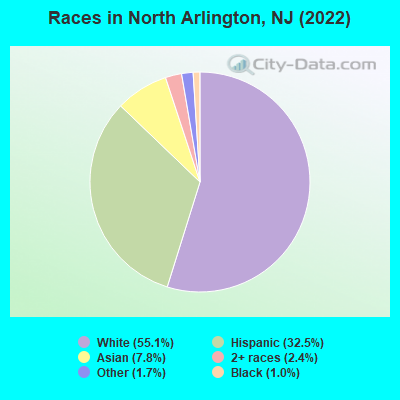
According to 2022 data, the most numerous races in North Arlington, NJ are White alone (9,012 residents), Hispanic (5,320 residents), and Black alone (156 residents). 49.3% of North Arlington residents speak English at home. 32.9% of North Arlington, NJ residents are foreign-born (13.9% born in Latin America, 10.4% born in Europe, 6.3% born in Asia), which is 30.1% greater than the foreign-born rate of 23.0% across the entire state of New Jersey.
Race distribution in North Arlington
2000 2022
5,557,209 66.0% White alone 1,117,191 13.3% Hispanic 1,096,171 13.0% Black alone 477,012 5.7% Asian alone 133,689 1.6% Two or more races 19,565 0.2% Other race alone 11,338 0.1% American Indian alone 2,175 0.03% Native Hawaiian and Other
4,766,476 51.5% White alone 2,028,470 21.9% Hispanic 1,111,632 12.0% Black alone 923,546 10.0% Asian alone 332,237 3.6% Two or more races 89,847 1.0% Other race alone 8,557 0.09% American Indian alone 934 0.01% Native Hawaiian and Other
Income and house value in North Arlington Median household income in 2022 $94,331 White non-Hispanic householders$173,130 Black householders$104,186 Asian householders$61,285 Some other race householders$62,545 Two or more races householders$94,328 Hispanic or Latino race householdersMedian 2022 house value $432,696 White Non-Hispanic householders$652,366 Black or African American householders $428,901 Asian householders$394,029 Some other race householders$533,754 Two or more races householders$467,568 Hispanic or Latino householders
Median age by race in North Arlington
43.5 Median age for White residents43.1 43.9 32.1 Median age for Black or African American residents37.4 30.7 -766,197,182.3 Median age for American Indian / Alaska Native residents-686,322,685.6 -753,722,794.2 37.5 Median age for Asian residents37.2 38.7 -510,460,250.5 Median age for Native Hawaiian / Pacific Islander residents-514,767,932.0 -713,070,378.3 35.2 Median age for Other race residents32.2 37.2 47.6 Median age for Two or more races residents51.8 43.4 43.6 Median age for White alone residents46.6 41.7 39.5 Median age for Hispanic or Latino residents36.2 46.2
Owner/renter occupied households by race in North Arlington
House owners and renters - White residents 2,464 55.0% Owner occupied2,019 45.0% Renter occupiedHouse owners and renters - Black or African American residents 114 100.0% Renter occupiedHouse owners and renters - American Indian / Alaska Native residents 25 100.0% Renter occupiedHouse owners and renters - Asian residents 219 42.4% Owner occupied297 57.6% Renter occupiedHouse owners and renters - Other race residents 267 36.6% Owner occupied462 63.4% Renter occupiedHouse owners and renters - Two or more races residents 222 27.6% Owner occupied583 72.4% Renter occupiedHouse owners and renters - White alone residents 2,222 54.4% Owner occupied1,862 45.6% Renter occupiedHouse owners and renters - Hispanic or Latino residents 718 37.3% Owner occupied1,205 62.7% Renter occupied
Language usage in North Arlington
English speakers - Total 49.3% of residents of North Arlington speak English at home.
27.6% of residents speak Spanish at home 2,742 63.9% Speak English very well1,548 36.1% Speak English less than very well23.8% of residents speak other language at home 2,091 56.5% Speak English very well1,609 43.5% Speak English less than very well
English speakers - Born in the United States 60.5% of residents of North Arlington speak English at home.
24.8% of residents speak Spanish at home 469 95.7% Speak English very well21 4.3% Speak English less than very well17.5% of residents speak other language at home 344 99.1% Speak English very well3 0.9% Speak English less than very well
English speakers - Native, born elsewhere 15.4% of residents of North Arlington speak English at home.
91.1% of residents speak Spanish at home 266 89.9% Speak English very well30 10.1% Speak English less than very well
English speakers - Foreign-born 4.8% of residents of North Arlington speak English at home.
44.9% of residents speak Spanish at home 1,120 46.5% Speak English very well1,289 53.5% Speak English less than very well51.0% of residents speak other language at home 1,249 45.6% Speak English very well1,490 54.4% Speak English less than very well
White (Caucasian) - Speak only English Native:
82.7% (6,214)Foreign-born:
5.9% (126)
White (Caucasian) - Speak another language Native:
15.5% (1,168)Foreign-born:
90.4% (1,936)
Black or African American - Speak only English Native:
81.9% (183)Foreign-born:
100.0% (15)
Asian - Speak only English Native:
96.3% (335)Foreign-born:
12.0% (90)
Asian - Speak another language Native:
6.1% (21)Foreign-born:
88.0% (663)
Other race - Speak only English Native:
17.6% (172)Foreign-born:
1.1% (16)
Other race - Speak another language Native:
84.7% (825)Foreign-born:
100.0% (1,397)
Two or more races - Speak another language Native:
66.7% (755)Foreign-born:
100.0% (1,225)
White alone - Speak only English Native:
88.3% (5,820)Foreign-born:
3.3% (66)
White alone - Speak another language Native:
11.5% (756)Foreign-born:
97.3% (1,930)
Hispanic or Latino - Speak only English Native:
32.7% (912)Foreign-born:
4.5% (106)
Hispanic or Latino - Speak another language Native:
68.5% (1,909)Foreign-born:
94.8% (2,256)
Foreign-born residents in North Arlington 5,381 residents are foreign born (13.9% Latin America , 10.4% Europe , 6.3% Asia ).
This city:
32.9%New Jersey:
23.2%
Marital status for residents in North Arlington Marital status - White (Caucasian) population 15 years and over
Males 35.3% Never married54.6% Now married0.7% Separated2.6% Widowed6.7% DivorcedFemales 26.5% Never married52.4% Now married0.6% Separated11.5% Widowed9.0% DivorcedWomen who gave birth in the past 12 months Now married:
87.4% (286)Unmarried:
12.6% (41)
Women who did not give birth in the past 12 months Now married:
47.1% (828)Unmarried:
52.9% (930)
Marital status - Black or African American population 15 years and over
Males 15.6% Never married84.4% Now married0.0% Separated0.0% Widowed0.0% DivorcedFemales 52.8% Never married47.2% Now married0.0% Separated0.0% Widowed0.0% DivorcedWomen who gave birth in the past 12 months Now married:
100.0% (18)Unmarried:
0.0% (0)
Women who did not give birth in the past 12 months Now married:
48.5% (34)Unmarried:
51.5% (36)
Marital status - Asian population 15 years and over
Males 28.8% Never married54.8% Now married0.0% Separated0.0% Widowed16.4% DivorcedFemales 27.0% Never married64.2% Now married0.0% Separated2.8% Widowed5.9% DivorcedWomen who gave birth in the past 12 months Now married:
51.4% (56)Unmarried:
48.6% (53)
Women who did not give birth in the past 12 months Now married:
60.3% (187)Unmarried:
39.7% (123)
Marital status - Other race population 15 years and over
Males 59.1% Never married40.9% Now married0.0% Separated0.0% Widowed0.0% DivorcedFemales 26.3% Never married44.2% Now married5.6% Separated4.0% Widowed19.9% DivorcedWomen who did not give birth in the past 12 months Now married:
53.3% (396)Unmarried:
46.7% (346)
Marital status - Two or more races population 15 years and over
Males 18.1% Never married78.2% Now married0.0% Separated1.4% Widowed2.3% DivorcedFemales 17.3% Never married77.5% Now married0.0% Separated5.2% Widowed0.0% DivorcedWomen who did not give birth in the past 12 months Now married:
72.0% (413)Unmarried:
28.0% (160)
Marital status - White alone, not Hispanic / Latino population 15 years and over
Males 31.8% Never married56.3% Now married0.9% Separated3.2% Widowed7.7% DivorcedFemales 27.2% Never married55.1% Now married0.6% Separated9.4% Widowed7.7% DivorcedWomen who gave birth in the past 12 months Now married:
90.2% (289)Unmarried:
9.8% (31)
Women who did not give birth in the past 12 months Now married:
50.5% (862)Unmarried:
49.5% (845)
Marital status - Hispanic or Latino population 15 years and over
Males 41.5% Never married54.2% Now married0.0% Separated0.5% Widowed3.8% DivorcedFemales 21.5% Never married51.0% Now married2.1% Separated12.5% Widowed12.9% DivorcedWomen who gave birth in the past 12 months Now married:
77.6% (62)Unmarried:
22.4% (18)
Women who did not give birth in the past 12 months Now married:
50.2% (517)Unmarried:
49.8% (512)
Ancestries in North Arlington
953 10.3% Italian944 10.2% Polish809 8.7% Portuguese531 5.7% Irish227 2.5% Brazilian208 2.2% American192 2.1% Egyptian143 1.5% European132 1.4% Turkish69 0.7% Dutch58 0.6% Scottish46 0.5% Moroccan41 0.4% British33 0.4% Greek27 0.3% Iranian26 0.3% Eastern European22 0.2% German22 0.2% Russian20 0.2% French19 0.2% Scotch-Irish17 0.2% Lebanese14 0.2% Lithuanian1 0.01% English
Geographical mobility in North Arlington Same house 1 year ago 9,460 94.8% White (Caucasian)121 49.1% Black or African American6 22.7% American Indian / Alaska Native849 70.9% Asian8 100.0% Native Hawaiian / Pacific Islander2,207 92.8% Other race2,108 91.0% Two or more races8,317 94.8% White alone, not Hispanic / Latino4,752 89.7% Hispanic or LatinoMoved within same county 245 2.5% White / Caucasian2 0.7% Black or African American81 6.8% Asian29 1.2% Other race106 4.6% Two or more races231 2.6% White alone, not Hispanic / Latino152 2.9% Hispanic or LatinoMoved within same state 163 1.6% White / Caucasian183 74.2% Black or African American26 100.0% American Indian / Alaska Native145 12.1% Asian64 2.7% Other race102 4.4% Two or more races113 1.3% White alone, not Hispanic / Latino405 7.6% Hispanic or LatinoMoved from different state 37 0.4% White / Caucasian128 10.7% Asian41 0.5% White alone, not Hispanic / LatinoMoved from abroad 35 0.3% White69 2.9% Other race50 0.6% White alone, not Hispanic / Latino66 1.2% Hispanic or Latino
Children Nativity (place of birth) in North Arlington
Children under 6 years - Living with two parents Both parents native 416 100.0% NativeBoth parents foreign-born 91 100.0% NativeOne native, one foreign-born parent 242 100.0% NativeChildren under 6 years - Living with one parent Native parent 179 100.0% NativeForeign-born parent 15 100.0% NativeChildren 6 to 17 years - Living with two parents Both parents native 293 99.6% Native1 0.4% Foreign-bornBoth parents foreign-born 585 97.4% Native15 2.6% Foreign-bornOne native, one foreign-born parent 362 100.0% NativeChildren 6 to 17 years - Living with one parent Native parent 26 100.0% NativeForeign-born parent 400 51.8% Native372 48.2% Foreign-born